Temperature-, power-, and concentration-dependent two and three photon upconversion in Er3+/Yb3+ co-doped lanthanum ortho-niobate phosphors
J. P. C. do Nascimentoac,
A. J. M. Salesbc,
D. G. Sousabc,
M. A. S. da Silvac,
S. G. C. Moreirad,
K. Pavanie,
M. J. Soarese,
M. P. F. Graçae,
J. Suresh Kumar *e and
A. S. B. Sombrac
aDepartment of Chemistry, Federal University of Ceará, 60455-760, Fortaleza, CE, Brazil
bDepartment of Teleinformatics Engineering (DETI), Federal University of Ceará, Fortaleza, CE, Brazil
cLaboratory of Telecommunications and Materials Science and Engineering (LOCEM), Fortaleza, CE, Brazil
dDepartment of Physics, Federal University of Para, Brazil
eI3N, Department of Physics, University of Aveiro, Aveiro 3810-139, Portugal. E-mail: jskphysics@yahoo.co.in; suresh@ua.pt; Fax: +351 234378197; Tel: +351 234370356
First published on 6th July 2016
Abstract
Lanthanum ortho-niobate matrices, LaNbO4 (LNO), doped with rare-earth ions (Er3+ and Yb3+), were prepared by a high-temperature solid-state reaction method. The LNO matrices thus prepared were confirmed by X-ray diffraction followed by Rietveld refinement. Raman spectroscopy was used to analyze the vibrational energy of the undoped and rare-earth doped LNO ceramics. The upconversion fluorescence was studied in the co-doped samples using an NIR laser (980 nm) at low and high pump power as well as the effect of sample temperature. The effect of the laser power and concentration of Yb3+ ions on the fluorescence properties were elucidated. The upconversion obtained was found to be due to two as well as three photon processes. Temperature-dependent upconversion measurements were performed to elucidate the nature of the emission processes, and it was concluded that two and three photon upconversion processes have different behaviors.
1. Introduction
In recent years, several studies have been conducted employing ceramics with the objective of obtaining new fluorescent materials due to ceramics having high chemical stability and the possible to tailor their material properties with a relatively simple synthesis. These fluorescent materials can be used in several applications, such as lasers, LEDs, sensors, and optical data storage devices.1–5Due to the versatile properties of ceramic materials with the change of ingredients, research has focused on finding new materials that have upconversion (UC) luminescence; specifically, materials that have the ability to emit light at a wavelength lower than the exciting source. Among these fluorescent materials, of great interest are those that act as hosts for ions of a rare-earth type, since these ions can efficiently convert infrared light into visible light in an UC process. Hosts with lower phonon energy will be more efficient for this UC as the losses due to multiphonon relaxation will be smaller.6–10 The luminescence properties of ortho-niobate ceramic families have been reported in the literature as associated with either undoped or with rare-earth (RE3+) dopants.11–15 Nazarov et al. investigated the luminescent properties of YNbO4 co-doped with Eu3+, Ga3+, and Al3+ prepared by a solid-state reaction method. In their study, the materials under X-ray excitation presented downconversion luminescence in the blue, green, and red regions.11 J. Huang et al. studied the luminescent properties of a LaNbO4 (LNO) matrix co-doped with Eu3+ and Bi3+ also prepared by a solid-state reaction method. The materials, when excited in the UV region, demonstrated luminescence down-conversion in the green and red regions.12 Yan and Xiao studied LNO doped with Tb3+ prepared by a chemical co-precipitation process and observed a green emission when the matrix was excited in the UV region.13 Hsiao et al. noted that LNO matrix synthesized by a sol–gel process showed luminescence down-conversion in the blue region when excited at 206 nm.14 Zhang et al. observed that GdNbO4 co-doped with Eu3+ and Bi3+ prepared by a solid-state reaction method emits light in the red region when excited with UV radiation.15 A few studies have also reported on UC luminescence using LNO doped with rare-earth ions.16,17 Though there are different luminescence studies on LNO-based materials, these are restricted to the down-conversion mechanism only. Er3+ and Yb3+ ions are the twin ions most extensively studied for NIR to visible UC in material science,18 and this dopant pair can be used to demonstrate the upconversion properties of any material successfully. It is possible to have six photon-based UC with this pair depending on the working temperature, maximum phonon energy, and material characteristics of the host.19–21
In the present work, the lanthanum ortho-niobate matrix (LaNbO4) was chosen due to the fact that this material presents high chemical and thermal stability,12 and as the replacement of a La3+ ion by any other rare-earth (RE) ion would be more easily facilitated due to the compatibility with regard to charge and size. To the best of our knowledge, this is the first time that the LNO ceramic matrix has been used for co-doping Er3+ and Yb3+ rare-earth ions by a solid-state reaction method to obtain temperature- and power-dependent UC luminescence along with the variation in Yb3+ concentration. Hence, the present work has been undertaken to elucidate the characteristics of the LNO:Er:Yb material as an NIR to visible UC phosphor material.
2. Experimental
The syntheses of Er3+ and Yb3+ co-doped LaNbO4 (LNO) ceramic samples were achieved using the solid-state reaction method. The reagents used were the oxides of La2O3 (99.99%, Vetec), Nb2O5 (99.99%, Aldrich), Er2O3 (99.9%, Aldrich), and Yb2O3 (99.99%, Sigma Aldrich). In the doped samples, the concentration of Er3+ ions was kept constant at 1 mol%, while the concentration of Yb3+ ions varied from 2.5% up to 10%. For each sample and after weighting all the powders in a stoichiometric amount, mixing was carried out using a planetary ball-milling system operating at a speed of 370 rpm for 3 hours. Afterwards, the homogeneous powder mixture was calcinated in air at 1100 °C for 2 hours.The samples' structures were investigated by XRD at room temperature using powder samples in an X-ray diffractometer system (Rigaku D/max-B) with a graphite monochromator. Patterns were collected using Cu-Kα radiation (λ = 1.540598 Å), operating at 40 kV and 40 mA in a Bragg–Brentano geometry with a scan step of 0.013°. The Rietveld method was realized through the DBWS Tools software,22 with the ICSD (Inorganic Crystal Structure Database) database used to compare the diffraction patterns obtained and to identify the phases presents in the samples.
At room temperature, non-polarized Raman spectra were obtained using a Triple Raman Spectrometer model T64000 manufactured by HORIBA Scientific coupled to a Synapse CCD camera cooled to −70 °C. In this work, a laser line of 633 nm (17 mW power), provided by Thorlabs Inc., was used as the source of excitation. The backscattering geometry was adopted in all the Raman measurements (spectrum resolution of 1 cm−1).
The microstructure and morphology of the samples were studied by analyzing the surface grain distribution and the influence of the dopants on the sample surface by scanning electron microscopy (SEM) using a TESCAN VEGA3 microscope, at room temperature.
Near infrared (NIR) to visible UC was recorded using two different setups for low and high power, respectively. For low power (<100 mW) and at room temperature, the excitation source used was a Diode-Pumped Solid-State Laser (DPSSL), LD-WL206 model, operating at 980 nm. The luminescence signal was collected and directed to a fiber integrated UV-Vis-NIR spectrometer (Ocean Optics HR4000) with an operating resolution of ≤1.0 nm and employing the Ocean Optics-Spectra Suite software of the spectrometer. For high power, i.e., greater than 100 mW, the spectra were recorded using an integrated system consisting of an RLTMDL-980-1W model diode laser and a Spex 1702/1704 spectrometer, equipped with a cryostat and vacuum pump, with a resolution of ≤0.05 nm. Labview software was used to process and acquire the data either at room temperature or low temperatures.
3. Results and discussion
3.1 Structural analysis using X-ray diffraction
The diffraction patterns of the synthesized samples are presented in Fig. 1(a). It can be observed that there is good agreement between the diffraction peaks of all the doped samples with the diffraction patterns of the host LNO and of the ICSD, indicating that all the doped samples maintain the host structure and do not have any structural imperfections because of doping.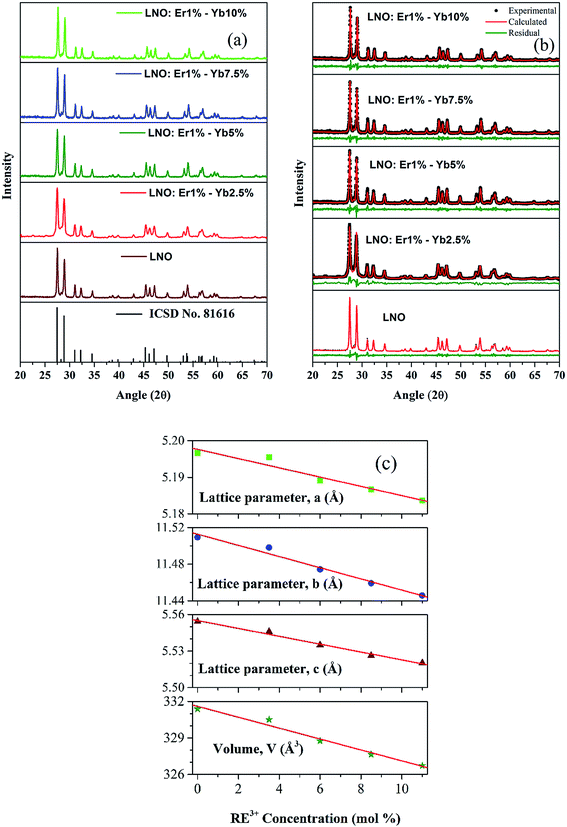 | ||
| Fig. 1 (a) XRD patterns, (b) Rietveld refinement of undoped and Er3+–Yb3+ co-doped LNO samples and (c) variation of lattice constants as well as volume with total RE3+ concentration. | ||
No additional diffraction peaks were found, indicating no formation of impure/unwanted phases. In addition, the full-width at half-maximum (FWHM) is gradually broadened with increasing the dopant concentration due to the increase in disorder and strain caused in the host lattice with the presence of the dopant ions. All these facts provide strong evidence that the doped ions entered effectively into the host lattice of LNO without the formation of other phases.
Rietveld refinement was performed to confirm the absence of secondary phases and to find the lattice parameters of the synthesized samples. Fig. 1(b) shows the results of the Rietveld refinement with low residual values between the observed and the calculated diffraction patterns, indicating that the realized refinement is reliable.
Table 1 presents the parameters of the Rietveld refinement realized while fitting. The values of S, the weighted-profile reliability factor, Rwp, and the Bragg intensity reliability factor, RBragg, using the LNO (ICSD: 81616) phase were adequate and confirmed the substitution of La3+ by Er3+ and Yb3+ ions, and the formation of a single phase in all the samples. The lattice parameters (a, b, and c) as well as the volume (V) obtained from the Rietveld refinement were plotted against the concentration of the dopant RE3+ ions, and the results are shown in Fig. 1(c). A linear decreasing trend in the lattice parameters as well as in the volume can be noticed with the increase in RE3+ concentration. This behavior is in accordance with Vegard's law, indicating that the samples form good solid solutions.23,24
| Sample | Lattice parameters | V (Å3) | Rwp (%) | RBragg (%) | S (%) | ||
|---|---|---|---|---|---|---|---|
| a (Å) | b (Å) | c (Å) | |||||
| LNO | 5.1966 | 11.5095 | 5.5542 | 331.3804 | 14.49 | 3.28 | 1.24 |
| LNO:Er1%–Yb2.5% | 5.1955 | 11.4982 | 5.5459 | 330.5045 | 19.36 | 6.52 | 1.16 |
| LNO:Er1%–Yb5% | 5.1891 | 11.4744 | 5.5350 | 328.7527 | 18.97 | 4.67 | 1.14 |
| LNO:Er1%–Yb7.5% | 5.1867 | 11.4591 | 5.5263 | 327.6494 | 18.59 | 4.53 | 1.11 |
| LNO:Er1%–Yb10% | 5.1837 | 11.4458 | 5.5203 | 326.7256 | 18.30 | 4.22 | 1.12 |
3.2 Raman spectroscopy
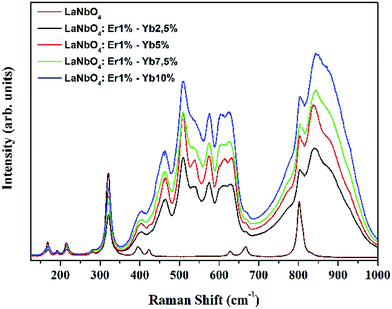
Laser Raman spectroscopy was performed to investigate the vibrational modes of the undoped and co-doped LNO samples. The results obtained are shown in Fig. 2. The vibrational modes observed in the Raman spectrum of LNO showed good consistency with other studies reported in the literature.25–28 LNO has a C2h symmetry and can be considered as being formed by tetrahedral NbO43− groups and La3+ ions, where the modes below 300 cm−1 can be associated to La3+ ions present in the crystal lattice. The other higher modes can be related as follows: the mode around 332 cm−1 (ν2) can be attributed to the symmetric deformation of the tetrahedron; those at 394.5 and 422.9 cm−1 (ν4) can be assigned to asymmetric deformations in the tetrahedral structure; those at 628.7 and 667 cm−1 (ν3) can be assigned to the antisymmetric Nb–O stretching; and the mode at 801.9 cm−1 (ν1) can be associated to the symmetric stretching of Nb–O bonds in the tetrahedron. This latter mode is associated with the higher energy phonon, which indicates that this matrix can be considered as a good host for UC luminescence.25–28In the samples co-doped with RE3+ ions, all the possible modes related to LNO were also observed, along with the intense luminescence bands of Er3+ ions because of the excitation at 633 nm and due to its inherent 4I15/2 → 4F9/2 absorption band. Hence, the Raman modes were embedded in the photoluminescence spectra and it is thus clearly evident that these samples maintain the crystal structure of the host lattice. These types of bands due to the luminescence of dopants ions have also been observed for other RE3+ ions in several other reports in the literature.28–35
3.3 Morphology analysis using scanning electron microscopy
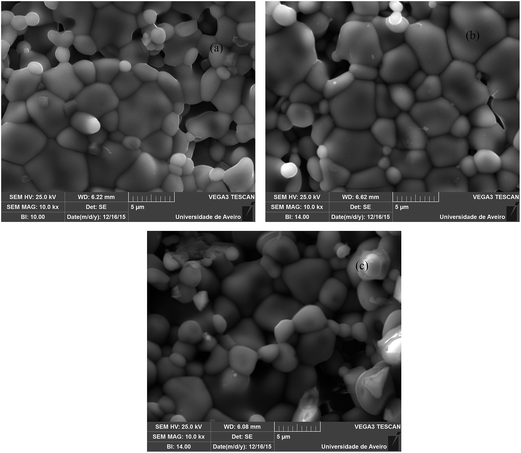
Fig. 3 shows the SEM micrographs at room temperature of the undoped LNO and LNO doped with Er3+ and Yb3+ ions. The SEM images show the clear grain boundaries of the powder particles. The shapes of the grains are irregular and the grain size was found to be in the range of 1–5 μm. The images presented here belong to the host LNO (Fig. 3(a)), LNO:Er1%–Yb5% (Fig. 3(b)), and LNO:Er1%–Yb10% (Fig. 3(c)), and show the surfaces of the respective samples. The dopants do not cause any considerable change in the surface of the grains, hence it can be assumed that the doping does not affect the structure of the phosphor powders. The SEM images of the other phosphors are not shown because of the similar morphology.3.4 Concentration- and power-dependent upconversion spectra
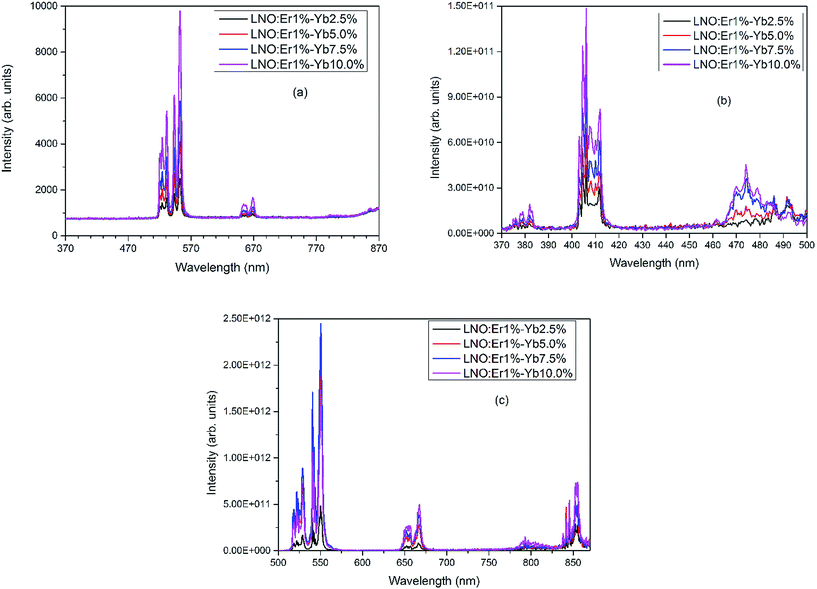
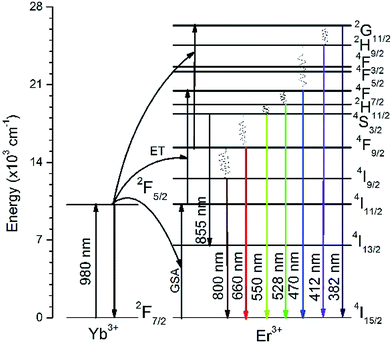
A series of UC luminescence measurements were performed on Er3+ and Yb3+ co-doped LNO samples using a 980 nm diode laser. Fig. 4(a) shows the UC spectra in the wavelength range of 370–870 nm with a laser power less than 100 mW with varying the Yb3+ concentration, whereas Fig. 4(b) and (c) show the room temperature UC spectra of LNO:Er:Yb samples in the range of 370–500 nm and 500–870 nm with 400 mW laser power. An energy level diagram showing the different UC emissions through energy transfer (ET) is presented in Fig. 5.The UC spectra in total consist of eight bands spanning the region 370–870 nm when excited with high power (>100 mW). When exited with low power (<100 mW), the bands below 500 nm were absent, while the UC bands above 700 nm were very low in intensity due to the power used and the too low sensitivity of the detector as the two experimental setups were different for the two different laser power devices. The spectral bands are the outcome of both two and three photon UC, and are associated with electronic transitions that occur between the 4f orbitals of Er3+ ions, as shown in Fig. 5.29–31 The UC bands shown in Fig. 4(a)–(c) centered at 382, 412, 470, 528, 550, 660, and 800 are assigned to transitions arising from excited 2G11/2, 2H9/2, 4F7/2, 2H11/2, 4S3/2, 4F9/2, 4I9/2 states to the ground 4I15/2 state, whereas the band at 855 nm is due to an 4S3/2 → 4I13/2 transition, respectively, spanning the whole visible region along with one band at 382 nm in the UV region and two bands at 800 and 855 nm in the NIR region. In the visible region, the emission bands at 412 and 470 nm are in the violet and blue regions, while the bands at 528 and 550 nm are in green region and the band at 660 nm is in the red region, respectively.29,32,33 The UC bands, as seen in Fig. 4(a)–(c), possess sharp splits owing to the crystal-field splitting of their respective transitions due to the high crystallinity and successful substitution of Er3+ and Yb3+ ions in the La3+ sites of the host lattice. The variation of the UC bands shows that, as the concentration of Yb3+ ions increases, the intensity of the UC increases for all the bands except for the bands in the green region at 528 and 550 nm with high laser power. Even the intensities of the bands in the green region with high laser power increase with the increasing concentration of Yb3+ ions up till 7.5 mol% and then decreases, as shown in Fig. 4(c). This may be due to the Gaussian population distribution between the two energy levels being very close to each other. Furthermore, it can be ascribed that the intensities may still decrease with the further increase of the Yb3+ concentration. For all the other UC bands, except those in the green region, the maximum intensity is obtained at 10% of Yb3+ ions. Here, we observed that at all the concentrations of Yb3+ ions, the intensity in the green region was always greater than in the red region and in the infrared regions at room temperature. Furthermore, it was also observed that the intensities of the UC bands in the region of 370–500 nm (Fig. 4(b)) were relatively weak compared to that in the region of 500–870 nm (Fig. 4(c)). This may be due to the fact that the lower wavelength UC bands arise due to the involvement of a greater number of photons. In various other studies, a high concentration of Yb3+ ions favors a mechanism that leads the Er3+ ions to the excited state 4F9/2, making the intensity grow in the red region, while the intensity in the green region decreases to the point at which red becomes more intense than the green region.29,33 However, in the present study, at room temperature, the situation that increased the red UC band compared to the green was not observed.
The process of UC in Er3+ and Yb3+ co-doped LNO samples involves two and three photons, as shown in Fig. 5. The first photon excites Er3+ from the ground 4I15/2 state to the excited 4I11/2 state and this can occur through ground state absorption (GSA) or energy transfer (ET) from Yb3+ to Er3+ ions. The process of ET dominates over GSA because of the low (1 mol%) concentration of Er3+ as well as the low absorption cross-section of Er3+ ions at 980 nm compared to that of Yb3+ ions. In fact, there is an increase in UC intensity with the increase in Yb3+ concentration in the co-doped samples and, hence, the probability of ET occurring is assumed to be higher compared to GSA.29,32 The second photon excites the already excited Er3+ ions in level 4I11/2 to 4F7/2. Because of the non-radioactive relaxation of Er3+ ions from 4F7/2 to the 2H11/2, 4S3/2, 4F9/2, and 4I9/2 levels, radiative transitions are observed with the transitions from the respective excited levels to the ground 4I15/2 level, with emissions at 528, 550, 660, and 800 nm, respectively, and from the 4S3/2 to 4I13/2 state, with an emission at 855 nm. At a higher laser power, ET with more than two photons can also be observed. In the present case, three photon UC was observed. The Er3+ ions which are excited with two photons, reach 4F7/2 and with non-radiative relaxation reach 4F9/2 level at which a third photon from Yb3+ ion excites them again to 2G11/2 level. The ions first excited to the 2G11/2 state partially relax to the ground 4I15/2 state radiatively to emit at 382 nm, while the remaining ions, through a combination of radiative and non-radiative relaxations, reach the ground 4I15/2 state while emitting at 412 and 470 nm from the 2H9/2 and 4F5/2 states, as shown in Fig. 5. As the UC bands presented in Fig. 4(b) are based on three photons, the intensities are very low compared to that of the two-photons-based UC bands in Fig. 4(c). Also, at low laser power, the UC bands related to the three photon process are absent.
It is well known that for unsaturated UC processes, the number of photons required to populate the upper states can be obtained by the following general equation:36
| I ∝ Pn | (1) |
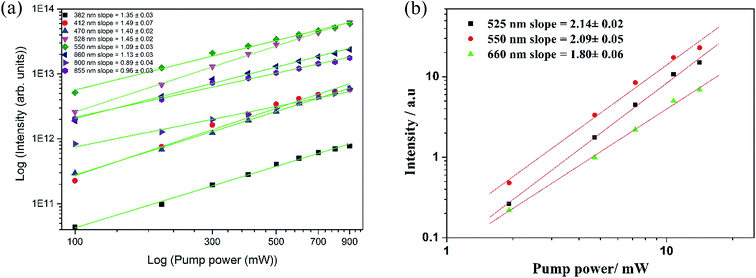 | ||
| Fig. 6 Dependence of the upconversion emission band intensities as a function of laser pump power at (a) high powers and (b) low powers for LNO:Er1%–Yb7.5%. | ||
3.5 Temperature-dependent upconversion spectra
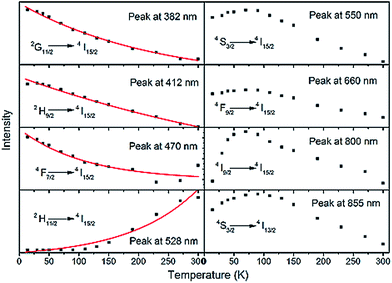
Fig. 7(a) and (b) show the temperature-dependent UC spectra for LNO:Er1%–Yb7.5% for three and two photon processes in the regions of 350–500 and 500–870 nm, respectively. The temperature dependence can predict the nature of the UC processes in a matrix and hence has been studied.21,39 All the UC spectra were recorded at a laser pump power of 400 mW in the temperature range of 14–300 K. With the change in temperature, no change in the band structures or in the band positions were observed, proving that temperature does not influence the structure of the matrix in which the RE3+ ions were doped. Only the intensities of the UC bands changed with temperature. Fig. 8 depict the variation of various three and two photon UC band intensities with an increase of temperature from 14 K to 300 K.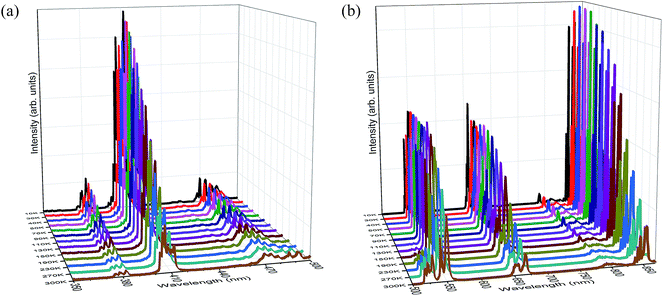 | ||
| Fig. 7 Temperature dependent upconversion spectra of LNO:Er1%–Yb7.5% in the regions (a) 350–500 nm and (b) 500–870 nm. | ||
The variation of three-photon-based UC band intensities, as shown in Fig. 8, show that, as the temperature increases, the intensities of the bands decrease exponentially. This decrease can be expected because of the exponential increase of phonons in the matrix with temperature. Hence, at low temperature (in this case 14 K), the intensities of the three-photon-based UC bands are high and decrease exponentially.
Among the two-photon-based UC bands, the band corresponding to the 2H11/2 → 4I15/2 transition at 582 nm increased with temperature exponentially, due to thermal stimulation of the photons between the states 2H11/2 and 4S3/2 because of the very low energy difference between the states, as explained elsewhere.18,40 The remaining two-photon-based UC bands, corresponding to 4S3/2 → 4I15/2, 4F9/2 → 4I15/2 and 4I9/2 → 4I15/2, first increase their intensities up to 100 K and then decrease. This steady increase and decrease of intensities with temperature was previously observed in other compounds.41,42 The increase of UC intensities is due to the energy difference between the two lowest crystal-field components 2F5/2|0〉 (lower) and 2F5/2|1〉 (upper) of the Yb3+ ions and as the energy transfer from 2F5/2|1〉 to the lowest energy crystal-field component pertaining to the 4I11/2 state of the Er3+ ions is very efficient. According to Boltzmann's distribution, at low temperature, the fraction of excited Yb3+ ions' population in the 2F5/2|1〉 component is low compared to that in the 2F5/2|0〉 component and hence the efficient energy transfer to the 4I11/2 state of the Er3+ ions is low. As the temperature increases, the fraction of Yb3+ ions' population in the 2F5/2|1〉 state component increases, eventually increasing the UC band intensities.41,42 In the present LNO:Er1%–Yb7.5% sample, the optimum temperature up to which the two-photon-based UC bands increase is about 100 K, after which they tend to decrease due to the multiphonon de-excitation of the 4S3/2, 4F9/2, and 4I9/2 levels, which increases significantly above 100 K.41,43,44 In the case of three-photon-based UC bands, the impact of the excited states population distribution is less due to the involvement of three photons and hence a normal exponential decrease of UC band intensities was observed. The temperature- and power-dependent upconversion mechanisms in SLA material due to the doping of Er3+ and Yb3+ ions shows that the SLA material is one of the best materials to be used as an upconversion phosphor material with considerably low phonon energies.
4. Conclusion
In this work, Er3+–Yb3+ co-doped LaNbO4 were prepared by a high-temperature solid-state reaction, and the upconversion results were presented. The measurements of X-ray diffraction and the successful Rietveld's refinement and concurrence of Vegard's law with the increase of dopant concentration showed that no additional phases were found and the samples formed good solid solutions. The Raman bands presented new modes for doped LaNbO4 samples, which could be related to the presence of the rare-earth Er3+ and Yb3+ ions. Upconversion was recorded with 980 nm excitation and all the bands increased their intensities with the increase of Yb3+ concentration, with the exception for a pair of thermally coupled 2H11/2 and 4S3/2 levels. Upconversion band intensities plotted as a function of laser pump power revealed that the bands at low pump powers were due to two photons, but for high pump power, saturation effects were observed. The temperature-dependent upconversion intensities revealed an exponential decrease for three photon processes while the two photon processes varied by first increasing and then decreasing with temperature due to the difference in crystal-field levels of the activator and sensitizer at low temperatures. Moreover, the upconversion band from 2H11/2 behaved differently due to Boltzmann's population distribution between 2H11/2 and 4S3/2 with the increase of temperature. Hence, from all the results, it can be concluded that the samples of LaNbO4 doped with Er3+ and Yb3+ ions are undoubtedly favorable materials for upconversion luminescence in UV-Vis-NIR region with NIR excitation, due to their having relatively low phonon energies among other oxide-based phosphors, indicating that these materials would be candidates of potential interest for application in LEDs emitting visible green emission when excited with an IR source.Acknowledgements
The authors acknowledge the Post Doctoral grant FCT/BPD/75857/2011 and i3N budget (UID/CTM/50025/2013) from Fundação para a Ciência e a Tecnologia (FCT), Portugal and the financial support from Conselho Nacional de Desenvolvimento Científico e Tecnológico (CNPq); Coordenação de Aperfeiçoamento de Pessoal de Nível Superior (CAPES), Fundação Cearense de Apoio ao Desenvolvimento Científico e Tecnológico (FUNCAP) and the U. S. Air Force Office of Scientific Research (AFOSR) (FA9550-11-1-0095).References
- J.-C. G. Bünzli and S. V. Eliseeva, Lanthanide NIR luminescence for telecommunications, bioanalyses and solar energy conversion, J. Rare Earths, 2010, 28(6), 824–842 CrossRef
.
- X. Xiao and B. Yan, Synthesis and luminescent properties of novel RENbO4:Ln3+ (RE = Y, Gd, Lu; Ln = Eu, Tb) micro-crystalline phosphors, J. Non-Cryst. Solids, 2005, 351(46–48), 3634–3639 CrossRef CAS
.
- L. Li, X.-q. Cao, Y. Zhang and C.-x. Guo, Synthesis and upconversion luminescence of Lu2O3:Yb3+,Tm3+ nanocrystals, Trans. Nonferrous Met. Soc. China, 2012, 22(2), 373–379 CrossRef CAS
.
- L. A. Gómez, L. d. S. Menezes, C. B. de Araújo, R. R. Gonçalves, S. J. L. Ribeiro and Y. Messaddeq, Upconversion luminescence in Er3+ doped and Er3+/Yb3+ codoped zirconia and hafnia nanocrystals excited at 980 nm, J. Appl. Phys., 2010, 107(11), 113508 CrossRef
.
- X. L. Pang, C. H. Jia, G. Q. Li and W. F. Zhang, Bright white upconversion luminescence from Er3+–Tm3+–Yb3+ doped CaSnO3 powders, Opt. Mater., 2011, 34(1), 234–238 CrossRef CAS
.
- D. Wang, Y. Guo, E. Zhang, X. Chao, L. Yu and J. Luo, et al., Synthesis and NIR-to-violet, blue, green, red upconversion fluorescence of Er3+:LaOBr, J. Alloys Compd., 2005, 397(1–2), 1–4 CAS
.
- H. Guo, N. Dong, M. Yin, W. Zhang, L. Lou and S. Xia, Visible Upconversion in Rare Earth Ion-Doped Gd2O3 Nanocrystals, J. Phys. Chem. B, 2004, 108(50), 19205–19209 CrossRef CAS
.
- R. Wang, J. Xu and C. Chen, Luminescent characteristics of Sr2B2O5: Tb3+, Li+ green phosphor, Mater. Lett., 2012, 68, 307–309 CrossRef CAS
.
- V. K. Rai, R. Dey and K. Kumar, White upconversion emission in Y2O3:Er3+–Tm3+–Yb3+ phosphor, Mater. Res. Bull., 2013, 48(6), 2232–2236 CrossRef CAS
.
- X. Pan, J. Yu, Y. Liu, S. Yoda, M. Zhang and F. Ai, et al., Infrared to visible upconversion luminescence in Er3+/Yb3+ doped titanate glass prepared by containerless processing, J. Lumin., 2012, 132(4), 1025–1029 CrossRef CAS
.
- M. Nazarov, Y. J. Kim, E. Y. Lee, K.-I. Min, M. S. Jeong and S. W. Lee, et al., Luminescence and Raman studies of YNbO4 phosphors doped by Eu3+, Ga3+ and Al3+, J. Appl. Phys., 2010, 107(10), 103104 CrossRef
.
- J. Huang, L. Zhou, Z. Liang, F. Gong, J. Han and R. Wang, Promising red phosphors LaNbO4:Eu3+, Bi3+ for LED solid-state lighting application, J. Rare Earths, 2010, 28(3), 356–360 CrossRef CAS
.
- B. Yan and X. Z. Xiao, Matrix induced synthesis of LaNbO4:Tb3+ phosphors by in situ composing hybrid precursors, Opt. Mater., 2006, 28(5), 498–501 CrossRef CAS
.
- Y. J. Hsiao, T. H. Fang, Y. S. Chang, Y. H. Chang, C. H. Liu and L. W. Ji, et al., Structure and luminescent properties of LaNbO4 synthesized by sol–gel process, J. Lumin., 2007, 126(2), 866–870 CrossRef CAS
.
- D.-f. Zhang, A. Tang, L. Yang and Z.-t. Zhu, Potential red-emitting phosphor GdNbO4:Eu3+, Bi3+ for near-UV white light emitting diodes, Int. J. Miner., Metall. Mater., 2012, 19(11), 1036–1039 CrossRef CAS
.
- M. Bass, A. Rapaport and H. Jennsen, Dispersed crystallite up-conversion displays, inventors, US 2002/0015218 A1, assignee, 2002
.
- A. Rapaport-Zoubir, A. J. Milliez, M. Bass and H. P. Jenssen, Substrate design for optimized performance of up-conversion phosphors utilizing proper thermal management, inventors,
US RE42,389 E, assignee, 2011
.
- J. Suresh Kumar, K. Pavani, M. P. F. Graça and M. J. Soares, Enhanced green upconversion by controlled ceramization of Er3+–Yb3+ co-doped sodium niobium tellurite glass-ceramics for low temperature sensors, J. Alloys Compd., 2014, 617, 108–114 CrossRef CAS
.
- K. Zheng, D. Zhao, D. Zhang, N. Liu and W. Qin, Temperature-dependent six-photon upconversion fluorescence of Er3+, J. Fluorine Chem., 2011, 132(1), 5–8 CrossRef CAS
.
- H. Suo, C. Guo, Z. Yang, S. Zhou, C. Duan and M. Yin, Thermometric and optical heating bi-functional properties of upconversion phosphor Ba5Gd8Zn4O21:Yb3+/Tm3+, J. Mater. Chem. C, 2015, 3(28), 7379–7385 RSC
.
- K. Zheng, G. He, W. Song, X. Bi and W. Qin, A strategy for enhancing the sensitivity of optical thermometers in β-NaLuF4:Yb3+/Er3+ nanocrystals, J. Mater. Chem. C, 2015, 3(44), 11589–11594 RSC
.
- L. Bleicher, J. M. Sasaki and C. O. Paiva Santos, Development of a graphical interface for the Rietveld refinement program DBWS, J. Appl. Crystallogr., 2000, 33(4), 1189 CrossRef CAS
.
- G. Li, C. C. Lin, W.-T. Chen, M. S. Molokeev, V. V. Atuchin and C.-Y. Chiang, et al., Photoluminescence Tuning via Cation Substitution in Oxonitridosilicate Phosphors: DFT Calculations, Different Site Occupations, and Luminescence Mechanisms, Chem. Mater., 2014, 26(9), 2991–3001 CrossRef CAS
.
- J. K. Han, M. E. Hannah, A. Piquette, J. B. Talbot, K. C. Mishra and J. McKittrick, Europium-Activated KSrPO4–(Ba,Sr)2SiO4 Solid Solutions as Color-Tunable Phosphors for Near-UV Light-Emitting Diode Applications, J. Am. Ceram. Soc., 2013, 96(5), 1526–1532 CrossRef CAS
.
- K. P. F. Siqueira, R. L. Moreira and A. Dias, Synthesis and Crystal Structure of Lanthanide Ortho-niobates Studied by Vibrational Spectroscopy, Chem. Mater., 2010, 22(8), 2668–2674 CrossRef CAS
.
- J. M. Jehng and I. E. Wachs, Structural chemistry and Raman spectra of niobium oxides, Chem. Mater., 1991, 3(1), 100–107 CrossRef CAS
.
- C. C. Santos, E. N. Silva, A. P. Ayala, I. Guedes, P. S. Pizani and C.-K. Loong, et al., Raman investigations of rare earth orthovanadates, J. Appl. Phys., 2007, 101(5), 053511 CrossRef
.
- M. Nazarov, Raman spectroscopy of double activated YNbO4:Eu3+, Tb3+ and YTaO4:Eu3+, Tb3+, Mold. J. Phys. Sci., 2010, 9, 5–15 Search PubMed
.
- Y. Li, X. Wei and M. Yin, Synthesis and upconversion luminescent properties of Er3+ doped and Er3+–Yb3+ codoped GdOCl powders, J. Alloys Compd., 2011, 509(41), 9865–9868 CrossRef CAS
.
- F. A. Bomfim, J. R. Martinelli, L. R. P. Kassab, N. U. Wetter and J. J. Neto, Effect of the ytterbium concentration on the upconversion luminescence of Yb3+/Er3+ co-doped PbO–GeO2–Ga2O3 glasses, J. Non-Cryst. Solids, 2008, 354(42–44), 4755–4759 CrossRef CAS
.
- T.-F. Xu, G.-P. Li, Q.-H. Nie and X. Shen, Study of upconversion fluorescence property of novel Er3+/Yb3+ co-doped tellurite glasses, Spectrochim. Acta, Part A, 2006, 64(3), 560–563 CrossRef PubMed
.
- Z. Chen, W. Gong, T. Chen, S. Li, D. Wang and Q. Wang, Preparation and upconversion luminescence of Er3+/Yb3+ codoped Y2Ti2O7 nanocrystals, Mater. Lett., 2012, 68, 137–139 CrossRef CAS
.
- F. Vetrone, J.-C. Boyer, J. A. Capobianco, A. Speghini and M. Bettinelli, Significance of Yb3+ concentration on the upconversion mechanisms in codoped Y2O3:Er3+,Yb3+ nanocrystals, J. Appl. Phys., 2004, 96(1), 661–667 CrossRef CAS
.
- F. Vetrone, J.-C. Boyer, J. A. Capobianco, A. Speghini and M. Bettinelli, Concentration-Dependent Near-Infrared to Visible Upconversion in Nanocrystalline and Bulk Y2O3:Er3+, Chem. Mater., 2003, 15(14), 2737–2743 CrossRef CAS
.
- J. Cui and G. A. Hope, Raman and Fluorescence Spectroscopy of CeO2, Er2O3, Nd2O3, Tm2O3, Yb2O3, La2O3, and Tb4O7, J. Spectrosc., 2015, 2015, 1–7 CrossRef CAS
.
- M. Pollnau, D. R. Gamelin, S. R. Lüthi, H. U. Güdel and M. P. Hehlen, Power dependence of upconversion luminescence in lanthanide and transition-metal-ion systems, Phys. Rev. B: Condens. Matter Mater. Phys., 2000, 61(5), 3337–3346 CrossRef CAS
.
- L. Tian, Z. Xu, S. Zhao, Y. Cui, Z. Liang and J. Zhang, et al., The upconversion luminescence of Er3+/Yb3+/Nd3+ triply-doped β-NaYF4 nanocrystals under 808 nm excitation, Materials, 2014, 7(11), 7289–7303 CrossRef
.
- A. J. M. Sales, D. G. Sousa, H. O. Rodrigues, M. M. Costa, A. S. B. Sombra and F. N. A. Freire, et al., Power dependent upconversion in Er3+/Yb3+ co-doped BiNbO4 phosphors, Ceram. Int., 2016, 42(6), 6899–6905 CrossRef CAS
.
- K. Zheng, Z. Liu, C. Lv and W. Qin, Temperature sensor based on the UV upconversion luminescence of Gd3+ in Yb3+–Tm3+–Gd3+ codoped NaLuF4 microcrystals, J. Mater. Chem. C, 2013, 1(35), 5502–5507 RSC
.
- M. Kaczkan, Z. Boruc, S. Turczyński and M. Malinowski, Effect of temperature on the luminescence of Sm3+ ions in YAM crystals, J. Alloys Compd., 2014, 612, 149–153 CrossRef CAS
.
- K. Wu, J. Cui, X. Kong and Y. Wang, Temperature dependent upconversion luminescence of Yb/Er codoped NaYF4 nanocrystals, J. Appl. Phys., 2011, 110(5), 053510 CrossRef
.
- J. F. Suyver, J. Grimm, K. W. Krämer and H. U. Güdel, Highly efficient near-infrared to visible up-conversion process in, J. Lumin., 2005, 114(1), 53–59 CrossRef CAS
.
- I. R. Martín, P. Vélez, V. D. Rodríguez, U. R. Rodríguez-Mendoza and V. Lavín, Upconversion dynamics in Er3+-doped fluoroindate glasses, Spectrochim. Acta, Part A, 1999, 55(5), 935–940 CrossRef
.
- J. T. Vallin, G. A. Slack, S. Roberts and A. E. Hughes, Infrared Absorption in Some II–VI Compounds Doped With Cr, Phys. Rev. B: Solid State, 1970, 2(11), 4313–4333 CrossRef
.
| This journal is © The Royal Society of Chemistry 2016 |

