Ground-state conformers enable bright single-fluorophore ratiometric thermometers with positive temperature coefficients†
Weijie
Chi
a,
Wenting
Yin
b,
Qingkai
Qi
b,
Qinglong
Qiao
b,
Yuyan
Lin
c,
Zhuohui
Zhu
c,
Sindhu
Vijayan
a,
Michinao
Hashimoto
a,
Gayathri
Udayakumar
c,
Zhaochao
Xu
 *b and
Xiaogang
Liu
 *ac
*ac
aSingapore University of Technology and Design, 8 Somapah Road, 487372, Singapore. E-mail: xiaogang_liu@sutd.edu.sg
bKey Laboratory of Separation Science for Analytical Chemistry, Dalian Institute of Chemical Physics, Chinese Academy of Sciences, 457 Zhongshan Road, Dalian 116023, China. E-mail: zcxu@dicp.ac.cn
cSingapore-MIT Alliance for Research and Technology (SMART), 1 CREATE Way, 138602, Singapore
First published on 28th August 2017
Abstract
Fluorescence thermometry based on organic dyes affords high spatial and temporal resolution with a simple system design and low cost, for measuring temperatures in microenvironments. Many fluorescent thermometers consist of two types of fluorophores with distinct temperature responses, and the ratios of their fluorescence intensities afford accurate temperature information. Yet, the reliability of these ratiometric thermometers is vulnerable to photobleaching induced system variations. In this paper, we have proposed and demonstrated a new strategy, to achieve ratiometric temperature measurements from 15 °C to 75 °C, based on ground-state conformational isomers of a single type of dye. These ground-state conformers emit bright fluorescence, in contrast to excited-state conformational changes that generally quench emissions. Moreover, thermal equilibrium of these conformers and their distinct spectra lead to ratiometric temperature readings that are not affected by photobleaching. We expect that our design strategy has significant implications for developing fluorescence thermometry with outstanding reliability.
Introduction
Organic dye based fluorescent temperature sensors permit dynamic measurement of temperatures with high spatial and temporal resolution.1,2 Their outstanding resolution and biocompatibility enable a broad range of applications that are impossible with numerous macroscale thermometers. Such applications span from monitoring the whole field temperature distribution in water3 to revealing heat exchange in microfluidic channels,4,5 from temperature control in industrial processing6,7 to heat regulation in biological cells.8–11 Nevertheless, the long-term reliability of these temperature sensors remains a critical challenge due to unavoidable photobleaching of organic dyes under repetitive laser irradiation.To address the reliability issues, two main techniques have been developed.12 Fluorescence lifetime imaging permits accurate measurements that are independent of dye concentrations and laser excitation power. Yet, expensive time-gated electronics and limited temporal resolution in fluorescence-lifetime imaging microscopy (FLIM) render this technique less accessible than fluorescence intensity based measurements.1 Similarly, by utilizing two types of fluorophores with distinct temperature responses in a thermometer, the ratios of their emission intensities afford reliable temperature measurements that are comparable to FLIM results in principle.3,13,14 However, due to different environmental sensitivity, photostability and photobleaching rates between these two types of dyes, their relative concentrations change over time and thus greatly compromise the reliability of dual-fluorophore ratiometric sensors. Besides these two main strategies, smart optical designs have also been developed to enhance the reliability of a thermometer. For example, Peter Löw and co-workers used an automated shutter to reduce exposure time to fluorophores, aiming to minimize the impact of photobleaching.15 Such measures prolong the lifespan of the system, but do not completely solve the reliability issues.
To solve the reliability problem of dual-fluorophore ratiometric sensors, we propose a new strategy that allows the ratiometric measurement of temperatures based on a single type of fluorophore. Fluorophores in a single-fluorophore ratiometric sensor should possess multiple conformational isomers, which co-exist at the working temperatures of a thermometer and display distinct spectral properties. Consequently, thermal equilibrium between these conformers not only enables ratiometric temperature sensing, but also avoids varied photobleaching rates in dual-fluorophore ratiometric sensors. Moreover, these conformational isomers may collectively endow fluorophores with novel optical properties that are unachievable in many existing organic fluorophores. For example, if increasing temperature raises the population of a more emissive conformer, this fluorophore could display brighter emissions at higher temperatures, or a positive temperature coefficient.16
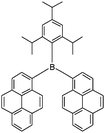
In this paper, we have discussed molecular design considerations to realize single-fluorophore ratiometric imaging. We demonstrate our strategy by employing ground state conformational isomers of DPTB to construct a ratiometric fluorescent thermometer (Scheme 1). We show that DPTB in combination with a standard digital camera allows reliable determinations of temperatures from 15 °C to 75 °C via a simple system design. In addition, we show that multiple conformational isomers of DPTB endow it with an unusual positive temperature coefficient in certain solvents [i.e., ethyl acetate (EA) and dimethyl sulfoxide (DMSO)].
Molecular design strategy
Realizing a single-fluorophore ratiometric thermometer requires that a fluorophore possesses multiple emissive conformers. If these emissive conformers demonstrate different fluorescence wavelengths, possess distinct temperature dependence, and are all accessible at the working temperatures of a probe, the ratios of their fluorescence intensities will permit single-fluorophore ratiometric temperature measurements.Currently, it is well-known that many fluorophores exhibit more than one conformer in the excited state (Fig. 1a). One common phenomenon is the conversion between a local excited (LE) state and a twisted intramolecular charge transfer (TICT) state upon photo-excitation (Fig. 1b).17 In the LE state, a dye remains nearly flat and highly emissive. In contrast, the TICT state is manifested by a ∼90° twisting between an electron-donating moiety (D) and an electron-accepting moiety (A). The TICT state is typically non-emissive and highly reactive. The other well-known phenomenon is aggregation induced emission (AIE; Fig. 1c).18,19 AIE molecules are structurally flexible, possessing different conformational isomers via intramolecular rotations. Such intramolecular rotations significantly quench the fluorescence of monomer fluorophores, while restricting these rotations in the aggregated state turns on bright fluorescence. In addition to TICT and AIE, several other types of intramolecular rotations/flapping have also been reported.20,21 However, while intramolecular rotations generate conformational isomers, such rotations also accelerate non-radiative decay, resulting in weak fluorescence signals and sacrificing the feasibility of ratiometric imaging (especially in low-viscosity medium).19,22 Notably, TICT conformers are also highly reactive, greatly reducing the photostability of fluorophores.23,24
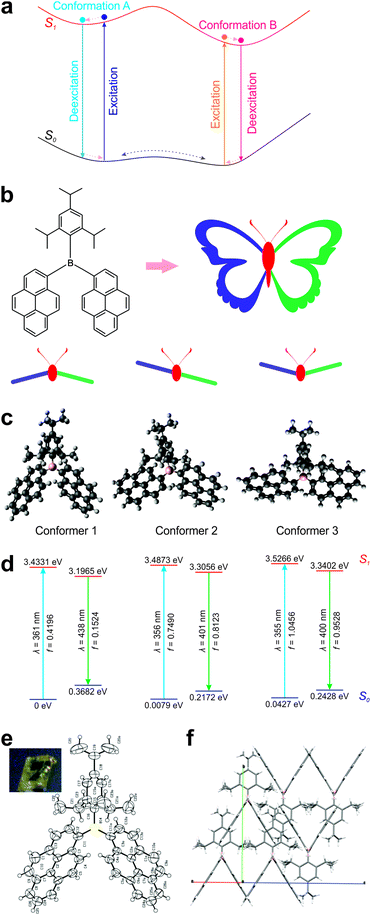
Given the drawbacks of conformer generation in the excited state, we turn our attention to conformational isomers in the ground state (Fig. 2a). The transition of conformational isomers in the ground state may have a large impact on their electronic structures and optical spectra, but does not directly affect the fluorescence strength of a fluorophore (as fluorescence process starts from the excited state). To this end, numerous conformers of various organic materials and their distinct spectral properties have been reported in the polymer and crystal states.25–34 A similar phenomenon in the solution phase has also been reported.35–38 However, these fluorophores in the solution phase have either extremely short wavelengths or poor brightness, limiting their practical applications.
In view of this technical challenge, we examined many fluorophores with the aid of chemical database. Most “classical” fluorophores, such as coumarin, rhodamine, BODIPY, and cyanine dyes, possess a rigid molecular structure and usually exhibit only one electronically equivalent conformer in the ground state.39 In contrast, many structurally flexible dyes are non-fluorescent or weakly fluorescent. However, we reason that “pseudo-rigid” fluorophores will lead to multiple conformational isomers in the ground state, while maintaining bright fluorescence. One of such “pseudo-rigid” dyes is DPTB, as firstly reported by Yang and co-workers in a seminal work (Scheme 1 and Fig. 2b).40
Computational analysis of ground-state conformers
The molecular structure of DPTB can be divided into three parts: a 2,4,6-triisopropylphenyl (TIPP) group and two pyrene (Py) units, all connected via a boron atom in the center (Fig. 2b). Intuitively, this molecule mimics the structure of a butterfly: the TIPP unit and the boron atom are like the head and body of a butterfly, and the two pyrene units resemble the two wings of a butterfly. By considering the relative positions of “wings” with respect to that of the “head–body”, we reason that there are at least three distinct conformations in this DPTB “butterfly”: down–down, up–down, and up–up conformations.Indeed, our conformational search using DFT calculations reproduces all three conformers of DPTB (Fig. 2c and Fig. S1, S2, ESI†). Our calculations show that Conformer 1 is the most stable conformational isomer, followed by Conformers 2 and 3 (Fig. 2d and Table 1). It is worth noting that Conformers 1 and 2 possess similar ground-state energies. Their energy differences amount to 0.0079–0.0139 eV, which are much smaller than the thermal energy at room temperature (0.0388 eV). These small energy differences indicate that both conformers are largely present in the solution of DPTB. Moreover, although the energy differences between Conformers 1 and 3 increase to 0.0427–0.0492 eV, these discrepancies are still comparable to the thermal energy at room temperature. We thus expect the presence of a small amount of Conformer 3 in the solution of DPTB as well.
| Conformers | In vacuo | Cyclohexane | EA | Ethanol | DMSO |
|---|---|---|---|---|---|
| Conformer 2 | 0.0079 | 0.0103 | 0.0127 | 0.0137 | 0.0139 |
| Conformer 3 | 0.0427 | 0.0439 | 0.0480 | 0.0490 | 0.0492 |
Interestingly, our theoretical calculations are corroborated by crystallographic experiments. The crystal structure of DPTB resembles the molecular structure of Conformer 1 (Fig. 2e, f; Fig. S3 and Table S1, ESI†). This is not surprising, as our theoretical calculations show that Conformer 1 is the most stable conformer.
More importantly, our computational results show that these conformers exhibit distinct electronic structures and optical spectra. Although the difference in their calculated UV-Vis absorption peaks is very small (∼5 nm), their theoretical emission peaks vary up to ∼40 nm (Table 2). Conformers 2 and 3 exhibit blue-shifted peak emission wavelengths with respect to Conformer 1. Consequently, the thermal equilibrium of these conformers is expected to enable single-fluorophore ratiometric imaging. Moreover, our oscillator strength data show that Conformers 2 and 3 are more emissive than Conformer 1. When higher temperature populates more Conformers 2 and 3, DPTB may even exhibit brighter emissions.
| Conformers | In vacuo | Cyclohexane | EA | Ethanol | DMSO |
|---|---|---|---|---|---|
| Absorption | |||||
| Conformer 1 | 361 (0.4196) | 368 (0.5331) | 367 (0.5299) | 367 (0.5207) | 367 (0.5314) |
| Conformer 2 | 356 (0.7490) | 363 (0.9755) | 363 (0.9518) | 363 (0.9460) | 363 (0.9680) |
| Conformer 3 | 355 (1.0456) | 363 (1.3721) | 362 (1.3400) | 362 (1.3327) | 363 (1.3646) |
| Emission | |||||
| Conformer 1 | 438 (0.1524) | 439 (0.2471) | 447 (0.3866) | 447 (0.3638) | 445 (0.3182) |
| Conformer 2 | 401 (0.8123) | 416 (1.0261) | 431 (1.2115) | 439 (1.2933) | 440 (1.3060) |
| Conformer 3 | 400 (0.9528) | 416 (1.1922) | 431 (1.3786) | 439 (1.4567) | 440 (1.4683) |
Finally, we have also considered solvent effects by performing quantum chemical calculations in four solvents (Table 1). It is worth noting that the energy difference between Conformer 1 and the other conformers increases as solvent polarity increases. Increasing temperature may thus play a more critical role in polar solvents than in vacuo and in non-polar solvents, to effectively facilitate conformational conversions.
Experimental validations of ground-state conformers
The presence of multiple conformational isomers is supported by fluorescence lifetime measurements (Table 3). In ethanol, emission data reveal two major lifetime components (τ1 ≈ 6.5 ns and τ2 ≈ 10.5 ns), which are assigned to Conformers 1 and 2. In the blue end of the fluorescence spectrum (430 nm), we also noticed the emergence of the third lifetime component but with a small contribution (τ3 ≈ 2.9 ns), which is likely linked to Conformer 3. Similar lifetime data are also found in other solvents (Table S2, ESI†).| λ em | τ 1 (ns) | RC (%) | τ 2 (ns) | RC (%) | χ 2 |
|---|---|---|---|---|---|
| 430 | 2.86 | 16.36 | 9.34 | 83.64 | 1.45 |
| 480 | 6.43 | 28.55 | 10.34 | 71.45 | 1.20 |
| 530 | 6.61 | 34.84 | 10.57 | 65.16 | 1.17 |
| 580 | 6.48 | 34.42 | 10.50 | 65.58 | 1.44 |
| 650 | 6.43 | 35.73 | 10.58 | 64.27 | 1.20 |
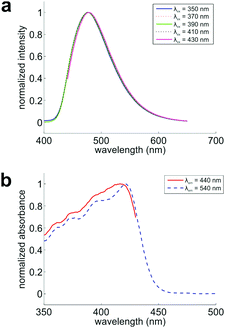
To verify if these conformers appear in the ground state, we collected the fluorescence spectra of DPTB in ethanol. By exciting this sample at various wavelengths, we expect to see a gradually shifting emission peak if multiple conformers co-exist and exhibit different UV-Vis absorption/emission spectra in the solution. Indeed, we observed a consistent shift of the emission peak from 476 to 478 nm (Fig. 3a).
Furthermore, we probed the fluorescence excitation spectra of this sample at emission wavelengths of 440 and 540 nm, respectively (Fig. 3b and Fig. S4, S5, ESI†). These two spectra maximize at 417 and 421 nm, respectively. Their distinct profiles demonstrate that the conformers indeed exist in the ground state of DPTB, in good agreement with our theoretical predictions (Table 2).
Given the presence of multiple conformers of DPTB, we also examined their NMR spectra (see the ESI†). Interestingly, NMR data of DPTB do not show a distinct spectrum of each conformer, but only their overall features. These data indicate that DPTB conformers can freely convert in the ground state and are all accessible at room temperatures.
Temperature dependence of absorption and emission spectra
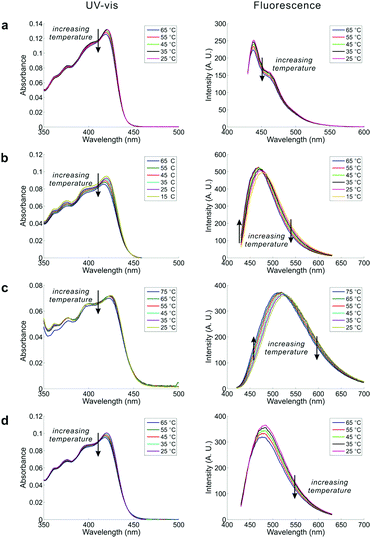
Inspired by the co-existence of multiple conformers, we studied the temperature dependence of the UV-Vis and emission spectra of DPTB in cyclohexane, EA, ethanol, and DMSO (Fig. 4). The selected solvents have different properties. The results collectively reflect the impact of solvent effects on the equilibrium between conformational isomers.In all tested solvents, the first absorption band of the UV-Vis absorption spectra extends from 350 to 470 nm, with a peak around 420 nm in DPTB. The associated solvatochromism is very weak, as evident from the minimal variation in peak absorption wavelengths of DPTB from cyclohexane to DMSO. This observation is in good agreement with the theoretical calculations. However, a close examination shows that there is a subtle blue shift in the UV-Vis absorption peaks. We also noticed that the peak absorbance of DPTB in all solvents experiences a slight drop as the temperature increases.
The blue shift with increasing temperature is much obvious in the emission spectra of DPTB. In general, long-wavelength emissions of DPTB exhibit a decrease in intensity as the temperature increases. In contrast, short-wavelength emissions of DPTB remain stable or even become enhanced at high temperatures. Consequently, these changes in the emission profiles of DPTB lead to a noticeable blue-shift (i.e., by ∼10 nm over a temperature increase of 50 °C in both EA and DMSO).
The blue shifts in fluorescence spectra of DPTB are consistent with our theoretical calculations. That is, Conformers 2 and 3, which exhibit a hypsochromic shift with respect to Conformer 1, populate as the temperature increases.
DPTB displays bright fluorescence in all tested solvents, with outstanding quantum yields (>40%, Table S3, ESI†). Interestingly, the peak emission intensities of DPTB demonstrate an atypical positive temperature coefficient in DMSO (0.06% per °C) and EA (0.11% per °C) (Fig. 4b, c and Table S4, ESI†). This unusual feature is not surprising, considering that the quantity of more emissive Conformers 2 and 3 increases, while that of less emissive Conformer 1 drops with increasing temperature.
In contrast, the peak emission intensities of DPTB in cyclohexane and ethanol consistently drop with temperature increase (Fig. 4a and d). On one hand, the thermal equilibrium of conformation isomers indeed favours more emissive Conformers 2 and 3 at high temperatures. On the other hand, rising temperature reduces the quantum yields of all conformers, owing to enhanced radiationless de-excitations. Perhaps in cyclohexane and ethanol, the decrease in quantum yield plays a more significant role. Consequently, DPTB displays a negative temperature coefficient. These results show that solvent effects have an important impact on the overall temperature-dependence of DPTB emissions.
Fluorescent thermometer applications
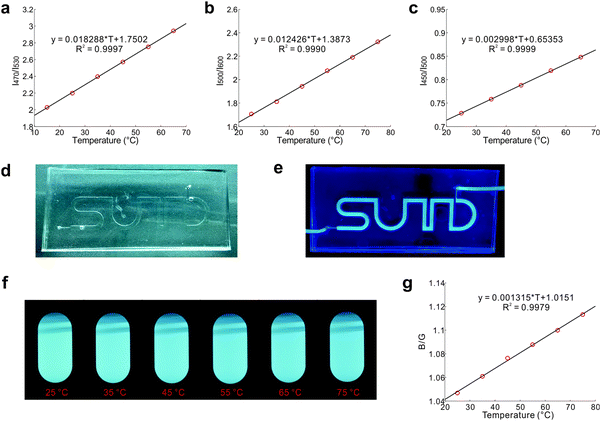
Thermal equilibrium of conformational isomers and their distinct emission profiles permit the deployment of DPTB as a fluorescent thermometer (Fig. 5). DPTB allows ratiometric temperature measurements based on a single type of fluorophore. As the thermal equilibrium of these ground-state conformers is governed by the Boltzmann distribution and not affected by the dye concentration, their ratiometric readings are inherently independent of photobleaching. DPTB based fluorescent thermometers are thus highly reliable, and particularly suitable for long-lasting applications.Indeed, our experiments show that the temperature calibration curves of DPTB in various solvents exhibit excellent statistical goodness-of-fit (Fig. 5a–c).
To demonstrate the usefulness of DPTB in temperature sensing, we have injected its ethanol solution into a small channel embedded in a PDMS chip (Fig. 5d and e). This flexible device is semi-transparent under ambient light, and highly emissive under UV radiation (Table S3, ESI†). This device in combination with a portable spectrometer and the calibration curve (Fig. 5c) allows convenient temperature measurements.
To further demonstrate the simplicity of DPTB as a thermometer, we use a standard digital camera to capture raw images of this dye in DMSO under UV excitation at different temperatures (Fig. 5f). While the colour and intensity changes are relatively subtle to the naked eye, the ratio of intensities in the blue and green channels of these raw images affords useful information about the temperatures (Fig. 5g).
This fluorescent system also demonstrates excellent reversibility and reliability. During 10 heating/cooling cycles between 25 °C and 75 °C, the measured fluorescence intensities are extremely consistent (Fig. S6, ESI†). We also placed this system under continuous UV irradiation for 24 hours at 25 °C. The corresponding fluorescence intensities remained the same throughout the course.
It is worth highlighting that not only DPTB, but also many other pseudo-rigid fluorophores are expected to possess multiple accessible conformers in the ground state.41–43 These fluorophores could allow photobleaching-independent ratiometric temperature measurements. And their availability demonstrates the generality of our design strategy to realize single-fluorophore ratiometric thermometers.
Finally, thermometry based on these fluorophores is best suited in solvents, when temperature is the only factor affecting fluorophore conformations. In the presence of other interference factors (such as biomolecules), these fluorophores can be capped inside polymer nanoparticles to serve as dedicated temperature sensors.8,41 Note that conformational changes of fluorophores are still feasible in polymers with large free volume.
Conclusion
We have demonstrated a strategy to achieve a single-fluorophore ratiometric thermometer, based on ground-state conformers of DPTB. These conformers are present at room temperature and exhibit different emission spectra. Consequently, thermal equilibrium of these conformers enables ratiometric temperature sensing with simple design and high reliability. Such a single-fluorophore ratiometric thermometer overcomes the reliability issue related to varied photobleaching rates in dual-fluorophore ratiometric thermometers. Moreover, unlike conformational changes in the excited state (that generally quench fluorescence and afford weak fluorescence), these ground state conformational isomers emit bright signals. Finally, as more emissive conformers become populous at high temperatures, DPTB even exhibits an unusual positive temperature coefficient in ethyl acetate and DMSO. We expect that employing ground state conformational isomers will open a new door for developing highly reliable ratiometric imaging systems.Computational and experimental details
DFT calculations were performed using Gaussian 09.44 Hybrid functional wB97XD and the 6-31G(d,p) basis set were used for all calculations. The geometry optimizations of various conformational isomers of DPTB in both their ground and the first excited singlet states (S0 and S1) were performed in vacuo, and in cyclohexane, EA, ethanol, and DMSO. Frequency checks in the ground state were conducted after each geometry optimization to ensure that minima on the potential energy surfaces (PES) were found. Following this, TD-DFT calculations were carried out on the optimized molecular structures to determine their peak absorption/emission wavelengths and oscillator strength (using linear response solvation). Solvent effects, when applicable, were treated using the C-PCM model.DPTB was a gift from Yang Laboratory, and its synthesis procedures were reported previously (Fig. S7 and S8, ESI†).40
A single crystal of DPTB suitable for X-ray structural analysis was obtained by slow evaporation from a chloroform/n-hexane solution at room temperature. Single crystal X-ray diffraction intensity data were collected on a Xcalibur Gemini ultra-diffractometer using the ω-scan mode with graphite-monochromator Mo Kα radiation (0.71073 Å). The crystal was kept at 293(2) K during data collection. Using Olex2,45 the structure was solved with the Superflip program46 and refined with the SHELXL package.47
1H-NMR and 13C-NMR spectra were recorded on a Bruker 400 spectrometer, using TMS as an internal standard. Chemical shifts were given in ppm and coupling constants (J) in Hz.
The fluorescence lifetime of DPTB in various solvents was measured using a Fluoromax-4 spectro-fluorometer equipped with a NanoLED-370 pulsed diode (excitation wavelength, 368 nm) and a DeltaHub TCSPC controller.
Fluorescence spectra were collected using a Cary Eclipse spectrometer equipped with a Peltier temperature controller. Emission spectra of DPTB in cyclohexane, EA, ethanol, and DMSO were measured at different temperatures ranging from 15 °C to 75 °C. Readings were taken at a 30 min interval to ensure that samples had reached the desired temperatures before each measurement. A Cary 60 spectroscope was used to collect the UV-Vis absorption spectra of all samples in the same temperature range as that of fluorescence spectra.
The quantum yields of DPTB in cyclohexane, EA, ethanol, and DMSO were determined via the relative determination method, with Coumarin 153 as a reference compound.48
A minichannel with alphabets “SUTD” was designed using AutoCAD® 2016. The width and height of the channel were 1.7 mm x 1.7 mm. The CAD designed geometry was then printed using the Stereolithography (SLA) based Form 2™ (Formlabs, USA) 3D printer using Clear™ resin with a layer thickness of 0.025 mm. The 3D printed mold was post-processed by isopropanol wash for 10 min followed by UV curing for 1 h. For replica molding of the post processed mold, a mixture of poly(dimethylsiloxane) (PDMS) prepolymer (Sylgard 184 Silicone Elastomer kit, Dow Corning, USA) and its curing agent in the ratio of 10![[thin space (1/6-em)]](https://www.rsc.org/images/entities/char_2009.gif) :
:![[thin space (1/6-em)]](https://www.rsc.org/images/entities/char_2009.gif) 1 was prepared. The PDMS mixture was then degassed under vacuum in a desiccator for removal of entrapped bubbles. The degassed PDMS was then cast over the mold and oven baked at 60 °C for 24 h. The heat cured PDMS was then removed from the mold with the channels being replicated, and provisions for flow inlet and outlet were made using a 1 mm hole puncher. The fabricated PDMS replica mold was then bonded to thin slabs of PDMS to form sealed channels via plasma bonding.
1 was prepared. The PDMS mixture was then degassed under vacuum in a desiccator for removal of entrapped bubbles. The degassed PDMS was then cast over the mold and oven baked at 60 °C for 24 h. The heat cured PDMS was then removed from the mold with the channels being replicated, and provisions for flow inlet and outlet were made using a 1 mm hole puncher. The fabricated PDMS replica mold was then bonded to thin slabs of PDMS to form sealed channels via plasma bonding.
Conflicts of interest
There are no conflicts of interest to declare.Acknowledgements
The authors thank Professor Guoqiang Yang from the Institute of Chemistry, Chinese Academy of Sciences, for helpful discussions. This work is supported by Singapore University of Technology and Design (T1SRCI17126), Singapore-MIT Alliance for Research and Technology, the National Natural Science Foundation of China (21422606 and 21402191) and Dalian Cultivation Fund for Distinguished Young Scholars (2014J11JH130 and 2015J12JH205).References
- X.-D. Wang, O. S. Wolfbeis and R. J. Meier, Chem. Soc. Rev., 2013, 42, 7834–7869 RSC
.
- Z. Yang, J. Cao, Y. He, J. H. Yang, T. Kim, X. Peng and J. S. Kim, Chem. Soc. Rev., 2014, 43, 4563–4601 RSC
.
- J. Sakakibara and R. J. Adrian, Exp. Fluids, 1999, 26, 7–15 CrossRef CAS
.
- D. Ross, M. Gaitan and L. E. Locascio, Anal. Chem., 2001, 73, 4117–4123 CrossRef CAS PubMed
.
- R. Fu, B. Xu and D. Li, Int. J. Therm. Sci., 2006, 45, 841–847 CrossRef
.
- A. J. Bur, M. G. Vangel and S. Roth, Appl. Spectrosc., 2002, 56, 174–181 CrossRef CAS
.
- A. Nakano, J. Luo and A. Ros, Anal. Chem., 2014, 86, 6516–6524 CrossRef CAS PubMed
.
- K. Okabe, N. Inada, C. Gota, Y. Harada, T. Funatsu and S. Uchiyama, Nat. Commun., 2012, 3, 705 CrossRef PubMed
.
- S. Arai, S.-C. Lee, D. Zhai, M. Suzuki and Y. T. Chang, Sci. Rep., 2014, 4, 6701 CrossRef CAS PubMed
.
- S. Arai, M. Suzuki, S.-J. Park, J. S. Yoo, L. Wang, N.-Y. Kang, H.-H. Ha and Y.-T. Chang, Chem. Commun., 2015, 51, 8044–8047 RSC
.
- J. Jenkins, S. M. Borisov, D. B. Papkovsky and R. I. Dmitriev, Anal. Chem., 2016, 88, 10566–10572 CrossRef CAS PubMed
.
- S. Collins, G. Baxter, S. Wade, T. Sun, K. Grattan, Z. Zhang and A. Palmer, J. Appl. Phys., 1998, 84, 4649–4654 CrossRef CAS
.
- S. Ebert, K. Travis, B. Lincoln and J. Guck, Opt. Express, 2007, 15, 15493–15499 CrossRef CAS PubMed
.
- V. Natrajan and K. Christensen, Meas. Sci. Technol., 2008, 20, 015401 CrossRef
.
- P. Löw, B. Kim, N. Takama and C. Bergaud, Small, 2008, 4, 908–914 CrossRef PubMed
.
- X. Liu, D. Mao, J. M. Cole and Z. Xu, Chem. Commun., 2014, 50, 9329–9332 RSC
.
- Z. R. Grabowski, K. Rotkiewicz and W. Rettig, Chem. Rev., 2003, 103, 3899–4032 CrossRef PubMed
.
- Y. Hong, J. W. Y. Lam and B. Z. Tang, Chem. Soc. Rev., 2011, 40, 5361–5388 RSC
.
- J. Mei, N. L. Leung, R. T. Kwok, J. W. Lam and B. Z. Tang, Chem. Rev., 2015, 115, 11718–11940 CrossRef CAS PubMed
.
- X. Liu, Z. Xu and J. M. Cole, J. Phys. Chem. C, 2013, 117, 16584–16595 CAS
.
- C. Yuan, S. Saito, C. Camacho, S. Irle, I. Hisaki and S. Yamaguchi, J. Am. Chem. Soc., 2013, 135, 8842–8845 CrossRef CAS PubMed
.
- D. Su, C. L. Teoh, L. Wang, X. Liu and Y.-T. Chang, Chem. Soc. Rev., 2017, 46, 4833–4844 RSC
.
- X. Liu, Q. Qiao, W. Tian, W. Liu, J. Chen, M. J. Lang and Z. Xu, J. Am. Chem. Soc., 2016, 138, 6960–6963 CrossRef CAS PubMed
.
- J. B. Grimm, B. P. English, J. Chen, J. P. Slaughter, Z. Zhang, A. Revyakin, R. Patel, J. J. Macklin, D. Normanno, R. H. Singer, T. Lionnet and L. D. Lavis, Nat. Methods, 2015, 12, 244–250 CrossRef CAS PubMed
.
- C.-J. Ou, X.-H. Ding, Y.-X. Li, C. Zhu, M.-N. Yu, L.-H. Xie, J.-Y. Lin, C.-X. Xu and W. Huang, J. Phys. Chem. C, 2017, 121, 14803–14810 CAS
.
- J. Kim and T. M. Swager, Nature, 2001, 411, 1030–1034 CrossRef CAS PubMed
.
- H. Zhang, Z. Zhang, J. Zhang, K. Ye, H. Gao and Y. Wang, CrystEngComm, 2007, 9, 951–958 RSC
.
- Z. Chi, X. Zhang, B. Xu, X. Zhou, C. Ma, Y. Zhang, S. Liu and J. Xu, Chem. Soc. Rev., 2012, 41, 3878–3896 RSC
.
- Q. Qi, J. Zhang, B. Xu, B. Li, S. X.-A. Zhang and W. Tian, J. Phys. Chem. C, 2013, 117, 24997–25003 CAS
.
- W. Z. Yuan, Y. Tan, Y. Gong, P. Lu, J. W. Y. Lam, X. Y. Shen, C. Feng, H. H. Y. Sung, Y. Lu, I. D. Williams, J. Z. Sun, Y. Zhang and B. Z. Tang, Adv. Mater., 2013, 25, 2837–2843 CrossRef CAS PubMed
.
- K. Wang, H. Zhang, S. Chen, G. Yang, J. Zhang, W. Tian, Z. Su and Y. Wang, Adv. Mater., 2014, 26, 6168–6173 CrossRef CAS PubMed
.
- Y. Zhang, Q. Song, K. Wang, W. Mao, F. Cao, J. Sun, L. Zhan, Y. Lv, Y. Ma, B. Zou and C. Zhang, J. Mater. Chem. C, 2015, 3, 3049–3054 RSC
.
- Y. Xu, K. Wang, Y. Zhang, Z. Xie, B. Zou and Y. Ma, J. Mater. Chem. C, 2016, 4, 1257–1262 RSC
.
- Y. Xu, Z. Xie, H. Zhang, F. Shen and Y. Ma, CrystEngComm, 2016, 18, 6824–6829 RSC
.
- A. G. Szabo and D. M. Rayner, J. Am. Chem. Soc., 1980, 102, 554–563 CrossRef CAS
.
- J. Saltiel, D. Sears Jr, J. Choi, Y. Sun and D. Eaker, J. Phys. Chem., 1994, 98, 35–46 CrossRef CAS
.
- A. Szemik-Hojniak, J. M. Zwier, W. J. Buma, R. Bursi and J. H. van der Waals, J. Am. Chem. Soc., 1998, 120, 4840–4844 CrossRef CAS
.
- J. Saltiel, D. F. Sears, Y. P. Sun and J. O. Choi, J. Am. Chem. Soc., 1992, 114, 3607–3612 CrossRef CAS
.
- L. D. Lavis and R. T. Raines, ACS Chem. Biol., 2008, 3, 142–155 CrossRef CAS PubMed
.
- J. Feng, K. Tian, D. Hu, S. Wang, S. Li, Y. Zeng, Y. Li and G. Yang, Angew. Chem., Int. Ed., 2011, 50, 8072–8076 CrossRef CAS PubMed
.
- J. Feng, L. Xiong, S. Wang, S. Li, Y. Li and G. Yang, Adv. Funct. Mater., 2013, 23, 340–345 CrossRef CAS
.
- X. Liu, S. Li, J. Feng, Y. Li and G. Yang, Chem. Commun., 2014, 50, 2778–2780 RSC
.
- Q. Fang, J. Li, S. Li, R. Duan, S. Wang, Y. Yi, X. Guo, Y. Qian, W. Huang and G. Yang, Chem. Commun., 2017, 53, 5702–5705 RSC
.
-
M. Frisch, G. Trucks, H. B. Schlegel, G. Scuseria, M. Robb, J. Cheeseman, G. Scalmani, V. Barone, B. Mennucci and G. Petersson, et al., Gaussian 09, Gaussian Inc., Wallingford, CT, 2009 Search PubMed
.
- O. V. Dolomanov, L. J. Bourhis, R. J. Gildea, J. A. Howard and H. Puschmann, J. Appl. Crystallogr., 2009, 42, 339–341 CrossRef CAS
.
- L. Palatinus and G. Chapuis, J. Appl. Crystallogr., 2007, 40, 786–790 CrossRef CAS
.
- G. M. Sheldrick, Acta Crystallogr., Sect. C: Struct. Chem., 2015, 71, 3–8 CrossRef PubMed
.
- C. Würth, M. Grabolle, J. Pauli, M. Spieles and U. Resch-Genger, Nat. Protoc., 2013, 8, 1535–1550 CrossRef PubMed
.
Footnote |
| † Electronic supplementary information (ESI) available. CCDC 1564212. For ESI and crystallographic data in CIF or other electronic format see DOI: 10.1039/c7qm00345e |
| This journal is © the Partner Organisations 2017 |

