 Open Access Article
Creative Commons Attribution 3.0 Unported Licence
Effect of exercise on the plasma vesicular proteome: a methodological study comparing acoustic trapping and centrifugation†
Paulina
Bryl-Górecka‡
 *a,
Ramasri
Sathanoori‡
a,
Mariam
Al-Mashat
b,
Björn
Olde
a,
Jonas
Jögi
b,
Mikael
Evander
c,
Thomas
Laurell
c and
David
Erlinge
a
aDepartment of Cardiology, Clinical Sciences, Lund University, Box 118, 221 00 Lund, Sweden. E-mail: paulina.bryl-gorecka@med.lu.se
bDepartment of Clinical Physiology, Clinical Sciences, Lund University, Box 118, 221 00 Lund, Sweden
cDepartment of Biomedical Engineering, Lund University, Box 118, 221 00 Lund, Sweden
First published on 24th August 2018
Abstract
Extracellular vesicles (EVs) are a heterogeneous group of actively released vesicles originating from a wide range of cell types. Characterization of these EVs and their proteomes in the human plasma provides a novel approach in clinical diagnostics, as they reflect physiological and pathological states. However, EV isolation is technically challenging with the current methods having several disadvantages, requiring large sample volumes, and resulting in loss of sample and EV integrity. Here, we use an alternative, non-contact method based on a microscale acoustic standing wave technology. Improved coupling of the acoustic resonator increased the EV recovery from 30% in earlier reports to 80%, also displaying long term stability between experiment days. We report a pilot study, with 20 subjects who underwent physical exercise. Plasma samples were obtained before and 1 h after the workout. Acoustic trapping was compared to a standard high-speed centrifugation protocol, and the method was validated by flow cytometry (FCM). To monitor the device stability, the pooled frozen plasma from volunteers was used as an internal control. A key finding from the FCM analysis was a decrease in CD62E+ (E-selectin) EVs 1 h after exercise that was consistent for both methods. Furthermore, we report the first data that analyse differential EV protein expression before and after physical exercise. Olink-based proteomic analysis showed 54 significantly changed proteins in the EV fraction in response to physical exercise, whereas the EV-free plasma proteome only displayed four differentially regulated proteins, thus underlining an important role of these vesicles in cellular communication, and their potential as plasma derived biomarkers. We conclude that acoustic trapping offers a fast and efficient method comparable with high-speed centrifugation protocols. Further, it has the advantage of using smaller sample volumes (12.5 μL) and rapid contact-free separation with higher yield, and can thus pave the way for future clinical EV-based diagnostics.
Introduction
Extracellular vesicles (EVs) are small, membrane-derived vesicles of cellular origin.1 EVs larger than 1 μm are generally thought to be apoptotic bodies (AB), originating from cell blebbing during apoptosis, while vesicles between 100 and 1000 nm are referred to as microvesicles (MVs) or microparticles that are produced from the plasma membrane by ‘shedding’ or ‘budding’. Exosomes comprise the smallest class of vesicles, ranging from 50 to 120 nm that originate from multivesicular bodies, and are secreted through exocytosis. EVs carry biologically active molecules on their surfaces (e.g. receptors, phospholipids), as well as cargo containing a variety of molecules.1,2 Since MVs are derived from the plasma membrane, they also carry surface markers from the ‘parent’ cell. The influence of EVs on the recipient cells is a subject of extensive studies. For instance, EVs from serum-starved rat renal microvascular endothelial cells (ECs) impaired endothelial function in vitro by increasing superoxide production and inhibition of the relaxation response to acetylcholine.3 In addition, Jy et al. showed that endothelial MVs (EMVs) generated from TNF-alpha activated ECs induced platelet aggregation in a vWF and CD42a (Glycoprotein IX)-dependent manner.4Human plasma contains different types of MVs,5 most of which originate from blood cells, with the platelet MVs (PMVs) constituting 70–90% of all plasma MVs.2 Other MVs are derived from ageing erythrocytes,6 activated leukocytes7 or ECs.8 Plasma MVs are known to be linked to various pathological states including atherosclerosis9 and hypertension.10 While the levels of EMVs increase during myocardial infarction (MI),11 coronary artery disease12 and diabetes,13 another study showed that lipid lowering therapies influence the levels of EMVs due to the interaction with ECs.14
Physical exercise promotes several physiological and biochemical changes in the human body, such as increased heart rate, blood pressure and lactate level.15,16 Regular exercise is linked to physical adaptation and is considered beneficial due to energy expenditure. Further, it contributes to the protective influence on endothelial function and inflammatory processes.15–17 Several groups have investigated the effect of exercise on EV numbers, but the exercise procedures, subject characteristics and EV isolation methods vary between studies, thus making the comparisons unclear.18–21
High-speed centrifugation is a widely used technique for MV isolation.22–24 However, this method requires large sample volumes and is laborious, which makes MV analysis impractical in a clinical and diagnostic context. Further, it also contributes to loss of sample and MV integrity, therefore necessitating more efficient isolation methods. Acoustic trapping is a novel, automated, and non-contact method for EV isolation that is based on microscale acoustic standing wave technology. The method has been previously described by our group (Evander et al.25 and Rezeli et al.26) for vesicle analyses in patient plasma samples. The method comprises the generation of a local acoustic standing wave that retains particles in a non-contact manner where 12 μm polystyrene beads are used as ‘seed particles’ to trap EVs from plasma.
The aim of this study was to compare the acoustic trapping method with standard centrifugation protocols and demonstrate the power of using acoustic trapping to isolate MVs for clincial biomolecular analysis. We evaluated both methods based on detected changes in the CD62E+ MV levels and protein expression changes after exercise. The study is based on a bicycle exercise test with 20 participants. EVs were isolated both by acoustic trapping and the standard high-speed centrifugation protocols. The multiplex proximity extension assay (PEA) from Olink Proteomics was used to characterize the protein content of the isolated EVs, while the number of MVs bearing the activated endothelial marker was measured using flow cytometry (FCM). We are aware of the fact that the studied population of isolated vesicles is heterogeneous containing both MVs and exosomes, and this is also supported by our results. For practical reasons we will refer to the analysed vesicles as EVs if nothing else is stated.
Results and discussion
Reproducibility and efficiency of acoustic trapping
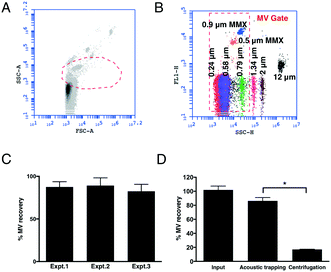
To measure the EVs corresponding to the MV size, we first established a FCM ‘MV gate’ (Fig. 1A and B) using calibrated size-standard beads in the size range of 0.2–1.0 μm. Since the majority of MVs are of platelet origin (platelet microvesicles – PMVs) we used CD42a+ PMVs to calculate the trapping recovery. The higher concentration of PMVs in comparison with endothelial microvesicles (EMVs) gives a more reliable measurement of the efficiency of the method. The results show that acoustic trapping yields a constant and high recovery of >80% throughout the experiments (Fig. 1C) for events within the MV gate, with 5 times higher levels of MVs compared to the standard centrifugation protocol commonly used for flow cytometry analysis (Fig. 1D). This indicates that the loss of MVs is substantially lower (<15%) by acoustic trapping compared to centrifugation (∼80%; Fig. 1D), relative to previous reports using centrifugation.23 Our earlier study of acoustic MV trapping displayed recoveries of ≈15% and ≈30% for 1![[thin space (1/6-em)]](https://www.rsc.org/images/entities/char_2009.gif) :
:![[thin space (1/6-em)]](https://www.rsc.org/images/entities/char_2009.gif) 2 diluted plasma sample volumes of 10 and 50 μL (5 and 25 μL undiluted plasma), respectively.25 The herein reported MV recoveries at 1
2 diluted plasma sample volumes of 10 and 50 μL (5 and 25 μL undiluted plasma), respectively.25 The herein reported MV recoveries at 1![[thin space (1/6-em)]](https://www.rsc.org/images/entities/char_2009.gif) :
:![[thin space (1/6-em)]](https://www.rsc.org/images/entities/char_2009.gif) 4 diluted plasma sample volumes of 50 μL (12.5 μL undiluted plasma) yielded ≈85% MV recovery throughout the entire study. Critical to this improvement was a more reproducible mounting of the glass capillary to the piezo electric transducer giving an equal coupling of acoustic energy over the experimental series. The improved acoustic EV trapping performance enables more extensive biomarker investigations in biobank cohorts, where EV isolation reproducibility is a critical factor.
4 diluted plasma sample volumes of 50 μL (12.5 μL undiluted plasma) yielded ≈85% MV recovery throughout the entire study. Critical to this improvement was a more reproducible mounting of the glass capillary to the piezo electric transducer giving an equal coupling of acoustic energy over the experimental series. The improved acoustic EV trapping performance enables more extensive biomarker investigations in biobank cohorts, where EV isolation reproducibility is a critical factor.
Levels of CD62E+ MVs before and 1 h after exercise
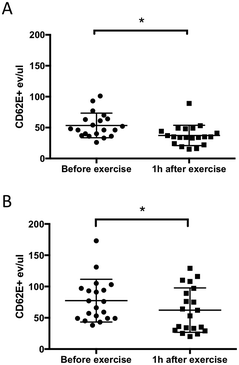
Several cardiovascular disorders and pathological events including hypoxia, coagulation, and inflammation activate the endothelium and induce the release of EMVs.27 One of the well-known surface markers of endothelial activation is CD62E. In this study, we investigated the effect of exercise on plasma MVs including CD62E expression and compared MV isolation by acoustic trapping and high-speed centrifugation methods. The results clearly showed that 10 min of exercise on a stationary bicycle was sufficient to generate a statistically significant decrease (30% for the centrifugation method and 20% for acoustic trapping) in the number of CD62E+ MVs (Fig. 2). The more scattered nature of the data observed for acoustic trapping is explained by the fact that the amount of starting material for acoustic trapping was only 12.5 μL of the undiluted plasma, whereas the centrifugation protocol started out with 200 μL of undiluted plasma. Hence, any losses in the sample processing prior to the FACS analysis will induce a larger relative error for the trapped samples as compared to the centrifuged samples.When comparing MV recoveries in Fig. 1D (PMVs) and Fig. 2 (EMVs) it becomes evident that the yields are different for platelet and CD62E+ MVs. This may be explained by the procoagulant nature of PMVs which, in combination with centrifugation for FCM analysis, results in a significantly decreased recovery. EMVs on the other hand are not procoagulant and thus do not form aggregates that are lost during the centrifugation step, which is why the CD62E+ EMV counts in Fig. 2A and B are similar.
Several groups have previously investigated the effect of exercise on the plasma MV release based on the FCM analysis.18–20 However, the exercise protocols, as well as the plasma sampling and MV markers differ in published studies. For instance, a recent study, published by Babbitt et al.,18 reports a decrease in CD62E+ EMVs after six months of aerobic exercise training (AEXT) in African Americans. The authors hypothesized that this type of exercise has a protective effect on the endothelium, which is reflected in a decreased concentration of CD62E+ MVs. Although we investigated more rapid changes in the EMV levels (baseline and 1 h after exercise), we also observed a statistically significant decrease in the CD62E+ MVs consistent with Babbitt's study (baseline and six months of AEXT).
Characterization of isolated EVs by transmission electron microscopy (TEM) and nanoparticle tracking analysis (NTA)
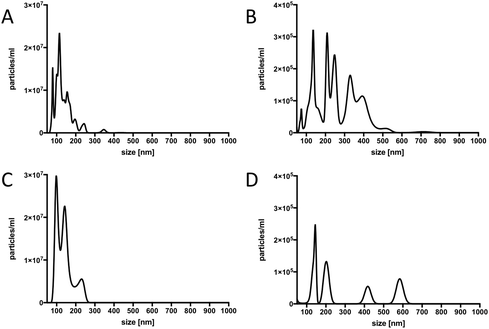
In order to confirm that our material contained true vesicles with CD62E markers present on their surface, we performed TEM and NTA. The TEM analysis showed that the plasma samples contained intact vesicles of different sizes (Fig. 3A), and Immunogold staining detected the CD62E markers, confirming its presence on the EVs in our sample set (Fig. 3B). NTA revealed that both isolation methods displayed a similar size distribution of EVs with a majority of CD62E+ vesicles in the MV diameter range (Fig. 4). In addition, fluorescence measurements by Nanosight showed that the CD62E+ EVs isolated by the standard centrifugation protocol have a lower concentration as compared to those by acoustic trapping (Fig. 4B and D), which is consistent with the FCM results. A concentration peak near 600 nm for the centrifugation protocol may indicate vesicle aggregation, which could occur due to the applied high speed centrifugation (Fig. 4D). The NTA showed higher numbers of EVs and broad particle size distributions for acoustic trapping, which may indicate that this technique yields heterogeneous EV distributions as compared to high-speed centrifugation, which corroborates the FCM analysis results. These observations are likely due to the different centrifugal and acoustic forces acting on the EVs during centrifugation and acoustic trapping, respectively. Both the NTA and TEM vesicle analyses demonstrated that EVs isolated from human plasma are in the 50 to 800 nm range corresponding to both MVs and exosomes. These results are in agreement with previous reports on the size distribution of human plasma EVs.28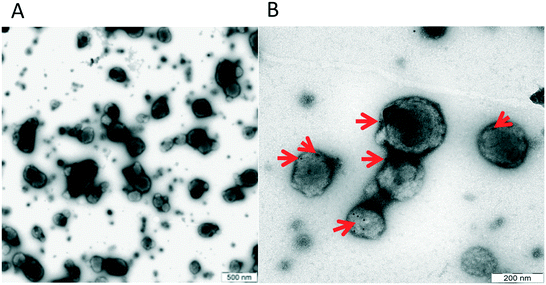 | ||
| Fig. 3 A: Size distribution of EVs, B: TEM image showing the presence of the CD62E antigen on the surface of plasma EVs. | ||
Effect of exercise on the plasma proteome
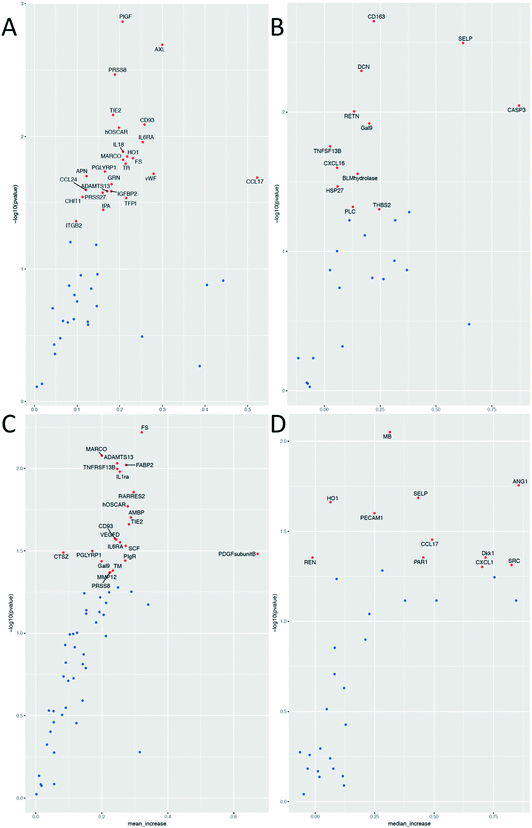
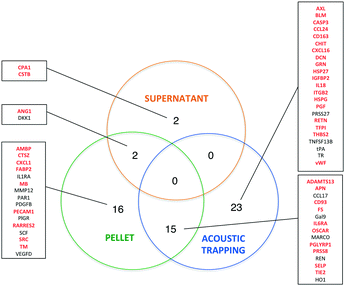
While the effects of exercise on the human plasma proteome have been described in several studies,29–32 the effect of exercise on the plasma EV protein composition has not yet been investigated. In fact, different approaches are used to analyze EV contents. Researchers have analyzed EVs derived from e.g. in vitro cultured and stimulated ECs,33,34 isolated platelets,35–37 erythrocytes6 or cell-free plasma.38,39 The most widely applied proteomic approaches are different types of MS, but these methods identify mainly high-abundant proteins, and may not be sensitive enough to detect low-abundant molecules of potential biomarkers. To address this problem and to improve the sensitivity of protein detection, we used the multiplex proximity extension assay (PEA) from Olink Proteomics that is based on PCR and specific antibodies conjugated with DNA-oligonucleotides.To detect changes in the protein levels, the EVs isolated from the samples before and 1 h after exercise were compared using the Olink Proteomics panels CVD II and III (ESI† Table S1 and S2). We analyzed the EVs isolated by acoustic trapping and high-speed centrifugation (both the pellet and supernatant fractions). The results show that 58 different proteins are significantly altered of which 56 are present in the EVs isolated both by acoustic trapping and the centrifugation protocol (Fig. 5). Statistical analysis reveals that while acoustic trapping detected significant changes in the levels of 38 proteins, the changes in 15 proteins (40%) were in common with those of the pelleted samples (Fig. 6). When using a 10% confidence level, there were changes in 44 proteins that were significant in the trapping method, while 27 of them matched the centrifugation method (61% overlap, data not shown). In the pelleted samples, the levels of 33 proteins are altered, where 16 are exclusively detected in this fraction, while 2 of them are common to the supernatant. The analysis of protein changes in the supernatant before and 1 h after exercise show 4 proteins to be differentially regulated.
We then used Vesiclepedia40 to identify proteins previously reported in EVs. Searching this database indicates that EV isolation by acoustic trapping resulted in the detection of differences in the levels of 29 known vesicular proteins, where 20 of them are present in the pelleted samples (Fig. 6). While there are only four differentially regulated proteins in the MV-free fraction (supernatant), as many as 54 proteins are significantly altered in the combined vesicular fraction, consisting of both pelleted and trapped samples. These results suggest that a majority of the protein expression changes occurring in the plasma after exercise are reflected in the vesicular fraction (trapped and pelleted samples). Our findings confirm that the results obtained by the acoustic trapping method are comparable with those by the high-speed centrifugation protocol for EV isolation, but the acoustic trapping method was more sensitive in detecting changes.
Physical exercise is a potent stimulus that induces several major changes in the plasma proteome, where the specific change depends on the type of exercise (high- vs. low-volume),30 as well as on the physical condition of the subjects.41 For the exercise protocol applied in this study, consisting of 10 min of bicycle exercise, we were able to detect changes in several different protein classes, where the majority was identified mainly in the vesicular fraction. Most of the proteins altered are chemokines and interleukins (IL) associated with inflammatory response (e.g. CCL17, CCL24, CXCL1, CXCL16, IL1RA, IL18, and macrophage receptor with collagenous structure (MARCO)), as well as proteins associated with angiogenesis (e.g. ANG1 and TIE2) and coagulation (PAR1, SELP, SRC, and vWF) (Fig. 7A).
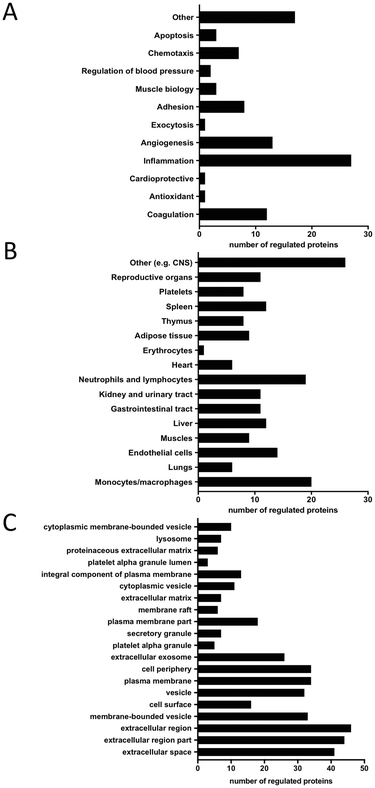 | ||
| Fig. 7 Characteristics of significantly altered proteins 1 h after exercise. A: Biological function, B: cellular origin, C: cellular component analysis. | ||
One of the proteins highly regulated in response to exercise is MARCO, which is a scavenger receptor present in macrophages. It binds Gram-positive and negative bacteria, acetylated LDL (ref. 42) and is believed to enhance cellular adhesion.43 Su et al.44 demonstrated that MARCO expression is upregulated after severe exercise in mice bronchoalveolar macrophages and thus increases phagocytosis of unopsonized particles. Hirano et al.45 showed that MARCO is processed by the endocytosis–autophagy pathway, but its presence in EVs remains unidentified. It is known that exercise induces hyperventilation and respiratory alkalosis46,47 which in turn cause alkaline stress and autophagy.48 We hypothesize that autophagy-induced endocytosis of MARCO could be the first step of its vesicular release thus explaining its vesicular increase after exercise in this study.
Our results also show an increase in the levels of CXCL-1,49 CXCL-16 (ref. 50) and IL1RA (ref. 49) which are all known to be altered after exercise. These findings are consistent with the knowledge that exercise stimulates immune responses.51,52 CXCL-16 is a known chemotactic factor for endothelial progenitor cells53 that takes part in muscle regeneration by attracting neutrophils.50 We also found that the angiogenesis-related protein, angiopoietin-1 (ANG1), was upregulated 1 h after exercise, along with its receptor TIE2. These two proteins are known to form a proangiogenic axis and their mRNA levels increase after exercise in human skeletal muscles.54 Ruan and Kazlauskas55 showed that lactate stimulates ANG1 production, which in turn activates TIE2 and Axl receptors, thus inducing angiogenesis. This model of action could partly explain exercise-induced new vessel formation. Two proteins, myoglobin (MB) and follistatin (FS), involved in muscle tissue regulation were increased, which is in line with a previous study by Peake et al.56 and Hansen et al.57 According to Amthor et al.,58 FS serves as a myostatin inhibitor, thus antagonizing myogenesis inhibition. Furthermore, Heme oxygenase-1 (HO1) and heat shock protein 27 (HSP27) known for their antioxidant and stress response functions, were also significantly altered. In fact, previous reports indicate their increase after exercise both in rat aortas59 and in human skeletal muscles.60 In agreement with previous reports, our results show that the von Willebrand Factor (vWF),61,62 ADAMTS13 (ref. 61) and P-selectin (SELP)62,63 are all significantly upregulated after exercise. It was previously shown that the state of physical fitness of the subjects strongly influences the magnitude of the increase in vWF after additional exercise.61 The subjects in our study cohort were of different physical fitness and this factor could contribute to the upregulation of vWF after exercise. van Loon et al.61 hypothesized that increased vWF levels may be explained by the impact of shear stress on ECs, as well as by adrenergic stimulus. This in turn may lead to platelet hyper-reactivity and subsequently increased fibrinolytic activity, resulting in a hypo-coagulable state that can be sustained in the resting state. This could serve as one of the exercise-connected mechanisms of the prevention of cardiovascular disease. ADAMTS13 is a type of metalloprotease enzyme that cleaves vWF into smaller, less active units. An increase in the levels of this protein may suggest its role in the maintenance of hemostatic balance during exercise. We also detected differences in the levels of several other known exercise-regulated proteins, such as the placental growth factor (PGF),41 resistin (RETN),64 caspase-3 (CASP3)65 and IL-6 receptor (IL6RA).66
Molecular functional analysis reveals leukocytes and ECs as the most common possible sources of the regulated proteins (Fig. 7B). Additionally, muscle tissue and platelets are identified as potential sites of origin for the observed differences. Cellular component analysis of differentially regulated proteins using a DAVID database search reveals that most of the significantly altered proteins originate from different types of vesicles e.g. membrane-bound, exosomes, alpha and secretory granules as well as from the plasma membrane and extracellular compartments (Fig. 7C).
In order to place the regulated proteins into functional groups, STRING analysis was carried out. The results show functional association for processes such as response to stress and stimulus (score = 34 and 33, respectively), immune response (score = 20), locomotion (score = 19), coagulation (score = 19) and cell migration (score = 16). Other processes that were associated with the proteins are chemotaxis, vesicle-mediated transport, platelet activation, leukocyte migration, blood vessel development, regulation of cell adhesion, cell chemotaxis, response to hypoxia and angiogenesis. It is interesting to note that these are all exercise-dependent processes expected to result in proteome changes. The visualization of known and predicted interactions is presented in Fig. 8.
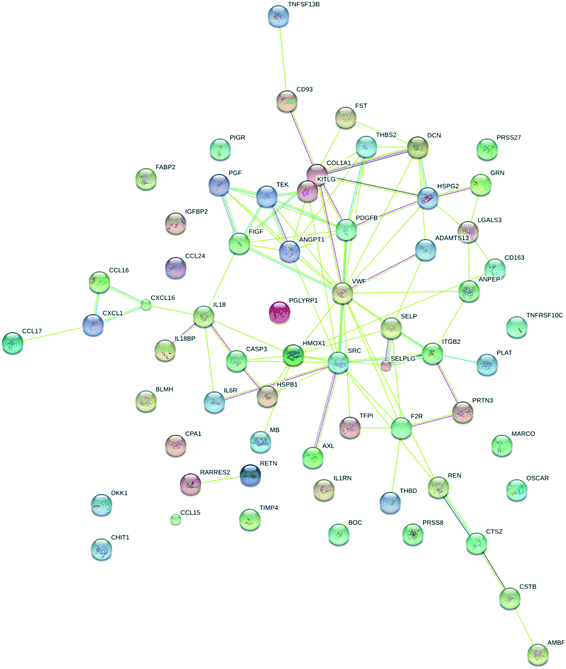 | ||
| Fig. 8 STRING analysis of differentially regulated proteins based on functional association. Colored lines between the proteins indicate different types of known and predicted interactions. | ||
Experimental
Reagents
12 μm polystyrene beads (Fluka micro particle size standard based on polystyrene monodisperse) were purchased from Sigma Aldrich. Calibrated size standard beads: Nano Polystyrene Size Standard Kit and Megamix (MMX) were purchased from Spherotech and Biocytex, respectively. Antibodies (Ab) against E-selectin (mouse anti-human CD62E, Clone 68-5H11), glycoprotein IX (mouse anti-human CD42a, Clone ALMA.16) and IgG1 isotype control (PE mouse IgG1, κ Isotype control, clone MOPC-21) were purchased from BD Pharmingen. Monoclonal mouse anti-E-selectin antibodies and RIPA buffer were purchased from Sigma-Aldrich. Protease inhibitors: PhosSTOP and Complete were purchased from Roche. Dulbecco's phosphate-buffered saline (DPBS) and the BCA Protein Assay Kit (Pierce) were purchased from Thermo Fisher Scientific.Study design and patient information
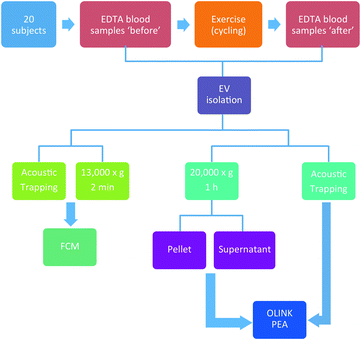
The design of the study is aimed to evaluate the acoustic trapping method for EV isolation in a clinical context, based on a bicycle exercise test, involving 20 participants with a mean age of 58. Detailed patient data are presented in Table 1 and a complete study workflow is presented in Fig. 9.| Parameters | All patients (n = 20) |
|---|---|
| Abbreviations: ACE – angiotensin-converting enzyme inhibitor, ASA – acetylsalicylic acid, ARB – angiotensin-receptor blockers, NSAID – non-steroidal anti-inflammatory drugs, PCI – percutaneous coronary intervention. | |
| Age in years, mean ± SD | 58 (18.0) |
| Height in cm, mean ± SD | 170 (7.9) |
| Weight in kg, mean ± SD | 78 (17.8) |
| Triggered ischemia, yes n = 15 (%) | 2 (13.3) |
| Chest pain n = 19 (%) | |
| Never | 10 (52.6) |
| At heavy and light exertion | 1 (5.3) |
| At light exertion | 2 (10.5) |
| At rest, at light exertion | 1 (5.3) |
| At rest | 4 (21.1) |
| At rest, at light and heavy exertion | 1 (5.3) |
| Shortness of breath, yes n = 18 (%) | |
| Never | 2 (11.1) |
| At heavy exertion | 12 (66.7) |
| At heavy and light exertion | 1 (5.6) |
| At light exertion | 2 (11.1) |
| At rest, at light exertion | 1 (5.6) |
| Previous bypass, n = 18 (%) | 1 (5.6) |
| Previous PCI, n = 19 (%) | 5 (26.3) |
| Previous MI, n = 19 (%) | 4 (21.1) |
| Diabetes, n = 20 (%) | 2 (10.0) |
| Hypertension, n = 19 (%) | 7 (36.8) |
| Elevated cholesterol levels, n = 20 (%) | 9 (45.0) |
| Current smokers, n = 20 (%) | 4 (20.0) |
| Previous smokers, n = 17 (%) | 9 (52.9) |
| Atrial fibrillation, n = 20 (%) | 2 (10.0) |
| Relative with MI before the age of 60, yes n = 18 (%) | 4 (22.2) |
| Medical use, n = 20 (%) | |
| Statins | 7 (35.0) |
| ASA | 6 (30.0) |
| B blocker | 6 (30.0) |
| Warfarin | 4 (20.0) |
| Diuretics | 5 (25.0) |
| ACE in/ARB | 3 (15.0) |
| Clopidogrel | 1 (5.0) |
| Glytrin spray | 4 (20.0) |
| NSAIDs | 1 (5.0) |
Bicycle exercise testing
In this study, 20 subjects were assigned to do a 10 min workout with progressively increasing intensity on stationary bicycles after providing an informed consent. Blood samples were collected before and 1 h after exercise. Detailed patient information and the complete study workflow are presented in Table 1 and Fig. 9, respectively.Sample collection and EV preparation
Blood samples were collected in EDTA tubes and within 30 min after blood draw, they were centrifuged at 1600g for 15 min to obtain the plasma and stored at −80 °C. The study design was approved by the Lund University research ethics committee. Informed consent was provided by the participants, and the study was performed in agreement with the Declaration of Helsinki.High-speed centrifugation for FCM
The high-speed centrifugation method was used for FCM analysis; the blood samples underwent centrifugation at 1600g for 15 min at RT, followed by 13![[thin space (1/6-em)]](https://www.rsc.org/images/entities/char_2009.gif) 000g for 2 min. 80% of the supernatant was aspirated and diluted with DPBS for subsequent labelling and FCM analysis.25
000g for 2 min. 80% of the supernatant was aspirated and diluted with DPBS for subsequent labelling and FCM analysis.25
High-speed centrifugation for PEA
For the high-speed centrifugation method used for proteomic analysis, the patient samples were centrifuged at 1600g for 15 min at RT. 100 μl of plasma was centrifuged with 20![[thin space (1/6-em)]](https://www.rsc.org/images/entities/char_2009.gif) 000g for 60 min at RT, resulting in two fractions: pellet and supernatant for subsequent proteomic (PEA) analysis.
000g for 60 min at RT, resulting in two fractions: pellet and supernatant for subsequent proteomic (PEA) analysis.
Acoustic trapping
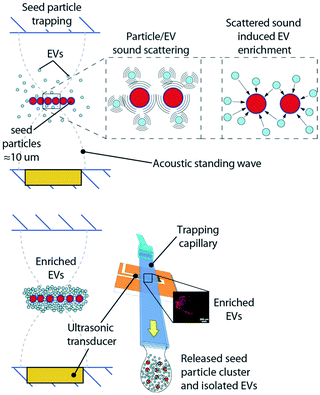
The acoustic trapping platform has been previously described by Rezeli et al.26 and by Evander et al.25 as a method for enrichment of EVs from patient plasma samples. Briefly, a rectangular glass capillary was used and a 4 MHz PZT transducer was attached through a thin layer of glycerol to the outside of the capillary. The glycerol ensures uniform acoustic coupling over time, whereas ultrasonic gels that contain water will change with acoustic coupling performance due to evaporation as time goes by. The transducer generates a local acoustic standing wave in the glass capillary that enables particles to be trapped in a noncontact manner. Smaller particles, e.g. EVs cannot be directly retained in the acoustic trap due to the low primary acoustic radiation force, Frad, which is dependent on the particle volume. A rule of thumb is that for particles below 2 μm, Frad is not sufficient for particle focusing. However, by using larger particles, which can be retained against a flow, as the pseudo stationary phase, scattered sound interaction between EVs and the seed particles can enrich EVs in the acoustic trapping region. Polystyrene beads, 12 μm, were used as seed particles in line with earlier reported protocols.25,26 The selected size of the seed particles can be smaller but should be chosen such that stable retention of the seed particles in the acoustic trapping zone is obtained at the flow rates used for sample aspiration. Fig. 10 shows a schematic of the principle for the seed particle mediated trapping of EVs. The scattered sound field between the seed particle (red) and EVs (light blue) in proximity will induce an attractive force between the two, that enriches EVs on the seed particles, whereafter the enriched EV/particle cluster can be washed in situ and subsequently released in a small droplet.For the isolation of EVs from human plasma, 12 μm polystyrene beads were used as ‘seed particles’. EVs were trapped in an automated setup consisting of an acoustic trapping unit and a robotic 96-well sample collector (AcouTrap, AcouSort AB). The patient samples were centrifuged at 1600g for 15 min at RT and diluted at a ratio of 1![[thin space (1/6-em)]](https://www.rsc.org/images/entities/char_2009.gif) :
:![[thin space (1/6-em)]](https://www.rsc.org/images/entities/char_2009.gif) 4, which corresponds to 12.5 μl of undiluted plasma. The sample was aspirated at a rate of 25 μl min−1 across the seed particle cluster. The trapped EVs were then washed and released into 100 μl of DPBS. The trapping efficiency was determined using pooled plasma from healthy volunteers and the recovery was calculated based on the levels of CD42a+ MVs.
4, which corresponds to 12.5 μl of undiluted plasma. The sample was aspirated at a rate of 25 μl min−1 across the seed particle cluster. The trapped EVs were then washed and released into 100 μl of DPBS. The trapping efficiency was determined using pooled plasma from healthy volunteers and the recovery was calculated based on the levels of CD42a+ MVs.
FCM analysis of plasma MVs
FCM analysis was done using an Accuri C6 flow cytometer (BD Accuri). Two sets of size standard beads, 0.1–0.9 μm and 0.5–3 μm, were used to calibrate the MV gate. The fluorescence gate was established using an IgG1 isotype control. 100 μl of the eluted EV suspension was incubated with 3 μl of PE-conjugated anti-CD62E Ab (BD Biosciences) for 30 min. The incubation was performed at RT in an orbital shaker set at 500 rpm. Platelet MVs were stained with anti-CD42a Ab and were used for calculating total recovery. Triton-X-based lysis was used to confirm that the fluorescent signal originated from the vesicular fraction (data not shown). 20![[thin space (1/6-em)]](https://www.rsc.org/images/entities/char_2009.gif) 000 events were collected in the MV gate and the obtained data are reported as the number of fluorescently labeled MVs μl−1.
000 events were collected in the MV gate and the obtained data are reported as the number of fluorescently labeled MVs μl−1.
TEM
TEM analysis was done both to confirm the presence of EVs in the plasma samples and the CD62E expression on the EVs. 100 μl of plasma was diluted with DPBS, centrifuged at 20![[thin space (1/6-em)]](https://www.rsc.org/images/entities/char_2009.gif) 000g for 15 min, and washed twice. An EV pellet was fixed with 2.8% of paraformaldehyde in 0.1 M Sorensen's phosphate buffer solution for 1 h on ice. The fixed pellet was re-suspended in DPBS (1
000g for 15 min, and washed twice. An EV pellet was fixed with 2.8% of paraformaldehyde in 0.1 M Sorensen's phosphate buffer solution for 1 h on ice. The fixed pellet was re-suspended in DPBS (1![[thin space (1/6-em)]](https://www.rsc.org/images/entities/char_2009.gif) :
:![[thin space (1/6-em)]](https://www.rsc.org/images/entities/char_2009.gif) 100) containing mouse anti-human CD62E Ab (10 μg ml−1 final concentration). 5 μl of the sample was placed on a glow discharge carbon-coated 400 mesh grid, blocked with 0.5% BSA followed by immunogold staining with goat anti-mouse Ab conjugated with 10 nm of gold. After a series of PBS wash steps, the samples were fixed with 1.5% glutaraldehyde and stained with 2% uranyl acetate. The samples were allowed to air dry at room temperature and imaged by TEM (FEI Tecnai Biotwin) at 100 KV.
100) containing mouse anti-human CD62E Ab (10 μg ml−1 final concentration). 5 μl of the sample was placed on a glow discharge carbon-coated 400 mesh grid, blocked with 0.5% BSA followed by immunogold staining with goat anti-mouse Ab conjugated with 10 nm of gold. After a series of PBS wash steps, the samples were fixed with 1.5% glutaraldehyde and stained with 2% uranyl acetate. The samples were allowed to air dry at room temperature and imaged by TEM (FEI Tecnai Biotwin) at 100 KV.
NTA
NTA was performed for the size distribution of EVs isolated by acoustic trapping and centrifugation methods. Additionally, EVs stained with PE-conjugated anti-human CD62E antibodies were diluted with triple-filtered (0.2 μm) DPBS and then subjected to fluorescence NTA. Ab-only and PBS controls were used to ensure measurement of the vesicles. The samples were analyzed using a NanoSight LM10 (Malvern) equipped with a 488 nm blue laser and measured for 60 s in quadruplicates using manual gain, camera level set to 14 and detection threshold to 2. The obtained files were analyzed with NTA 3.2.16 software (Malvern).Multiplex PEA
For the multiplex PEA, 200 μl of the 1![[thin space (1/6-em)]](https://www.rsc.org/images/entities/char_2009.gif) :
:![[thin space (1/6-em)]](https://www.rsc.org/images/entities/char_2009.gif) 4 diluted plasma sample, corresponding to 50 μl of undiluted plasma, was aspirated at 25 μl min−1 across the already trapped seed particle cluster and released in 50 μl of DPBS. As a comparison, a standard high-speed centrifugation protocol for pelleting MVs was used (see high-speed centrifugation for PEA). For the protein concentration measurements, we performed lysis of the trapped, pelleted and supernatant fractions with RIPA buffer containing protease inhibitors. The samples were vortexed, incubated at 4 °C for 5 min, sonicated and centrifuged at 15
4 diluted plasma sample, corresponding to 50 μl of undiluted plasma, was aspirated at 25 μl min−1 across the already trapped seed particle cluster and released in 50 μl of DPBS. As a comparison, a standard high-speed centrifugation protocol for pelleting MVs was used (see high-speed centrifugation for PEA). For the protein concentration measurements, we performed lysis of the trapped, pelleted and supernatant fractions with RIPA buffer containing protease inhibitors. The samples were vortexed, incubated at 4 °C for 5 min, sonicated and centrifuged at 15![[thin space (1/6-em)]](https://www.rsc.org/images/entities/char_2009.gif) 000g for 10 min at 4 °C to eliminate vesicular debris. The lysates were transferred to new tubes and kept frozen at −80 °C. The protein concentration was measured using the BCA Protein Assay Kit according to the manufacturer's instructions and adjusted to 0.53 μg ml−1 for all samples. The multiplex PEA allows simultaneous measurement of 92 proteins in 1 μl of sample. Two commercially available Olink Proteomics panels were used: CVD II and CVD III, consisting of known human cardiovascular and inflammation markers and exploratory proteins with biomarker potential. Each of these panels was evaluated by the manufacturer for specificity, precision, sensitivity, dynamic range, matrix effects and interference (www.olink.com). Sample analysis was done using a high-throughput real-time PCR platform. The generated data was presented as relative quantification in log2-scale as Normalized Protein eXpression (NPX).
000g for 10 min at 4 °C to eliminate vesicular debris. The lysates were transferred to new tubes and kept frozen at −80 °C. The protein concentration was measured using the BCA Protein Assay Kit according to the manufacturer's instructions and adjusted to 0.53 μg ml−1 for all samples. The multiplex PEA allows simultaneous measurement of 92 proteins in 1 μl of sample. Two commercially available Olink Proteomics panels were used: CVD II and CVD III, consisting of known human cardiovascular and inflammation markers and exploratory proteins with biomarker potential. Each of these panels was evaluated by the manufacturer for specificity, precision, sensitivity, dynamic range, matrix effects and interference (www.olink.com). Sample analysis was done using a high-throughput real-time PCR platform. The generated data was presented as relative quantification in log2-scale as Normalized Protein eXpression (NPX).
Bioinformatic analysis of proteomic data
Based on the Olink Proteomics PEA results for significantly altered proteins, functional annotation clustering analysis was done using DAVID6.7 database (www.david.abcc.ncifcrf.gov). It allows biological function, cellular origin and cellular component analyses to be performed. In order to find functional associations between the exercise-regulated proteins, the Search Tool for the Retrieval of Interacting Genes (STRING) v. 10 (www.string-db.org) was used.Statistics
Wilcoxon signed rank test for paired data was used for FCM comparison between the time points (before and 1 h after exercise). The P-values <0.05 were considered as statistically significant. Statistical analyses for the FCM data were performed using GraphPad Prism software version 7.0 (GraphPad Software Inc.). The statistical analysis for the Olink Proteomics PEA was performed using NPX values. Proteins with 50% or more missing data, either before or 1 h after exercise, were removed from the subsequent analysis. The normality of the data was determined using the Shapiro test. To evaluate the effect of exercise, a paired t-test or a Wilcoxon signed-rank test was used on each method separately (acoustic trapping, pellet, and supernatant). The statistical analysis of the data obtained using the PEA was performed using STATA 14 statistical software.Conclusions
Reproducible acoustic seed particle-mediated trapping resulted in the isolation of EVs from small volumes of human plasma with minimal loss. We performed an exercise study, comparing acoustic trapping with widely applied high-speed centrifugation protocols. Our results show that acoustic trapping produced similar results in FCM and proteomic experiments. We also demonstrate an increased recovery of EVs as compared to earlier trapping studies (3–4 times), as well as a stable recovery over time of small plasma volumes (12.5 mL undiluted plasma) not accessible by means of centrifugation-based sample preparation. The key biological findings of the present study are that the concentration of CD62E+ MVs decreases 1 h after physical exercise and that most biomolecular changes occurring after exercise are reflected in the EV content, indicating an important role of EVs as cell-derived messengers and biomarkers.Conflicts of interest
Thomas Laurell is a founder, board member and shareholder of Acousort AB, a University spin-off company that commercializes acoustofluidic technology.Acknowledgements
This work was supported by the Swedish Foundation for Strategic Research, the Knut and Alice Wallenberg Foundation, the Swedish Heart-Lung Foundation, and the Swedish Research Council, Region of Scania and ALF-medel. The authors would like to thank Rebecca Rylance for help with the statistical analysis, Lina Gefors for performing the TEM measurements and Siv Svensson for laboratory assistance.References
- S. El Andaloussi, et al. , Nat. Rev. Drug Discovery, 2013, 12, 347–357 CrossRef PubMed.
- S. F. Mause and C. Weber, Circ. Res., 2010, 107, 1047–1057 CrossRef PubMed.
- S. V. Brodsky, et al. , Am. J. Physiol., 2004, 286, H1910–H1915 Search PubMed.
- W. Jy, et al. , J. Thromb. Haemostasis, 2004, 3, 1301–1308 CrossRef PubMed.
- S. F. Lynch and C. A. Ludlam, Br. J. Haematol., 2007, 137, 36–48 Search PubMed.
- G. J. Bosman, et al. , J. Proteomics, 2012, 76, 203–210 CrossRef PubMed.
- Y. Zhang, et al. , Mol. Cell, 2010, 39, 133–144 CrossRef PubMed.
- J. J. Jimenez, et al. , Thromb. Res., 2003, 109, 175–180 CrossRef PubMed.
- Z. Mallat, et al. , Circulation, 1999, 99, 348–353 CrossRef PubMed.
- T. Helbing, et al. , World J. Cardiol., 2014, 6, 1135–1139 CrossRef PubMed.
- C. Jung, et al. , Atherosclerosis, 2012, 221, 226–231 CrossRef PubMed.
- S. S. Hu, et al. , PLoS One, 2014, 9, e104528 CrossRef PubMed.
- H. Koga, et al. , J. Am. Coll. Cardiol., 2005, 45, 1622–1630 CrossRef PubMed.
- A. F. Tramontano, et al. , Biochem. Biophys. Res. Commun., 2004, 320, 34–38 CrossRef PubMed.
- N. P. Walsh, et al. , Exerc. Immunol. Rev., 2011, 17, 64–103 Search PubMed.
- N. P. Walsh, et al. , Exerc. Immunol. Rev., 2011, 17, 6–63 Search PubMed.
- D. E. Warburton, et al. , Can. Med. Assoc. J., 2006, 174, 801–809 CrossRef PubMed.
- D. M. Babbitt, et al. , Int. J. Hypertens., 2013, 2013, 538017 Search PubMed.
- Y. W. Chen, et al. , Clin. Sci., 2013, 124, 639–649 CrossRef PubMed.
- T. Guiraud, et al. , Can. J. Cardiol., 2013, 29, 1285–1291 CrossRef PubMed.
- P. Wahl, et al. , PLoS One, 2014, 9, e96024 CrossRef PubMed.
- R. Lacroix, et al. , J. Thromb. Haemostasis, 2012, 10, 437–446 CrossRef PubMed.
- W. L. Chandler, Blood Coagulation Fibrinolysis, 2013, 24, 125–132 Search PubMed.
- Y. Yuana, et al. , Thromb. Haemostasis, 2011, 105, 396–408 CrossRef PubMed.
- M. Evander, et al. , Lab Chip, 2015, 15, 2588–2596 RSC.
- M. Rezeli, et al. , Anal. Chem., 2016, 88, 8577–8586 CrossRef PubMed.
- F. Deng, et al. , J. Cell. Mol. Med., 2017, 21, 1698–1710 CrossRef PubMed.
- R. A. Dragovic, et al. , Nanomedicine, 2011, 7, 780–788 CrossRef PubMed.
- E. Balfoussia, et al. , J. Proteomics, 2014, 98, 1–14 CrossRef PubMed.
- M. Schild, et al. , Mediators Inflammation, 2016, 2016, 4851935 Search PubMed.
- M. Leggate, et al. , J. Appl. Physiol., 2012, 112, 1353–1360 CrossRef PubMed.
- F. Guidi, et al. , Mol. BioSyst., 2011, 7, 640–650 RSC.
- C. Banfi, et al. , Proteomics, 2005, 5, 4443–4455 CrossRef PubMed.
- Y. Liu, et al. , Mol. Med. Rep., 2013, 7, 318–326 CrossRef PubMed.
- E. Shai, et al. , J. Proteomics, 2012, 76, 287–296 CrossRef PubMed.
- W. L. Dean, et al. , Thromb. Haemostasis, 2009, 102, 711–718 Search PubMed.
- M. Milioli, et al. , J. Proteomics, 2015, 121, 56–66 CrossRef PubMed.
- P. Chaichompoo, et al. , J. Proteomics, 2012, 76, 239–250 CrossRef PubMed.
- E. Ramacciotti, et al. , Thromb. Res., 2010, 125, e269–274 CrossRef PubMed.
- H. Kalra, et al. , PLoS Biol., 2012, 10, 1–5 CrossRef PubMed.
- R. Q. Landers-Ramos, et al. , Eur. J. Appl. Physiol., 2014, 114, 1377–1384 CrossRef PubMed.
- O. Elomaa, et al. , J. Biol. Chem., 1998, 273, 4530–4538 CrossRef PubMed.
- K. E. Novakowski, et al. , Immunol. Cell Biol., 2016, 94, 646–655 CrossRef PubMed.
- S. H. Su, et al. , J. Immunol., 2001, 167, 5084–5091 CrossRef.
- S. Hirano and S. Kanno, PLoS One, 2015, 10, e0142062 CrossRef PubMed.
- J. M. Hagberg, et al. , J. Appl. Physiol.: Respir., Environ. Exercise Physiol., 1982, 52, 991–994 CrossRef PubMed.
- A. Sakamoto, et al. , Eur. J. Appl. Physiol., 2015, 115, 1453–1465 CrossRef PubMed.
- J. Suk, et al. , J. Cell. Biochem., 2011, 112, 2566–2573 CrossRef PubMed.
- L. Pedersen, et al. , J. Physiol., 2011, 589, 1409–1420 CrossRef PubMed.
- S. M. Ulven, et al. , Arch. Physiol. Biochem., 2015, 121, 41–49 CrossRef PubMed.
- D. C. Nieman, Immunol. Cell Biol., 2000, 78, 496–501 CrossRef PubMed.
- R. Terra, et al. , Med. Esporte, 2012, 18, 208–214 CrossRef.
- T. Isozaki, et al. , Arthritis Rheuma, 2013, 65, 1736–1746 CrossRef PubMed.
- J. A. Timmons, et al. , BMC Biol., 2005, 3, 19 CrossRef PubMed.
- G. X. Ruan and A. Kazlauskas, J. Biol. Chem., 2013, 288, 21161–21172 CrossRef PubMed.
- J. Peake, et al. , Eur. J. Appl. Physiol., 2005, 93, 672–678 CrossRef PubMed.
- J. Hansen, et al. , Endocrinology, 2011, 152, 164–171 CrossRef PubMed.
- H. Amthor, et al. , Dev. Biol., 2004, 270, 19–30 CrossRef PubMed.
- M. W. Sun, et al. , Hypertens. Res., 2008, 31, 805–816 CrossRef PubMed.
- H. S. Thompson, et al. , Acta Physiol. Scand., 2001, 171, 187–193 CrossRef PubMed.
- J. E. van Loon, et al. , PLoS One, 2014, 9, e91687 CrossRef PubMed.
- R. A. Claus, et al. , J. Thromb. Haemostasis, 2006, 4, 902–905 CrossRef PubMed.
- J. S. Wang, Eur. J. Appl. Physiol., 2004, 91, 741–747 CrossRef PubMed.
- N. D. Roupas, et al. , Hormones, 2013, 12, 275–282 CrossRef PubMed.
- H. Sharafi and R. Rahimi, J. Strength Cond. Res., 2012, 26, 1142–1148 CrossRef PubMed.
- P. Robson-Ansley, et al., in Exercise Immunology Review, Association for the Advancement of Sports Medicine, 2010, vol. 16, pp. 56–76 Search PubMed.
Footnotes |
| † Electronic supplementary information (ESI) available: Olink Proteomics CVD II and III panels. See DOI: 10.1039/c8lc00686e |
| ‡ The authors contributed equally to the study. |
| This journal is © The Royal Society of Chemistry 2018 |

