Facile fabrication of fluorescent Fe-doped carbon quantum dots for dopamine sensing and bioimaging application†
Shujuan
Zhuo
 *ab,
Yuanyuan
Guan
a,
Hui
Li
a,
Jing
Fang
a,
Ping
Zhang
a,
Jinyan
Du
 a and
Changqing
Zhu
*a
aKey Laboratory of Functional Molecular Solids, Ministry of Education, Anhui Key Laboratory of Chemo-Biosensing, College of Chemistry and Materials Science, Anhui Normal University, Wuhu, 241000, PR China. E-mail: sjzhuo@mail.ahnu.edu.cn; zhucq@mail.ahnu.edu.cn
bAnhui Meijia New Materials Company Limited, Wuhu, 241000, PR China
First published on 12th November 2018
Abstract
In this paper, we have presented a novel strategy to fabricate Fe-doped carbon quantum dots (Fe-CQDs) for dopamine sensing applications. The Fe-CQDs are obtained by one step hydrothermal carbonization, using ethylenediamine tetraacetic acid salts and ferric nitrate as the carbon and iron source, which simultaneously incorporates Fe (dopamine-bonding site) and luminescent carbon quantum dots (fluorophores). The added dopamine containing catechol groups might form complexes with Fe ions (doped in CQDs) due to coordination. Subsequently, dopamine was oxidized to generate dopamine-quinone (a known potent electron acceptor) species by ambient O2. Thus, the coordination induced dopamine in proximity to the CQDs, which provided favourable electron acceptors in close proximity to the CQDs and produced high quenching efficiencies. Such fluorescence responses can be used for well quantifying dopamine in the range of 0.01–50 μM with a detection limit of 5 nM (S/N = 3). The proposed sensing system has been successfully used for the assay of dopamine in human urine samples. Preliminary cell image study indicates that the obtained Fe-CQDs possess high photostability and low cytotoxicity, which make them promising for biological applications.
1. Introduction
Dopamine (3,4-dihydroxyphenylethylamine, DA) is one of the important catecholamine neurotransmitters that plays a critical role in the renal, hormonal, cardiovascular and central nervous systems.1,2 Similar to other biomolecules, an optimum level of DA (0.01 to 1 μM) in body fluids is required for the smooth functioning of the human body.3,4 Nevertheless the abnormal level of DA in biological fluids is regarded as one of the indicators used in the diagnosis of several neurological diseases, including Schizophrenia, Alzheimer's disease and Parkinson's disease.5,6 Hence, it is very valuable to detect the levels of DA in biological fluids for disease diagnosis and pathological studies.7To date, various DA assay systems have been designed based on different physicochemical principles, such as electrochemistry,8 high-performance liquid chromatography,9 capillary electrophoresis,10 fluorescence11–13 and chemiluminescence assay.14 Of various chemosensory protocols, fluorescence techniques,15,16 as powerful tools, are superior due to their nondestructive nature, high sensitivity and wide dynamic ranges.
Carbon quantum dots (CQDs), acknowledged as new candidates for luminescent materials, have been expected to overtake older pioneers in many areas by virtue of their favorable optical stability, high surface area, versatile surface modification and fascinating electronic character.17,18 Functionalizing or doping CQDs to obtain new chemical or physical properties, thus becomes a hot and exciting topic in frontier studies of CQDs.19–21 Among many approaches, transition metal dopants have long been considered as powerful tools for modifying the electronic, optical and magnetic properties of nanoparticulate hosts.22,23 Meanwhile, doping is also a popular approach to enhance the quantum yield and application capabilities of CQDs.24–27
It has been reported that Fe3+ can bond with a catechol-like amino acid to form catechol-Fe3+ complexes.28 The dopamine containing catechol groups might form complexes with Fe-doped carbon quantum dots (Fe-CQDs), following oxidation to generate hydroquinone and subsequent quenching of the luminescence of CQDs.
Therefore, a conceptual demonstration of the fabrication of an Fe-CQD based dopamine sensing motif, which simultaneously incorporates Fe (dopamine-binding site) and high-efficiency luminescent carbon quantum dots (luminophores), will be significant for both fundamental research and applications.
Herein, we present a simple but effective fluorescent platform for dopamine sensing with Fe-CQDs as the signal output. The Fe-CQDs are fabricated by a simple one-step hydrothermal route, using ethylenediamine tetraacetic acid salts (EDTA-2Na) and ferric nitrate as the carbon and iron source. Interestingly, the added dopamine can result in a linear fluorescence quenching of Fe-CQDs. Such fluorescence responses can be used for well quantifying dopamine in the range of 0.01–50 μM with 5 nM detection limit, and have been successfully used for the assay of dopamine in real human urine samples. Furthermore, the as-prepared Fe-CQDs show applicability in cell-imaging with lower cytotoxicity, which indicates the potential applications of Fe-CQDs as attractive candidates for biolabeling and tracking in the biomedical field.
2. Experimental section
2.1 Materials
Dopamine hydrochloride (DA), ascorbic acid (AA), uric acid (UA), glucose (Glu), D-(+)-galactose (D-Gal), and D-fructose (D-Fru) were purchased from Aladdin Chemical Reagent Co. (China). EDTA-2Na and ferric nitrate nonahydrate (Fe(NO3)3·9H2O, AR) were obtained from Shanghai Sinopharm Chemical Reagent Company (China). L-Serine (L-Ser), methionine (Met), L-tryptophan (L-Try), L-cysteine (L-Cys), L-aspartic acid (L-Asp), L-phenylalanine (L-Phe), L-glutamic acid (L-Glu) and L-lysine (L-Lys) were brought from Macklin Biochemical Co. Ltd (Shanghai, China). Dulbecco's modified Eagle's medium (DMEM), MTT reagent, fetal bovine serum, dimethyl sulphoxide (DMSO), and human cervical cancer cells (HeLa cells) were purchased from Wuhan Boster Biological Technology Co. Ltd (China). Phosphate buffer solution (PBS, 0.1 M) was prepared by mixing Na2HPO4·12H2O and NaH2PO4·2H2O solutions. All the chemical reagents were of analytical grade. Ultrapure water (18.2 MΩ cm) was used throughout.2.2 Instruments and characterization
The fluorescence and UV-vis absorption spectra were recorded on an F-4600 fluorescence spectrophotometer and a Hitachi UV-2910 spectrophotometer (Tokyo, Japan), respectively. Characterization of transmission electron microscopy (TEM) was carried out on a Tecnai G2 20 S-TWIN under an accelerating voltage of 200 kV. The Fourier transform infrared (FT-IR) spectrum was recorded with a KBr window on a PerkinElmer PE-983 FT-IR spectrophotometer. X-ray photoelectron spectroscopy (XPS) was performed using a thermoelectron instrument (Thermo-VG Scientific ESCALAB 250). The quantum yield (QY) was measured with an Edinburgh Instruments FLS920 spectrofluorimeter. All pH values were measured with a Model pHs-3C meter (Shanghai, China). Confocal images were obtained using a confocal laser scanning microscope (Fluoview 1000, Olympus).2.3 Synthesis of the Fe-doped carbon quantum dots
The Fe-CQDs were prepared by a facile hydrothermal route. Typically, a mixture of 0.112 g EDTA-2Na and 0.202 g Fe(NO3)3·9H2O was dissolved in 30 mL ultrapure water under stirring. Then the solution was transferred to a Teflon-lined autoclave chamber and heated to 180 °C for 10 h. The products with large size particles were directly eliminated from the resulting solution by centrifugation at 15![[thin space (1/6-em)]](https://www.rsc.org/images/entities/char_2009.gif) 000 rpm for 20 min after the reaction cooled to room temperature. The as-prepared products containing solution were further purified in a dialysis bag (retained molecular weight: 500–1000 Da) overnight to obtain Fe-CQDs. The Fe-CQDs were further treated by freeze drying to obtain powders, then redispersed in ultrapure water at a concentration of 100 μg mL−1 and then preserved at 4 °C for further use. For contrast, the CQDs without Fe doping (EDTA-2Na as a precursor) were also prepared using the same procedure.
000 rpm for 20 min after the reaction cooled to room temperature. The as-prepared products containing solution were further purified in a dialysis bag (retained molecular weight: 500–1000 Da) overnight to obtain Fe-CQDs. The Fe-CQDs were further treated by freeze drying to obtain powders, then redispersed in ultrapure water at a concentration of 100 μg mL−1 and then preserved at 4 °C for further use. For contrast, the CQDs without Fe doping (EDTA-2Na as a precursor) were also prepared using the same procedure.
2.4 Procedures for DA sensing
Amounts of 300 μL (100 μg mL−1) of purified Fe-CQDs and 1 mL 0.1 M PBS buffer solution (pH = 10) were placed in a series of 5 mL volumetric tubes, followed by the addition of different concentrations of dopamine. The mixture was diluted to 2 mL with water and shaken thoroughly, and then incubated at room temperature for 30 min. The fluorescence intensity was measured at 430 nm with an excitation wavelength of 360 nm.2.5 Cell culture and MTT assay
HeLa cells were cultured in DMEM containing high glucose supported by 10% fetal bovine serum (v/v) for 24 h at 37 °C in a 5% CO2/95% air incubator. And different concentrations of Fe-CQDs (0, 50, 100, 125, 250, 400 μg mL−1) were put into the incubator cultured for another 24 h. Then 10 μL (5 mg mL−1) MTT and 90 μL culture solution were introduced into the well. The cells were incubated for another 4 h. Finally, all media were removed and 100 μL DMSO was added followed by shaking for 15 min. The absorbance of each well was measured at 490 nm using enzyme-labeled instrument (SP-MAX 2300A) with pure DMSO as a blank. Non-treated cells were used as a control. The cell viability was determined using the formula: cell viability (%) = (mean of the absorbance value of the treatment group/mean absorbance value of the control group) × 100%.2.6 In vivo fluorescence imaging
HeLa cells were cultured in 96-well plates with DMEM containing high glucose supported by 10% fetal bovine serum (v/v) at 37 °C in 5% CO2/95% air for 24 h. After the cells were incubated with 300 μg mL−1 Fe-CQD suspension for 24 h, the medium was removed and the cells were washed three times with PBS (pH 7.4) buffer to remove redundant probes left in solution to optimize the background signal. The confocal fluorescence imaging in live cells was performed under a bright field and excited by using 405 and 488 nm lasers, respectively.2.7 Live subject statement
The urine sample was obtained from a healthy female volunteer (a postgraduate of our research group). Informed consent was obtained from the human participant of this study.3. Results and discussion
3.1 Characterization of the Fe-doped carbon quantum dots
A typical TEM image (Fig. 1a) shows that the as-prepared Fe-CQDs are monodisperse with diameters ranging from 1 to 3.5 nm, and the average diameter is 2 nm (Fig. 1b). A further close observation from a high resolution TEM (HRTEM) image (inset in Fig. 1a) reveals that the lattice spacing of 0.24 nm, which is consistent with the (100) facet of graphite carbon and demonstrates the good crystallinity of Fe-CQDs.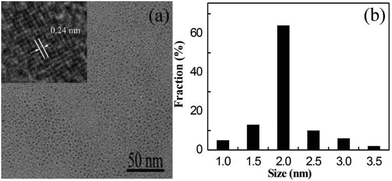 | ||
| Fig. 1 (a) TEM image of the Fe-CQDs. Inset: high-resolution TEM of the Fe-CQDs. (b) The particle size distribution histogram of the Fe-CQDs. | ||
The surface structure and composition of the as-prepared Fe-CQDs were then investigated. The FT-IR spectrum (Fig. S1, ESI†) of the Fe-CQDs exhibits distinct absorption bands at 3453, 2762 and 1631 cm−1, which can be attributed to the O–H, C–H and C![[double bond, length as m-dash]](https://www.rsc.org/images/entities/char_e001.gif) O stretching vibration, respectively. The peak appearing at 1386 cm−1 could be identified as the C–N bond. The peak at 1068 cm−1 could be assigned to the bending vibration of the C–O bond.29 The result implies the existence of abundant oxygen-containing groups on the surface of Fe-CQDs, which endows the Fe-CQDs with excellent water-solubility.
O stretching vibration, respectively. The peak appearing at 1386 cm−1 could be identified as the C–N bond. The peak at 1068 cm−1 could be assigned to the bending vibration of the C–O bond.29 The result implies the existence of abundant oxygen-containing groups on the surface of Fe-CQDs, which endows the Fe-CQDs with excellent water-solubility.
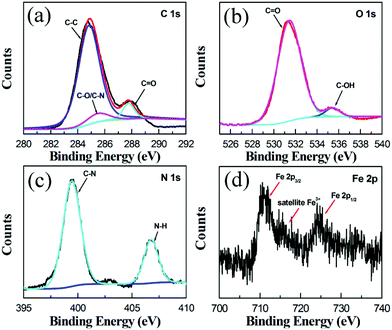
To further explore the elemental composition and chemical bond of the Fe-CQDs, XPS measurements were performed. The Fe-CQDs contain four elements, C, N, O and Fe with contents of 58.1, 9.5, 30 and 2.4 at%, respectively. As shown in Fig. S2 (ESI),† four dominant peaks at 284.8, 399.5, 531.3 and 710.8 eV are attributed to C 1s, N 1s, O 1s and Fe 2p, respectively. The high-resolution XPS spectrum of C 1s (Fig. 2a) can be subdivided into three peaks at 284.5, 285.1 and 288.0 eV, which are attributed to the C–C, C–O/C–N and C![[double bond, length as m-dash]](https://www.rsc.org/images/entities/char_e001.gif) O groups. XPS analysis of the O 1s spectrum (Fig. 2b) shows two peaks at 531.4 and 535.4 eV, corresponding to C
O groups. XPS analysis of the O 1s spectrum (Fig. 2b) shows two peaks at 531.4 and 535.4 eV, corresponding to C![[double bond, length as m-dash]](https://www.rsc.org/images/entities/char_e001.gif) O and C–OH groups, respectively. The N 1s spectrum (Fig. 2c) consists of two peaks at 399.4 and 406.8 eV, which are ascribed to C–N and N–H groups. In the high-resolution spectrum of Fe 2p (Fig. 2d), the presence of peaks at 711, 724.7 eV and the satellite peak at about 718 eV confirms that iron exists in its high oxidation state,30,31 demonstrating the existence of Fe3+ ions in the Fe-CQDs prepared by the one-step hydrothermal process.
O and C–OH groups, respectively. The N 1s spectrum (Fig. 2c) consists of two peaks at 399.4 and 406.8 eV, which are ascribed to C–N and N–H groups. In the high-resolution spectrum of Fe 2p (Fig. 2d), the presence of peaks at 711, 724.7 eV and the satellite peak at about 718 eV confirms that iron exists in its high oxidation state,30,31 demonstrating the existence of Fe3+ ions in the Fe-CQDs prepared by the one-step hydrothermal process.
To further explore the optical properties of the as-synthesized Fe-CQDs, the absorption and detailed fluorescence study by using different excitation wavelengths were carried out. The UV-vis absorption spectrum of the Fe-CQDs in water exhibits a strong absorption peak at 312 nm (Fig. S3, ESI†). In the inset of Fig. S3,† the photographs of the dispersed Fe-CQDs illuminated under UV light (365 nm) are shown. The bright blue fluorescence of the Fe-CQDs is strong enough to be easily seen with the naked eye. Remarkably, the Fe-CQDs exhibited a high QY value of 16.23%.
Most of the reported CQDs displayed excitation-dependent fluorescence behaviors due to the different sized particles in the samples and the different surface state distributions.32,33 Unexceptionally, as the excitation wavelength increases from 300 to 420 nm, the emission from the Fe-CQDs gradually shifted to a longer wavelength (Fig. 3a and b) and shows a strong peak at 430 nm with an optimal excitation wavelength at 360 nm.
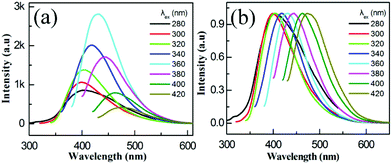 | ||
| Fig. 3 (a) Fluorescence spectra of the Fe-CQDs at different excitation wavelengths; (b) the corresponding normalized fluorescence spectra. | ||
The stability and reproducibility test of the Fe-CQDs over time was carried out under UV light (365 nm) irradiation. As presented in Fig. S4 (ESI),† no obvious change of the fluorescence intensity was observed after irradiation for 180 min, indicating the high stability of Fe-CQDs.
3.2 Interaction of the Fe-doped carbon quantum dots and dopamine
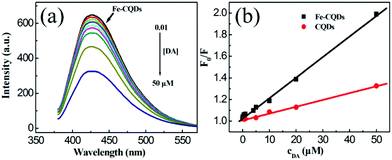
It has been reported that dopamine can be oxidized to generate dopamine-quinone species by ambient O2, which is a known potent electron acceptor in biological and abiotic formats34 and can function as an electron-acceptor quenching QD photoluminescence. Herein, for our Fe-CQDs, the hydroquinone groups of dopamine can also be oxidized to the quinone species which might result in the quenching of the fluorescence of CQDs. Thus, the present Fe-CQDs might be a potential candidate for the direct turn-off sensing of dopamine. As we expected, the fluorescence intensities of the Fe-CQDs at 430 nm are highly sensitive to dopamine and decrease as the concentration of the analyte is increased (Fig. 4a).3.3 Factors affecting the fluorescence sensing of dopamine
For better sensing performances, the experimental conditions were then optimized. As shown in Fig. S5a (ESI),† the fluorescence intensity of the Fe-CQDs itself changed little with an increment of the pH value from 6 to 12. The addition of dopamine leads to the fluorescence quenching of Fe-CQDs. It is worth noting that the quenching efficiencies of dopamine are rather low under acidic to weak alkaline conditions. At pH > 9, the quenching becomes noticeable, because more significant quenching occurs when the pH is changed from 9 to 10, whereas a further increase in pH to 12 results in a tiny change. As reported, dopamine undergoes autoxidation and is also oxidized by molecular O2, generating a concomitant H2O2 species. Such coupled electron–proton systems exhibit slow redox kinetics with rate constants in aqueous solution that directly depend on pH.35,36 The rates of oxidation to quinone increase markedly in buffers by >1000-fold as the pH increases from 6 to 12.37 Considering the quenching efficiency, a basic condition (pH 10) was adopted in the sensing. As described in Fig. S5b (ESI),† the reaction time also affects the quenching effects. Overall, the interaction can reach the balance at 30 min. As a consequence, 30 min of reaction time was appropriate for the sensing. Then the influence of pH on the fluorescence of the CQD (no Fe)–DA system was also investigated. As shown in Fig. S6 (ESI),† the variation tendency of pH is similar to that of the Fe-CQD–DA system, though the quenching magnitude is lower.3.4 Analytical performances for dopamine sensing
Under the conditions discussed above, the linear response range of the sensing system was measured. As shown in Fig. 4b (black line above), there is a good linear relationship (R = 0.998) between the F0/F and the concentrations of dopamine in the range from 0.01 to 50 μM with a detection limit of 5 nM (signal-to-noise ratio of 3). As summarized in Table S1 (ESI),† the detection limit and linear detection range of DA from this as-constructed fluorescent probe were comparable or superior to other fluorescent sensors.In order to have a comparison, contrast experiments were carried out using bare undoped CQDs to further elucidate the interaction mechanism between Fe-CQDs and dopamine. As presented in Fig. 4b (red line below), there is also a linear relationship between the intensity ratio and the amounts of dopamine. However, the slope of the calibration plot using Fe-CQDs as the probe (0.01894) is 3 times higher than that obtained from bare CQDs (0.00623) under the conditions identical to those described above. That is to say, the sensitivity of the Fe-CQD probe is much higher than that of the bare CQD probe. This phenomenon attracted our great attention.
Through literature research, it was found that Fe3+ can bond with the catechol-like amino acid dihydroxy-phenylalanine to form catechol-Fe3+ complexes.28 Furthermore, the stoichiometry of catechol-Fe3+ complexes (mono-, bis-, or tris-) is controlled by pH via the deprotonation of the catechol hydroxyls. The pH required to establish the bis- and tris-complexes is typically reported to be above pH 7. Astonishingly, the tris- and bis-catechol-Fe3+ complexes possess some of the highest know stability constants of metal–ligand chelates (log![[thin space (1/6-em)]](https://www.rsc.org/images/entities/char_2009.gif) KS ≈ 37–40, where KS is the equilibrium constant for the complex formation).38,39
KS ≈ 37–40, where KS is the equilibrium constant for the complex formation).38,39
In terms of our sensing motif, the dopamine containing catechol groups might form complexes with Fe ions (doped in CQDs) due to coordination. Such interactions would bring dopamine in proximity to the CQDs, subsequent oxidation to engender hydroquinone, which provided favourable electron acceptors in close proximity to the CQDs and produced higher quenching efficiencies.40
To further clarify the mechanism, a series of contrast experiments were implemented. Firstly, degassing solution with nitrogen to remove dissolved oxygen reduced the quenching efficiency significantly (Fig. S7, ESI†), indicating that the quenching process is oxygen-dependent. Secondly, upon adding free iron(III) ions to the system, a perceptible decrease of quenching efficiency was observed (Fig. S8, ESI†), demonstrating that the free iron ions might be a competitive binder. Thirdly, addition of ethylenediamine to the system would depress the quenching level, however, the degree of reduction is little (Fig. S9, ESI†), which might be ascribed to the weaker interaction between Fe-CQDs and ethylenediamine. Lastly, the magnitude of quenching upon adding dopamine or its pre-oxidized form (quinone) was compared to elucidate the interaction. Astonishingly, the pre-prepared quinone induced a lower quenching extent (Fig. S10, ESI†). The possible reason was that the formation of DA/Fe-CQD complexes was favourable for electron transfer compared with the collisional interaction of the pre-prepared quinone with Fe-CQDs.
The above results indicate that the better sensing performance of Fe-CQDs (compared with bare undoped CQDs) makes the Fe ions doped in CQDs as dopamine-bonding sites, which cause the dopamine to approach the CQDs, following the oxidation to generate hydroquinone, concomitantly, the efficiency of quenching is greatly enhanced.
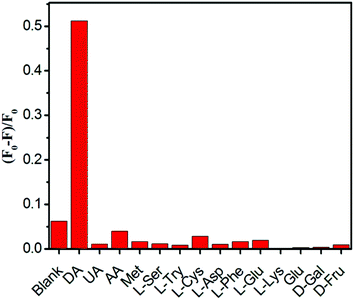
Selectivity is a critical parameter to evaluate the performance of a fluorescent chemosensor. That is to say, an excellent fluorescent probe should not only exhibit high sensitivity, but also be enriched with specific selectivity. As can be seen from Fig. 5, these tested potential interfering substances such as UA, AA, glucide, and amino acids have very little effect on the Fe-CQD fluorescence, and only DA results in a significant fluorescence quenching of Fe-CQDs, indicating good selectivity for DA.
3.5 Real sample assay
As reported,41 the reference range of dopamine in urine for 3–8 and >17 year old humans are 80–378 μg per 24 h (0.523–2.472 μmol per 24 h) and 52–480 μg per 24 h (0.340–3.139 μmol per 24 h), respectively. Thus, elevated or reduced amounts of DA in urine are important pathological indicators. To investigate the reliability of the proposed fluorescent probes, the standard addition method was employed to determine DA in human urine samples. The urine sample was diluted 100-fold using PBS (pH = 10) before detection. The results of recovery tests from 99.7% to 105.6% are satisfactory (Table 1), indicating the practicability and reliability of the proposed sensing strategy.| Samples | Added (μM) | Found (μM) | Recovery (%) | RSD (%, n = 3) |
|---|---|---|---|---|
| 1 | 2 | 2.1 | 105 | 3.6 |
| 2 | 5 | 5.28 | 105.6 | 2.4 |
| 3 | 10 | 9.97 | 99.7 | 1.4 |
3.6 Cytotoxicity and intracellular bioimaging
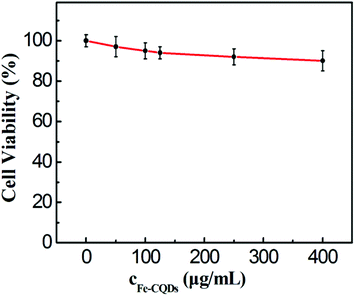
For a further biological application point of view, MTT assays were first employed to evaluate the cytotoxicity of the as-prepared Fe-CQDs. The Fe-CQDs might be taken up by HeLa cells after coincubation (likely via non-specific endocytosis). As shown in Fig. 6, >90% viability of the HeLa cells was still maintained after incubation for 24 h, with the fluorescent probe up to 400 μg mL−1, which is higher than that used in cell experiments (300 μg mL−1). Thus, the results suggest that the probe can be considered to exert low toxicity to live cells.The control experiment has been performed to study the effect of cell autofluorescence. As presented in Fig. 7, no fluorescence was observed from HeLa cells in the absence of the fluorescent probe (Fe-CQDs) in the control sample, implying that the Fe-CQDs could be used as cell imaging agents with a high signal to background ratio.
 | ||
| Fig. 7 Control cell experiments without the addition of Fe-CQDs. (a) HeLa cells under a bright field and (b) excitation at 405 nm. | ||
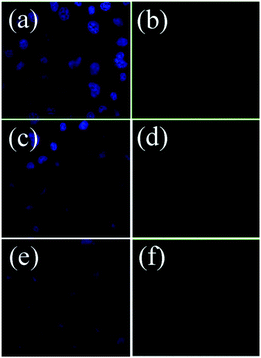
Then the possible application of the synthesized Fe-CQDs as cell-imaging agents was explored. Fig. S11 (ESI)† shows the confocal images of the HeLa cells treated with Fe-CQDs under a bright field (Fig. S11a),† with excitation wavelengths of 405 and 488 nm. The internalized Fe-CQDs exhibited bright blue fluorescence under 405 nm light excitation (Fig. S11b†). Furthermore, the excitation dependent luminescence of the Fe-CQDs gives rise to several visible consequences in imaging. When the laser excitation was changed to 488 nm, fluorescent green color was observed (Fig. S11c†). More interestingly, no obvious reduction in the fluorescence intensity was observed even after excitation for a prolonged time, indicating the high photostability of the as-prepared Fe-CQDs. Intracellular dopamine sensing was conducted in view of the negligible autofluorescence from cells itself. As presented in Fig. 8, by the addition of 5 μM dopamine, the intracellular bright fluorescence of the Fe-CQDs (Fig. 8a) distinctly decreased (Fig. 8c). Upon further increment of dopamine to 50 μM, the fluorescence quenching was more obvious (Fig. 8e). These observations manifested that the as-synthesized Fe-CQDs could serve as promising candidates for chemical sensing and biological applications.
4. Conclusions
In summary, a novel and well-designed sensing strategy has been proposed for dopamine assay, by using Fe-CQDs as fluorescence reporters, in which Fe plays a role as a bonding site and CQDs are employed as a response signal. Interestingly, the sensitivity to detecting dopamine using an Fe-CQD probe is much higher than that obtained from undoped CQDs. By combination of low cytotoxicity and high photostability, the Fe-CQD based fluorescent motif has been successfully used for intracellular bioimaging. We expect that this strategy may provide a valuable reference for other metal doped luminescent materials to develop low-cost and sensitive sensors for biological applications.Conflicts of interest
There are no conflicts to declare.Acknowledgements
This work was supported by the National Natural Science Foundation of China (grant no. 21303003, 21375003 and 21705003).References
- A. Numan, M. M. Shahid, F. S. Omar, K. Ramesh and S. Ramesh, Sens. Actuators, B, 2017, 238, 1043–1051 CrossRef CAS
.
- F. Qu, Y. N. Liu, R. M. Kong and J. M. You, Microchim. Acta, 2017, 184, 4417–4424 CrossRef CAS
.
- S. Palanisamy, X. H. Zhang and T. He, J. Mater. Chem. B, 2015, 3, 6019–6025 RSC
.
- N. P. Mani, M. Ganiga and J. Cyriac, Analyst, 2018, 143, 1691–1698 RSC
.
- H. Zhao, Y. Z. Zhang and Z. B. Yuan, Analyst, 2001, 126, 358–360 RSC
.
- S. R. Ali, Y. F. Ma, R. R. Parajuli, Y. Balogun, W. Y. C. Lai and H. X. He, Anal. Chem., 2007, 79, 2583–2587 CrossRef CAS PubMed
.
- J. L. Chen, X. P. Yan, K. Meng and S. F. Wang, Anal. Chem., 2011, 83, 8787–8793 CrossRef CAS PubMed
.
- C. Zhang, J. J. Ren, J. X. Zhou, M. Cui, N. Li, B. K. Han and Q. Chen, Analyst, 2018, 143, 3075–3084 RSC
.
- N. Li, J. Z. Guo, B. Liu, Y. Q. Yu, H. Cui, L. Q. Mao and Y. Q. Lin, Anal. Chim. Acta, 2009, 645, 48–55 CrossRef CAS PubMed
.
- E. Sanchez-Lopez, C. Montealegre, A. L. Crego and M. L. Marina, Anal. Chem., 2015, 67, 82–99 CAS
.
- S. H. Yang, X. H. Sun, Z. Y. Wang, X. Y. Wang, G. S. Guo and Q. S. Pu, Sens. Actuators, B, 2017, 253, 752–758 CrossRef CAS
.
- Y. S. He, C. G. Pan, H. X. Cao, M. Z. Yue, L. Wang and G. X. Liang, Sens. Actuators, B, 2018, 265, 371–377 CrossRef CAS
.
- A. L. Chibac, V. Melinte, T. Buruiana and E. C. Buruiana, Sens. Actuators, B, 2017, 253, 987–998 CrossRef CAS
.
- R. Cui, Y. P. Gu, L. Bao, J. Y. Zhao, B. P. Qi, Z. L. Zhang, Z. X. Xie and D. W. Pang, Anal. Chem., 2012, 84, 8932–8935 CrossRef CAS PubMed
.
- P. F. Shen and Y. S. Xia, Anal. Chem., 2014, 86, 5323–5329 CrossRef CAS PubMed
.
- Y. J. Pang, Y. Shi, Y. D. Pan, Y. F. Yang, Y. J. Long and H. Z. Zheng, Sens. Actuators, B, 2018, 263, 177–182 CrossRef CAS
.
- S. J. Zhuo, M. W. Shao and S. T. Lee, ACS Nano, 2012, 6, 1059–1064 CrossRef CAS PubMed
.
- X. T. An, S. J. Zhuo, P. Zhang and C. Q. Zhu, RSC Adv., 2015, 5, 19853–19858 RSC
.
- Z. B. Qu, X. G. Zhou, L. Gu, R. M. Lan, D. D. Sun, D. J. Yu and G. Y. Shi, Chem. Commun., 2013, 49, 9830–9832 RSC
.
- H. Y. Zhang, Y. Wang, S. Xiao, H. Wang, J. H. Wang and L. Feng, Biosens. Bioelectron., 2017, 87, 46–52 CrossRef CAS PubMed
.
- Q. Xu, J. F. Wei, J. L. Wang, Y. Liu, N. Li, Y. S. Chen, C. Gao, W. W. Zhang and T. S. Sreeprased, RSC Adv., 2016, 6, 28745–28750 RSC
.
- Y. Wang, Y. Zhang, M. Y. Jia, H. Meng, H. Li, Y. F. Guan and L. Feng, Chem. – Eur. J., 2015, 21, 14843–14850 CrossRef CAS PubMed
.
- M. C. Rong, Y. C. Liang, D. L. Zhao, B. J. Chen, C. Pan, X. Z. Deng, Y. B. Chen and J. He, Sens. Actuators, B, 2018, 265, 498–505 CrossRef CAS
.
- Q. Xu, Y. Liu, R. G. Su, L. L. Cai, B. F. Li, Y. Y. Zhang, L. Z. Zhang, Y. J. Wang, Y. Wang, N. Li, X. Gong, Z. P. Gu, Y. S. Chen, Y. L. Tan, C. B. Dong and T. S. Sreeprasad, Nanoscale, 2016, 8, 17919–17927 RSC
.
- J. Y. Du, Y. Zhao, J. Chen, P. Zhang, L. L. Gao, M. Q. Wang, C. Cao, W. Wen and C. Q. Zhu, RSC Adv., 2017, 7, 33929–33936 RSC
.
- W. T. Wu, L. Y. Zhan, W. Y. Fan, J. Z. Song, X. M. Li, Z. T. Li, R. Q. Wang, J. Q. Zhang, J. T. Zheng, M. B. Wu and H. B. Zeng, Angew. Chem., Int. Ed., 2015, 54, 6540–6544 CrossRef CAS PubMed
.
- F. Li, C. J. Liu, J. Yang, Z. Wang, W. G. Liu and F. Tian, RSC Adv., 2014, 4, 3201–3205 RSC
.
- N. Holten-Andersen, M. J. Harrington, H. Birkedal, B. P. Lee, P. B. Messersmith, K. Y. C. Lee and J. H. Waite, Proc. Natl. Acad. Sci. U. S. A., 2011, 108, 2651–2655 CrossRef CAS PubMed
.
- X. Zhou, P. P. Ma, A. Q. Wang, C. F. Yu, T. Qian, S. S. Wu and J. Shen, Biosens. Bioelectron., 2015, 64, 404–410 CrossRef CAS PubMed
.
- B. Wang, Y. F. Chen, Y. Y. Wu, B. Weng, Y. S. Liu and C. M. Li, Microchim. Acta, 2016, 183, 2491–2500 CrossRef CAS
.
- T. Yamashita and P. Hayes, Appl. Surf. Sci., 2008, 254, 2441–2449 CrossRef CAS
.
- T. L. Shao, G. D. Wang, X. T. An, S. J. Zhuo, Y. S. Xia and C. Q. Zhu, RSC Adv., 2014, 4, 47977–47981 RSC
.
- T. L. Shao, P. Zhang, L. Tang, S. J. Zhuo and C. Q. Zhu, Microchim. Acta, 2015, 182, 1431–1437 CrossRef CAS
.
- K. G. Qu, J. S. Wang, J. S. Ren and X. G. Qu, Chem. – Eur. J., 2013, 19, 7243–7249 CrossRef CAS PubMed
.
- E. Laviron, J. Electroanal. Chem., 1984, 164, 213–227 CrossRef CAS
.
- H. O. Finklea, J. Phys. Chem. B, 2001, 105, 8685–8693 CrossRef CAS
.
- A. Klegeris, L. G. Korkina and S. A. Greenfield, Free Radicals Biol. Med., 1995, 18, 215–222 CrossRef CAS PubMed
.
- M. J. Sever, J. T. Weisser, J. Monahan, S. Srinivasan and J. J. Wilker, Angew. Chem., Int. Ed., 2004, 43, 448–450 CrossRef CAS PubMed
.
- A. Avdeef, S. R. Sofen, T. L. Bregante and K. N. Raymond, J. Am. Chem. Soc., 1978, 100, 5362–5370 CrossRef CAS
.
- I. L. Medintz, M. H. Stewart, S. A. Trammell, K. Susumu, J. B. Delehanty, B. C. Mei, J. S. Melinger, J. B. Blanco-Canosa, P. E. Dawson and H. Mattoussi, Nat. Mater., 2010, 9, 676–684 CrossRef CAS PubMed
.
- M. A. F. Nejad and M. R. Hormozi-Nezhad, Anal. Methods, 2017, 9, 3505–3512 RSC
.
Footnote |
| † Electronic supplementary information (ESI) available. See DOI: 10.1039/c8an01741g |
| This journal is © The Royal Society of Chemistry 2019 |

