 Open Access Article
Cocrystal design by network-based link prediction†
Jan-Joris
Devogelaer
 ,
Sander J. T.
Brugman
 ,
Hugo
Meekes
 ,
Paul
Tinnemans
 ,
Elias
Vlieg
 and
René
de Gelder
 *
*
Radboud University, Heyendaalseweg 135, 6525AJ Nijmegen, The Netherlands. E-mail: r.degelder@science.ru.nl
First published on 3rd October 2019
Abstract
Cocrystallization is an attractive formulation tool for tuning the physicochemical properties of a compound while not altering its molecular structure and has gained interest from both industry and academia. Although the design strategy for cocrystals has marked several milestones over the past few decades, a holistic approach that utilizes as much cocrystal data as possible is still lacking. In this paper, we describe how information contained in the Cambridge Structural Database (CSD) can be used to construct a data-driven cocrystal prediction method, based on a network of coformers and link-prediction algorithms. Experimental validation of the method leads to the discovery of ten new cocrystal structures for its top ten predictions. The prediction method is not restricted to compounds present in the CSD: by combining the information of only a few cocrystals of an unknown coformer (e.g. an API in development) together with the information contained in the database, a set of relevant cocrystal candidates can be generated.
1 Introduction
The physicochemical properties of highly valuable chemicals, such as active pharmaceutical ingredients (APIs),1 agrochemicals2 and pigments,3 are often not optimal for their final application. Accordingly, in an effort to synthesize products with more desirable characteristics, various other solid-state forms of chemicals, such as polymorphs, amorphous phases and multi-component crystals, including salts, solvates and cocrystals, can be considered.4 In particular, because not all molecules contain ionizable functional groups and only a limited number of (organic) solvents are available, cocrystallization has emerged as an attractive formulation tool.Cocrystals are single-phase solid complexes, consisting of two or more neutral molecules that are solid under ambient conditions (called coformers) with a well-defined stoichiometric ratio, for which no charge transfer is observed in the resulting crystal structure.5,6 A subclass of cocrystals that is often encountered are pharmaceutical cocrystals, where one of the constituents is an API and the other a pharmaceutically acceptable coformer found in the GRAS‡ list. However, any crystal that contains multiple molecules and conforms to the definition above is considered to be a cocrystal. The presence of an additional component modifies the intermolecular interactions in the underlying crystal structure, making it possible to alter several mechanical and physicochemical properties (e.g. solubility, permeability, taste and hygroscopicity).1,7,8 Because the molecular structure of the constituents remains unchanged, the FDA classifies cocrystals of APIs in the same category as polymorphs and salts.9 This drastically reduces the risks and steps to be taken from a regulatory perspective, as previously determined safety and efficacy tests remain valid for cocrystalline products. Additionally, the preparation of cocrystals gives various opportunities regarding intellectual property rights.10
Chirality, or more specifically homochirality, plays an important role in today's industry that demands enantiomerically pure products.11 For chiral coformers that crystallize as a racemic compound, the presence of an additional component can give rise to the formation of a racemic conglomerate.§ Crystallization of conglomerates is a key requirement for various post-synthetic separation processes based on crystallization,13–17 enabling the enantiopure production of one stereoisomer. Although only a few examples of conglomerate cocrystals are known so far,18–20 the number of available coformers largely exceeds the number of counter-ions and solvents.21 Furthermore, it has recently been shown how enantiospecific cocrystals (i.e. a cocrystal that is formed preferentially with one of the enantiomers by the addition of a chiral coformer) can be used to separate a racemic compound forming molecule,22,23 essentially being the neutral analogue of the widely used resolution via diastereomeric salts. Hence, cocrystallization also has large potential for applications regarding chirality, and could become a key element in enabling resolution.
The design and prediction of new cocrystals are typically performed using the concept of supramolecular synthons.24 A common strategy in crystal engineering is to first investigate the crystal structure of the target compound and to evaluate which non-covalent interactions (mostly hydrogen bonding motifs, but also halogen bonds, π–π and van der Waals interactions) could aid in the formation of new supramolecular synthons between the target compound and coformer (e.g. Espinosa-Lara et al.25 and Kuminek et al.7). Although this approach is rational from a chemical point of view and has been shown to be valuable in cocrystal screening protocols, it remains generally impossible to reliably predict cocrystal formation. One of the method's prime shortcomings is its focus on isolated molecular features (i.e. only the presence of functional groups), whose interactions are not necessarily decisive for the resulting molecular architecture. Moreover, subtle factors, such as steric hindrance, packing issues or even experimental difficulties (e.g. mismatch in coformer solubilities), are generally not taken into account. Furthermore, it has been shown that cocrystallization is not governed by the presence of hydrogen and halogen bonds alone,26 again advocating an approach beyond functional group matching.
Because cocrystallization experiments can be laborious and time-intensive, computational techniques based on molecular modelling,26–28 molecular descriptors,29 hydrogen bond propensity30–32 and machine learning33 have been developed to guide the search for new cocrystals. While these approaches have definitely succeeded in broadening the understanding of the principles behind cocrystallization, a major pitfall is their dependence on small subsets of cocrystals. Therefore, the results tend to lack generality and may be biased towards cocrystals of highly popular coformers, such as caffeine or nicotinamide.
In this paper, we introduce a new knowledge-based cocrystal prediction method based on a network of coformers and link-prediction algorithms. In our previous work,34 we have demonstrated how cocrystals in the Cambridge Structural Database35 (CSD) can be transformed into a network of coformers and shown how clusters, a quantification of the so-called popularity bias and the type of aggregation behavior, can be extracted from this network. Here, we combine several techniques from network science and classification to predict new cocrystals based on the information contained in the coformer network. By including all binary cocrystals present in the CSD, we do not constrain the tool to small or possibly biased data sets, but attempt to include as much relational information as possible. The performance of the method is evaluated on the data of the network itself (through cross-validation) and by analyzing the scoring behavior of cocrystals that were added to the CSD in the last 3 years. Predictions of new cocrystals with the highest likelihood of existence are experimentally verified. Finally, we indicate how our prediction method can be used for target compounds not present in the database.
2 Methods
In a recent publication,34 we have shown how the cocrystals in the CSD can be used to build a network G(N,E), formed by a set of nodes N (in this case coformers) and a set of edges or links E between these nodes (representing the cocrystals). A network is commonly represented as a (symmetrical) adjacency matrix A ∈![[Doublestruck R]](https://www.rsc.org/images/entities/i_char_e175.gif) N×N, for which the indices of the rows and columns correspond to the nodes, and for which the elements are labeled as 1 for known node combinations (and as 0 otherwise). For the present research, the network was updated for cocrystals present in the latest version of the CSD (v5.40) by including all organic crystals containing two different residues that were not ionic and not polymeric, with no errors, for which three-dimensional coordinates were determined. In this process, solvates and structures containing gas molecules were excluded by comparing the constituents to two predefined lists of common solvents and gases, respectively (available as part of the ESI†). Although details about the stoichiometry, experimental conditions and polymorphism of a cocrystal are informative, their introduction to the network would preclude the use of the link prediction methods described below. Therefore, this information was not included in the network. The scripts to analyse and use the network were written in Python (v2.7.15).
N×N, for which the indices of the rows and columns correspond to the nodes, and for which the elements are labeled as 1 for known node combinations (and as 0 otherwise). For the present research, the network was updated for cocrystals present in the latest version of the CSD (v5.40) by including all organic crystals containing two different residues that were not ionic and not polymeric, with no errors, for which three-dimensional coordinates were determined. In this process, solvates and structures containing gas molecules were excluded by comparing the constituents to two predefined lists of common solvents and gases, respectively (available as part of the ESI†). Although details about the stoichiometry, experimental conditions and polymorphism of a cocrystal are informative, their introduction to the network would preclude the use of the link prediction methods described below. Therefore, this information was not included in the network. The scripts to analyse and use the network were written in Python (v2.7.15).
While the network is built from existing cocrystals, it may safely be assumed that an abundance of coformer combinations has not yet been experimentally verified and are missing. Such combinations are labeled as 0 in the adjacency matrix, and could in principle be predicted and synthesized. By using the information that is contained in the coformer network, the aim of link prediction is to estimate the likelihood of the existence of these missing cocrystals. This likelihood is expressed as a value or score, calculated from the structural features of the network with parameters derived from the adjacency matrix (rather than from their molecular structure). An important advantage of link prediction is that the methods to score coformer combinations are fairly simple to use and that, in this case, the relevant chemistry and physics of cocrystal formation is implicitly contained in the network itself. Therefore, link prediction has the potential to significantly speed up the development of cocrystal screening protocols, bypassing either local interaction predictions or lengthy calculations. The choice of a scoring method is, however, not trivial, and is selected here on the basis of the network properties and through validation on the known cocrystal data (with cross-validation). The performance of the chosen method was further evaluated by analyzing the time-evolution of the coformer network and by experimentally confirming that new, high-scoring coformer combinations indeed yield new cocrystals.
This section is therefore structured as follows. Several network features, required for scoring coformer couples, are introduced in section 2.1 and the scoring methods themselves are described in section 2.2. Section 2.3 covers the various techniques that were used for validation of the approach.
2.1 Network properties
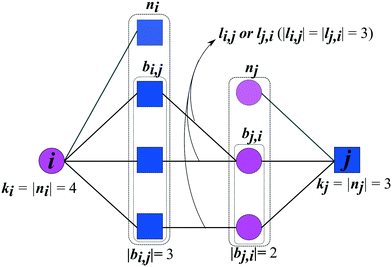
The prediction of new cocrystals is based on the latent information of the coformer network. By translating the local subnetwork lying in between two (unconnected) coformers (Fig. 1) into a set of network structural parameters, measures for the proximity of two coformers can be calculated using various scoring methods. Higher scores are expected to correspond to a higher proximity, i.e. a higher likelihood that the cocrystal actually exists.Fig. 1 schematically shows the structural properties of a given coformer couple that can be derived from the network. Each coformer is characterized by a set of direct neighbors n, equivalent to the set of coformers it has successfully formed cocrystals with. Using the adjacency matrix A, the set of neighbors of coformer i is found as follows:
| ni = {a ∈ N|A(i,a) = 1}. | (1) |
A property derived from n is its cardinality or degree k, defined as
| ki = |ni| | (2) |
The type of the network can be classified as mono- or bipartite. A monopartite network is characterized by a single group of nodes, and combinations between any two nodes are possible (e.g. connections between users in a social network). On the other hand, a bipartite network consists of two separate groups of nodes, and connections appear only between nodes of the different groups. An example of a bipartite network is the network formed by salts: the network consists of a set of cations and anions, and salts can only be formed by combining opposite ions. We have recently analyzed the type of the coformer network34 and have found that it implicitly behaves in a bipartite way. Therefore, the link-prediction methods were selected or adapted to this network type, which requires the formulation of two additional bipartite properties. Originally proposed by Daminelli et al.,36 a combination of nodes (i,j) can be characterized by two sets of bipartite common neighbors, bi,j and bj,i (see Fig. 1), defined as:
| bi,j = {a ∈ ni|∃b ∈ nj ∧ A(a,b) = 1} | (3) |
| bj,i = {a ∈ nj|∃b ∈ ni ∧ A(a,b) = 1} | (4) |
| li,j = {(a, b) ∈ E|a ∈ bi,j, b ∈ bj,i ∧ A(a,b) = 1} | (5) |
2.2 Scoring methods for link prediction
Using the features defined in section 2.1, various methods to score new combinations of nodes have been proposed in the literature (Table 1). Most of these methods were originally formulated for monopartite networks, and were therefore transformed for bipartite networks using the properties introduced above. The scoring methods are based on local information, looking only at the direct periphery of two coformers in the network. Moreover, the calculation of the scores from adjacency matrix A is straightforward and fast, and is possible for any combination of coformers.| Method | Expression |
|---|---|
| Common neighbors index (CN) | s i,j = |bi,j ∪ bj,i| |
| Jaccard index36,37 |

|
| Hub promoted index (HPI)38 |

|
| Hub depressed index (HDI)39 |

|
| Salton index40 |

|
| Sörenson index41 |

|
| Leicht–Holme–Newman index (LHN)42 |

|
| LCL common neighbors index (CN LCL)36 | s i,j = |bi,j ∪ bj,i| × |li,j| |
| Preferential attachment index (PA)43,44 | s i,j = ki × kj |
| Adamic–Adar index (AA)36,45 |

|
| Resource allocation (RA)36,46 |

|
A common approach is to compute the scores for every unconnected pair of nodes and rank them in decreasing order. Coformer combinations with the highest scores are then expected to result in new cocrystals. An alternative approach is to rank the scores for one specific coformer, for instance when screening cocrystals for a specific target compound, such as an API.
2.3 Validation
The capability of the method to repredict the test items is then evaluated by comparing the predicted labels of the test set, determined at a chosen threshold (i.e. an arbitrary score value), to their true labels. Because of the way the network is constructed, it is only possible to certainly know the true labels of existing cocrystals (i.e.A(i,j) = 1). On the other hand, the labels of unknown combinations (A(i,j) = 0) are uncertain, as zeros in the adjacency matrix are more likely to emerge from untested coformer pairs than from unsuccessful cocrystallization experiments, and could therefore represent existing but not yet discovered cocrystals (A(i,j) = 1). The result of the comparison is used to construct a so-called confusion matrix, consisting of four elements (Fig. 2):
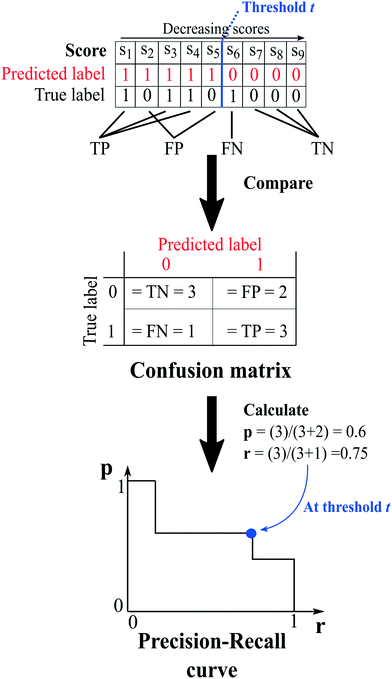 | ||
| Fig. 2 An example illustrating the concept of validation and the calculation of the evaluation metrics. At a certain threshold, the scores of the test set combinations are determined using one of the link-prediction or scoring methods from Table 1 and are ranked in decreasing order (s1 to s9). Combinations for which the score s ≥ t (threshold) are predicted to exist, and vice versa (red labels), and the test set's predicted labels are compared to their true labels, resulting in a confusion matrix. The matrix is used to calculate the precision (eqn (7)) and recall (eqn (6)), and the trio (p, r, t) is added to the precision–recall curve. | ||
1. True positives (TP): the number of positive labels correctly labeled as positive;
2. True negatives (TN): the number of negative labels correctly labeled as negative;
3. False positives (FP): the number of negative labels wrongly labeled as positive;
4. False negatives (FN): the number of positive labels wrongly labeled as negative.
The performance of the scoring method at the chosen threshold is then summarized using the evaluation metrics recall (r) and precision (p), since the reprediction of positive labels is more relevant than that of negative labels:
 | (6) |
 | (7) |
The recall (r) represents the retrieval success or sensitivity for a chosen threshold. The precision (p) is a measure for the relevance of the result and summarizes how many of the positive predictions are actually true. The latter can be understood as a success rate: the score of cocrystal prediction corresponds to a certain precision value, indicating the probability of the coformer combination to actually form a cocrystal.
It is clear that the confusion matrix and its derived evaluation metrics are directly related to the choice of threshold, the value of which will be different for each method from Table 1 and is hard to physically justify. In order to compare the various scoring methods to each other, it is common to use threshold curves, which reveal the method's total performance over the entire score spectrum. In the case of a large class imbalance such as for the link-prediction problem (more unknown than known links), it has been shown that the precision–recall curve and its associated area-under-the-curve metric provide a better overview of performance than the alternative receiver operating characteristic curve (ROC),47 and were therefore chosen to compare the various methods and to select the suitable scoring method for link prediction. By varying the threshold from the lowest to the highest score and computing the precision and recall from the resulting confusion matrix at each threshold, a comprehensive curve is obtained of which the enclosed area-under-the-curve is used as a measure for comparison. Alternatively, the data used to construct the precision–recall curve may be shown as a precision–threshold curve, from which the threshold at a specified precision can be extracted (or vice versa).
3 Results and discussion
3.1 Performance and selection of link-prediction methods
The updated coformer network consists of 7141 coformers, connected through 9141 cocrystals.¶ For each link prediction method in Table 1, 100 validation sets were constructed (10 × 10-fold cross-validation) and evaluated using the above mentioned procedure. Fig. 3(a) shows the precision–recall curve for each scoring method, together with their respective area-under-the-curve (AUC) metrics. The area under the precision–recall curve is a suitable indicator for the performance of a link prediction method:47 a method that occupies a larger area under the curve succeeds better in returning existing cocrystals (TP) over a wider threshold range (i.e. maintaining a high p with increasing r), rather than returning unknown coformer combinations (FP).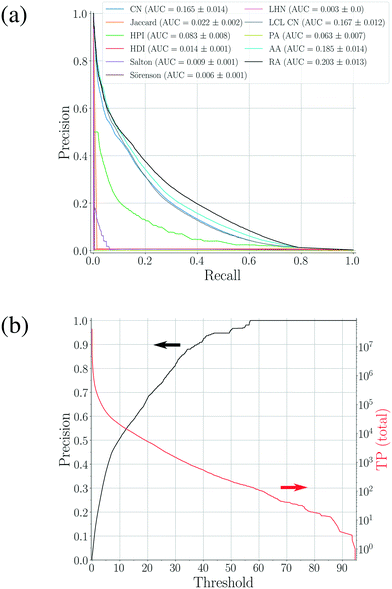 | ||
| Fig. 3 (a) Precision–recall curves for the scoring methods shown in Table 1 constructed using 100 validation sets. The corresponding area-under-the-curve (AUC) metrics are also calculated, resulting in RA as the best performing method. (b) The precision–threshold curve for RA (black, left axis) and the total number of true positives (TP) over all validation runs as a function of the threshold (red, right axis). | ||
The largest value for the AUC is obtained using the bipartite resource allocation scoring method (RA) and is close to the value obtained using the bipartite Adamic–Adar method (AA). This is not surprising, as the degrees k of the coformers in the network vary within a range of two orders of magnitude, and therefore the effect of the logarithm in AA for higher degree neighbors is relatively small, resulting in a similar scoring behavior. From Table 1 and Fig. 1, it is clear that both scoring methods express the score using a measure for the density of the intermediate network between two coformers: only relationships between common neighbors contribute, and neighbors with a more diverse cocrystallization profile are penalized (via the degree k in the denominator). The reason that these methods perform so well can be attributed to the structure of the network itself: a comprehensive analysis34 has shown that existing cocrystals are characterized by the presence of local bipartite communities between them. Hence, methods capable of condensing this structural phenomenon effectively into their score value are expected to perform better. Although other methods such as CN and CN LCL also take properties derived from these local bipartite communities into account, they perform slightly worse than RA and AA, as they appear to miss the crucial formulation of the interlying density. Since the AUC of RA is larger than AA's, RA was selected as the prediction method of choice.
Methods that suppress the score of new combinations with higher coformer degrees, such as the Jaccard, HDI, HPI, Salton, Sörenson and LHN indices, perform much worse. A plausible explanation can again be found in the structure of the network: the degree distribution exhibits linearity in a log–log graph and can be fitted with a power law. A peculiar feature of power-law distributed networks is their dependence on nodes with larger degrees for their internal structure, which also plays a crucial role in their evolution. It is interesting to note that the numerator of these methods is equivalent to that of the CN scoring method (except for LHN where it is doubled), which, on its own, does show moderate prediction performance. Thus, scoring methods that penalize nodes for their degree cannot describe the network's underlying structure, and are therefore not suitable to predict new cocrystals.
Simply combining any node with higher degree nodes, leading to an unorganized collection of cocrystals as proposed by the preferential attachment index (PA) also does not lead to a satisfactory performance. Additionally, repeating a similar validation procedure with monopartite expressions for the score indices in Table 1 (for example by replacing |bi,j ∪ bj,i| with |ni ∩ nj|) did also not result in any good validation results. Therefore, while the network may contain an inherent bias towards high degree coformers due to its power-law degree distribution, it is still a coherent and bipartitely organized structure. This bipartiteness again stresses the importance of complementarity for the design of cocrystals, whether it is through hetero- or homosynthons (i.e. combining different or identical functional groups, respectively), and was successfully included in and confirmed by the selected link prediction method.
As shown in Fig. 3(a), the overall area under the precision-recall curve is generally low. Because the coformer network is built only with successful cocrystallization attempts in the CSD and does not include information on failures, it is impossible to distinguish whether an unknown combination (A(i,j) = 0) is truly non-existing or was in fact never experimentally verified. The correct number of false positives is therefore debatable, and the values of the precision values disclosed here should be seen as absolute lower limits for their actual values. The same combination of coformers may be assigned a different score value depending on the scoring method, and undiscovered cocrystals (or missing links) would therefore not always contribute to the number of false positives in a comparable way for a certain threshold. Yet, the precision–recall curves remain an adequate comparison method: the entire score spectrum of each scoring method is evaluated and normalized, accounting for the presence of missing links. We will show later that the coformer network is indeed heavily unsaturated, and many predicted combinations of coformers turn out to yield new cocrystals.
3.2 Scoring characteristics of the coformer network of 2016
![[thin space (1/6-em)]](https://www.rsc.org/images/entities/char_2009.gif) 865
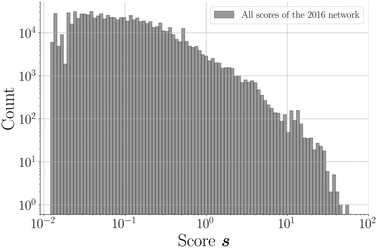
865![[thin space (1/6-em)]](https://www.rsc.org/images/entities/char_2009.gif) 788; 96.2%) of unknown node pairs in the network obtain a score value of 0. Note that many combinations are “forbidden” since they are not bipartitely related, which results in a score value of 0. For the remaining couples (817
788; 96.2%) of unknown node pairs in the network obtain a score value of 0. Note that many combinations are “forbidden” since they are not bipartitely related, which results in a score value of 0. For the remaining couples (817![[thin space (1/6-em)]](https://www.rsc.org/images/entities/char_2009.gif) 369; 3.8%), the scores demonstrate a declining distribution on a log scale (Fig. 4). The scores of a relatively small group of combinations are significantly higher than the rest of the distribution, which seems to be a direct consequence of the network's power law degree distribution. Most coformers are generally connected to only one or a few highly popular coformers (or hubs), and new edges between these abundant but unpopular coformers tend to result in a non-zero yet small score value. The precision associated with such low scores is close to zero, and the probability of these combinations to exist is therefore small. On the other hand, some couples exist for which the score is much higher. This is possible for combinations of nodes that have already cocrystallized with at least one hub, as new cocrystals with coformers present in the same or related clusters as the hub (see the study of Devogelaer et al.34) will be predicted with high score and precision values. Since the tendency to form cocrystals for coformers in the same cluster is similar, the probability that the high scoring coformer combinations indeed exist is expected to be high. The highest scores are found for combinations of complementary hubs: the cocrystallization profile of both coformers is so well-defined that many interlying paths may contribute to the score value, reliably suggesting new cocrystals (high p).
369; 3.8%), the scores demonstrate a declining distribution on a log scale (Fig. 4). The scores of a relatively small group of combinations are significantly higher than the rest of the distribution, which seems to be a direct consequence of the network's power law degree distribution. Most coformers are generally connected to only one or a few highly popular coformers (or hubs), and new edges between these abundant but unpopular coformers tend to result in a non-zero yet small score value. The precision associated with such low scores is close to zero, and the probability of these combinations to exist is therefore small. On the other hand, some couples exist for which the score is much higher. This is possible for combinations of nodes that have already cocrystallized with at least one hub, as new cocrystals with coformers present in the same or related clusters as the hub (see the study of Devogelaer et al.34) will be predicted with high score and precision values. Since the tendency to form cocrystals for coformers in the same cluster is similar, the probability that the high scoring coformer combinations indeed exist is expected to be high. The highest scores are found for combinations of complementary hubs: the cocrystallization profile of both coformers is so well-defined that many interlying paths may contribute to the score value, reliably suggesting new cocrystals (high p).
3.3 Prediction of missing-link cocrystals
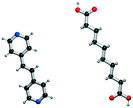
While the analyses above elucidate which link prediction method performs best on the network's structure and how the coformer network responds to such a scoring method (by assessing historically added cocrystals), it remains unclear whether it actually excels at predicting new cocrystals. Therefore, the performance of the method was experimentally validated using the coformer network of the current version of the CSD (v5.40, 2019).Table 2 summarizes the top-ten cocrystal predictions, scoring highest for the RA method.|| These predictions correspond to a validated precision of 95% or higher (see Fig. 3(b)), making the corresponding cocrystals very likely to exist. A recurring feature in these coformer pairs is their hydrogen bonding complementarity, combining coformers containing hydrogen bond donor functional groups (mostly carboxylic acid groups, but also alcohols) with coformers having hydrogen bond acceptor properties (pyridine rings). The link prediction method also recognizes combinations where the strongly favored carboxylic acid⋯pyridine and hydroxyl⋯pyridine synthons emerge,48 and ranks them among the most likely new cocrystals. Hence, from a supramolecular synthon point of view, it can be anticipated that these cocrystals are possible. Additionally, an aromatic group is present in half of the donor coformers, which implies that multiple types of intermolecular interactions will possibly co-exist in the final cocrystal structure of these coformers.
All the coformer couples shown in Table 2 were combined using equimolar amounts and ten new successful combinations were discovered (more details in the ESI†) with relative ease.** It is interesting to note that while all the coformers used in the experiments are either weak bases or acids, for some of the structures, the proton is not completely assigned to the carboxylic acid groups (e.g.7 and 9), making their classification as cocrystals not entirely correct. Moreover, the proton transfer for structure 5 is complete, hence indicating a salt. It may have been anticipated that some of the coformer combinations in the network actually fall into the salt–cocrystal continuum and that the coformer network does not solely contain information about possible cocrystals, but also about (serendipitous) salts. Besides the strength of the respective acid and base, the extent to which the proton is transferred is also dependent on the crystal packing,49 as a polymorph of the same combination of coformers may adopt a different protonation state. Therefore, the occurrence of salts in the top ten predictions of cocrystals is not completely unexpected. Besides salt formation, a cocrystal dihydrate and salt dihydrate were synthesized during the cocrystal screening (see the ESI†). However, water-free structures were obtained by changing the experimental conditions.
With the right analysis of the network's structure, a bipartite link prediction algorithm such as RA can complement the commonly used synthon approach. Additionally, it can extract rules from the network unknown or unclear to experimentalists, which may be decisive for the successful formation of cocrystals (e.g. matching of solubilities in the solvent, feasible interaction patterns, and the absence of steric hindrance). The cocrystals synthesized here are in fact missing links: their cocrystal formation profile is so well-defined (i.e. large k) that combining them may seem obvious in view of the internal bias of the network. Their determination is nonetheless the first step towards the experimental validation of the method. Further validation can be obtained by testing the prediction method for individual coformers, and one should realize that the prediction values are heavily underestimated. We are currently performing such experiments, and the results will be the subject of a subsequent paper.
3.4 Application of link prediction to coformers not present in the CSD
It seems that a shortcoming of the link prediction method is that it appears to be restricted to coformers that are already present in cocrystals in the CSD. This would, for instance for APIs in development, cause the approach to be useless, as neither the APIs nor any of their cocrystalline forms are present in the database. The network can, however, be extended at any point with new compounds, which is equivalent to simply adding an additional row and column to the adjacency matrix A containing cocrystals determined in-house, labeled as 1. One of the two coformers present in these added cocrystals may already be present in the coformer network (which is the case for most GRAS compounds) and their tendency to form cocrystals may be extensively recorded. Hence, by combining the in-house information with the entire CSD coformer network, the link-prediction method may quite accurately predict new combinations for the target compound (i.e. high p).A possible example is (RS)-ibuprofen, a non-steroidal anti-inflammatory drug, of which the structures of six cocrystals are present in the CSD. If one would assume that this API is not present in the database, then plugging the cocrystal information into the network yields several useful cocrystal candidates (Fig. 6), as the other coformers present in ibuprofen cocrystals are present in the database. For instance, the highest scoring combination with 1,2-di(4-pyridyl)ethylene (structure p1) corresponds to a precision of 89%. Its structure was in fact already determined by Elacqua18 but was not included in the CSD and is therefore part of the predicted combinations. The prediction with caffeine (structure p2, p = 50%) is also reasonable, as ibuprofen's known neighbors nicotinamide and isonicotinamide (n3 and n4) were found to exhibit a similar tendency to form cocrystals as caffeine (i.e. they are present in the same coformer cluster).34
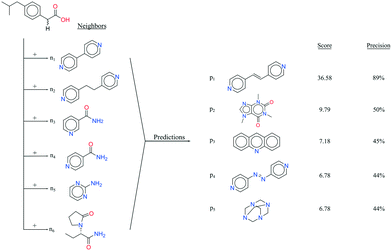 | ||
| Fig. 6 RS-Ibuprofen, the coformers it forms cocrystals with (neighbors n) and the five new combinations that are scored highest using the RA method (predictions p). | ||
It is thus clear that information of only a limited number of cocrystals can be sufficient to obtain new valuable coformer combinations. With the emergence of new connections, the adjacency matrix may be updated and whole new classes (or clusters) of coformers could be addressed by the scoring method, guiding the cocrystal screening process towards new combinations that might not have been considered otherwise.
A prerequisite of the network approach is the information of at least one cocrystal, either present in the CSD or determined elsewhere. When this is not the case, it is advised to set up a cocrystal screening method that uses information from the network (as described in the study of Devogelaer et al.34). For instance, by selecting a single coformer from each cluster, the initial screen attempts to include as much structural variation amongst the coformers as possible, thus preventing it to be biased towards one cluster or class of compounds. The discovery of one or several hits can then be followed up by our link-prediction approach described above. Alternatively, the target compound can be mapped onto the network by comparing its chemical fingerprint to those of known coformers through for instance the Tanimoto similarity measure.50 Coformers similar to the target compound are presumed to exhibit a similar tendency for cocrystal formation, and coformers present in cocrystals with these similar compounds are consequently chosen for screening. Such an approach lies, however, outside of the scope of this article.
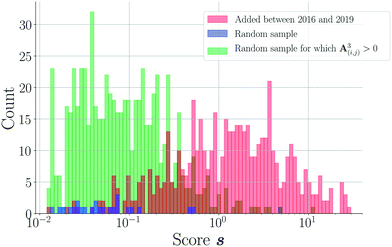
4 Conclusions
The development of a knowledge-based cocrystal prediction method based on the information contained in the Cambridge Structural Database is introduced. After cross-validation, the bipartite resource allocation scoring index was chosen as the most suitable link-prediction method out of an exhaustive list of local scoring methods. Testing its performance on a hypothetical coformer network of 2016 demonstrated that the cocrystals added to the database generally consist of at least one popular coformer (i.e. hub in the network). The score spectrum of the coformer network spans about four orders of magnitude, and the cocrystals recently added to the CSD are situated in the upper part of the distribution and can be considered as “missing links” in the network. The use of the link-prediction method could therefore more or less repredict what researchers have mainly been doing so far. The method has the possibility to be automated and updated regularly, and can return a probability for experimental success. The link-prediction method was experimentally validated for its top ten predictions, all resulting in new (co)crystal structures. Finally, we have indicated how our data-driven method can be applied to molecules not present in the CSD. With the addition of more cocrystals to the CSD, the performance of our method will only improve. Therefore, we envisage it to be a valuable addition to the set of cocrystal prediction tools, complementing more common methods such as the supramolecular synthon approach.Funding information
This research received funding as part of the CORE ITN Project by the European Union's Horizon 2020 Research and Innovation Program under the Marie Skłodowska-Curie Grant Agreement No. 722456 CORE ITN.Conflicts of interest
There are no conflicts to declare.Acknowledgements
We kindly thank Dr. Martin Lutz of Utrecht University for the help with the initial structure interpretation of cocrystal 6. We also thank Anne Ottenbros, Kim van de Ven, Giuseppe Belletti and Dr. Ton Engwerda for their contribution to the cocrystallization experiments.References
- D. J. Berry and J. W. Steed, Adv. Drug Delivery Rev., 2017, 117, 3–24 CrossRef CAS PubMed
.
- E. Nauha and M. Nissinen, J. Mol. Struct., 2011, 1006, 566–569 CrossRef CAS
.
- D.-K. Bučar, S. Filip, M. Arhangelskis, G. O. Lloyd and W. Jones, CrystEngComm, 2013, 15, 6289–6291 RSC
.
- J. Aaltonen, M. Allesø, S. Mirza, V. Koradia, K. C. Gordon and J. Rantanen, Eur. J. Pharm. Biopharm., 2009, 71, 23–37 CrossRef CAS PubMed
.
- A. D. Bond, CrystEngComm, 2007, 9, 833–834 RSC
.
- E. Grothe, H. Meekes, E. Vlieg, J. ter Horst and R. de Gelder, Cryst. Growth Des., 2016, 16, 3237–3243 CrossRef CAS
.
- G. Kuminek, F. Cao, A. B. de Oliveira da Rocha, S. G. Cardoso and N. Rodríguez-Hornedo, Adv. Drug Delivery Rev., 2016, 101, 143–166 CrossRef CAS PubMed
.
- M. Karimi-Jafari, L. Padrela, G. M. Walker and D. M. Croker, Cryst. Growth Des., 2018, 18, 6370–6387 CrossRef CAS
.
-
U.S. Food & Drug Administration (FDA), Regulatory Classification of Pharmaceutical Co-Crystals; Guidance for Industry; Availability, https://www.federalregister.gov/d/2018-03133 (Accessed 2019-04-18) Search PubMed
.
- O. N. Kavanagh, D. M. Croker, G. M. Walker and M. J. Zaworotko, Drug Discovery Today, 2019, 24, 796–804 CrossRef CAS PubMed
.
- A. Calcaterra and I. D'Acquarica, J. Pharm. Biomed. Anal., 2018, 147, 323–340 CrossRef CAS PubMed
.
-
J. Jacques, A. Collet and S. H. Wilen, Enantiomers, racemates, and resolutions, Krieger Pub. Co., 1994 Search PubMed
.
- W. Noorduin, E. Vlieg, R. Kellogg and B. Kaptein, Angew. Chem., Int. Ed., 2009, 48, 9600–9606 CrossRef CAS PubMed
.
- K. Suwannasang, A. E. Flood, C. Rougeot and G. Coquerel, Cryst. Growth Des., 2013, 13, 3498–3504 CrossRef CAS
.
- H. Lorenz and A. Seidel-Morgenstern, Angew. Chem., Int. Ed., 2014, 53, 1218–1250 CrossRef CAS
.
- L.-C. Sögütoglu, R. R. E. Steendam, H. Meekes, E. Vlieg and F. P. J. T. Rutjes, Chem. Soc. Rev., 2015, 44, 6723–6732 RSC
.
- K. Suwannasang, A. E. Flood, C. Rougeot and G. Coquerel, Org. Process Res. Dev., 2017, 21, 623–630 CrossRef CAS
.
-
E. Elacqua, Ph.D. thesis, University of Iowa, 2012 Search PubMed
.
- C. Neurohr, M. Marchivie, S. Lecomte, Y. Cartigny, N. Couvrat, M. Sanselme and P. Subra-Paternault, Cryst. Growth Des., 2015, 15, 4616–4626 CrossRef CAS
.
-
O. F. Villamil, Master thesis, Delft University of Technology, The Netherlands, 2016 Search PubMed
.
- O. Almarsson and M. J. Zaworotko, Chem. Commun., 2004, 1889–1896 RSC
.
- B. Harmsen and T. Leyssens, Cryst. Growth Des., 2018, 18, 3654–3660 CrossRef CAS
.
- B. Harmsen and T. Leyssens, Cryst. Growth Des., 2018, 18, 441–448 CrossRef CAS
.
- G. R. Desiraju, Prog. Solid State Chem., 1987, 17, 295–353 CrossRef CAS
.
- J. C. Espinosa-Lara, D. Guzman-Villanueva, J. I. Arenas-García, D. Herrera-Ruiz, J. Rivera-Islas, P. Román-Bravo, H. Morales-Rojas and H. Höpfl, Cryst. Growth Des., 2013, 13, 169–185 CrossRef CAS
.
- C. R. Taylor and G. M. Day, Cryst. Growth Des., 2018, 18, 892–904 CrossRef CAS PubMed
.
- N. Issa, P. G. Karamertzanis, G. W. A. Welch and S. L. Price, Cryst. Growth Des., 2009, 9, 442–453 CrossRef CAS
.
- P. G. Karamertzanis, A. V. Kazantsev, N. Issa, G. W. Welch, C. S. Adjiman, C. C. Pantelides and S. L. Price, J. Chem. Theory Comput., 2009, 5, 1432–1448 CrossRef CAS
.
- L. Fábián, Cryst. Growth Des., 2009, 9, 1436–1443 CrossRef
.
- P. T. A. Galek, L. Fábián, W. D. S. Motherwell, F. H. Allen and N. Feeder, Acta Crystallogr., Sect. B: Struct. Sci., 2007, 63, 768–782 CrossRef CAS PubMed
.
- P. A. Wood, N. Feeder, M. Furlow, P. T. A. Galek, C. R. Groom and E. Pidcock, CrystEngComm, 2014, 16, 5839–5848 RSC
.
- A. Delori, P. T. A. Galek, E. Pidcock, M. Patni and W. Jones, CrystEngComm, 2013, 15, 2916–2928 RSC
.
- J. G. P. Wicker, L. M. Crowley, O. Robshaw, E. J. Little, S. P. Stokes, R. I. Cooper and S. E. Lawrence, CrystEngComm, 2017, 19, 5336–5340 RSC
.
- J.-J. Devogelaer, H. Meekes, E. Vlieg and R. de Gelder, Acta Crystallogr., Sect. B: Struct. Sci., Cryst. Eng. Mater., 2019, 75, 371–383 CrossRef CAS
.
- C. R. Groom, I. J. Bruno, M. P. Lightfoot and S. C. Ward, Acta Crystallogr., Sect. B: Struct. Sci., Cryst. Eng. Mater., 2016, 72, 171–179 CrossRef CAS PubMed
.
- S. Daminelli, J. M. Thomas, C. Durán and C. V. Cannistraci, New J. Phys., 2015, 17, 113037 CrossRef
.
- P. Jaccard, New Phytol., 1912, 11, 37–50 CrossRef
.
- E. Ravasz, A. L. Somera, D. A. Mongru, Z. N. Oltvai and A.-L. Barabási, Science, 2002, 297, 1551–1555 CrossRef CAS PubMed
.
- L. Lü and T. Zhou, Phys. A, 2011, 390, 1150–1170 CrossRef
.
-
G. Salton and M. J. McGill, Introduction to Modern Information Retrieval, McGraw-Hill, Inc., New York, NY, USA, 1986 Search PubMed
.
-
T. J. Sörensen, A method of establishing groups of equal amplitude in plant sociology based on similarity of species content and its application to analyses of the vegetation on Danish commons, I kommission hos E. Munksgaard, København, 1948 Search PubMed
.
- E. A. Leicht, P. Holme and M. E. J. Newman, Phys. Rev. E, 2006, 73, 026120 CrossRef CAS PubMed
.
- A.-L. Barabási and R. Albert, Science, 1999, 286, 509–512 CrossRef PubMed
.
- R. Albert and A.-L. Barabasi, Rev. Mod. Phys., 2002, 74, 47–97 CrossRef
.
- L. A. Adamic and E. Adar, Soc. Netw., 2003, 25, 211–230 CrossRef
.
- T. Zhou, L. Lü and Y.-C. Zhang, Eur. Phys. J. B, 2009, 71, 623–630 CrossRef CAS
.
- Y. Yang, R. N. Lichtenwalter and N. V. Chawla, Knowl. Inf. Syst., 2015, 45, 751–782 CrossRef
.
- J. A. Bis, P. Vishweshwar, D. Weyna and M. J. Zaworotko, Mol. Pharmaceutics, 2007, 4, 401–416 CrossRef CAS
.
- S. L. Childs, G. P. Stahly and A. Park, Mol. Pharmaceutics, 2007, 4, 323–338 CrossRef CAS PubMed
.
- D. Bajusz, A. Ráz and K. Héberger, J. Cheminf., 2015, 7, 20 Search PubMed
.
Footnotes |
| † Electronic supplementary information (ESI) available: Overview of the starting materials, experimental details of the synthesis of the cocrystals (S1) and their crystallographic data (S2), the scoring method's top 100 predictions (S3) and predefined lists of solvents and gases used for cocrystal classification (S4). CCDC 1940949–1940959. For ESI and crystallographic data in CIF or other electronic format see DOI: 10.1039/c9ce01110b |
| ‡ Generally recognized as safe. |
| § This is when crystallization of a racemic mixture results in crystals that separately contain only right- or left-handed enantiomers. Unfortunately, this behavior is more rare than racemic compound formation, where both enantiomers reside in the same crystal lattice.12 |
| ¶ Due to several improvements made to our classifier algorithm (including a better neutrality check) described in the study of Devogelaer et al.,34 this number is slightly different from our earlier work. |
| || The scoring method's top 100 predictions can be found in the ESI.† |
| ** Except for structures 1 and 5, crystals suitable for single-crystal X-ray diffraction were obtained by simply dissolving the equimolar mixture in a single solvent, which was subsequently evaporated. Resulting in adequate single crystals, the structure of cocrystal 6 is modulated and will be the topic of a future publication. |
| This journal is © The Royal Society of Chemistry 2019 |

