Synthesis of a WO3 photocatalyst with high photocatalytic activity and stability using synergetic internal Fe3+ doping and superficial Pt loading for ethylene degradation under visible-light irradiation†
Xiaolei
Liu‡
a,
Huishan
Zhai‡
a,
Peng
Wang
 a,
Qianqian
Zhang
*a,
Zeyan
Wang
 a,
Yuanyuan
Liu
a,
Ying
Dai
b,
Baibiao
Huang
a,
Yuanyuan
Liu
a,
Ying
Dai
b,
Baibiao
Huang
 *a,
Xiaoyan
Qin
a and
Xiaoyang
Zhang
a
aState key lab of crystal materials, Shandong University, Jinan, 250100, China. E-mail: qianqianzhang@sdu.edu.cn; bbhuang@sdu.edu.cn
bSchool of physics, Shandong University, Jinan, 250100, China
First published on 20th December 2018
Abstract
Ethylene (C2H4) is harmful for storage and fresh-keeping of fruits and vegetables. Photocatalytic technology is an effective and environmentally friendly approach for degrading ethylene. Herein, we first report the synthesis of a WO3 photocatalyst with high photocatalytic activity and stability using synergetic internal Fe3+ doping and superficial Pt loading for ethylene degradation under visible-light irradiation. Internal Fe3+ doping not only enhances the visible-light absorption but also improves the stability to some degree due to more positive reduction potential of Fe3+/Fe2+ than that of W6+/W5+ and separation efficiency of the photo-generated carriers. Furthermore, the loading of Pt as a co-catalyst through the photo-reduction of H2PtCl6 on the surface of Fe-doped WO3 promotes the effective transfer of photo-generated electrons and reduces the photo-corrosion of WO3. Due to the synergistic effect, extremely high degradation speed can be achieved by doping 0.25 mol% Fe and loading 0.75 wt% Pt for WO3, which exceeds that of pristine WO3 by about 3.3 times under visible-light irradiation. In addition, due to the excellent stability of Pt@Fe-doped WO3, it has good industrial application prospects in the field of photocatalysis.
1. Introduction
Ethylene (C2H4) as a plant hormone has numerous effects on the growth, development and storage of fruits and vegetables.1 During the process of growth, ethylene plays a useful role in promoting the ripening of fruits and vegetables. However, after harvesting of fruits and vegetables, ethylene can be constantly produced through respiration, which can accelerate the senescence of fruits and vegetables and is harmful for their storage and fresh-keeping.2 Therefore, it is important to remove ethylene in the storage environment. Photocatalytic technology is considered as an effective and environmentally friendly approach to degrade ethylene molecules into CO2 and H2O through photocatalytic oxidation.3 However, due to the nonpolar nature and high bond energy of ethylene molecules, they cannot be degraded easily.4 Thus, it is a great challenge to find and design efficient photocatalysts for use in photocatalytic ethylene degradation.With respect to the photocatalytic degradation of ethylene, titanium dioxide has been proven to be the most important photocatalyst due to its high activity, long-term stability, low toxicity and low cost.5,6 However, it can only respond to the ultraviolet light, which only accounts for 5% of the solar spectrum, due to its intrinsic wide band gap of about 3.2 eV.7 To make good use of sunlight, semiconductor photocatalysts should have good visible-light absorption. WO3 has a smaller band gap (2.5–2.8 eV) than TiO2 (3.2 eV) and has many inherent advantages such as low cost, nontoxicity and high oxidation power of valence band holes.8,9 In recent years, WO3 has been studied as a photocatalyst in many applications such as the degradation of organic dyes, water splitting, and reduction of CO2.10–17 Due to the requirement of high selectivity of photocatalysts for ethylene degradation, only some specific photocatalysts can be used to degrade ethylene. As far as we know, there has been no report on the photocatalytic ethylene degradation using WO3 as the photocatalyst. Although the use of WO3 has many advantages, there are still some drawbacks, which seriously restrict its performance. The first is the limited visible-light absorption; to solve this problem, doping metals is considered as a good strategy, and these metals include Ti, Cu, Mo and Fe.18–21 The second is that WO3 is easily photo-corroded due to self-reduction of W6+, which is disadvantageous for photocatalytic activity.
In this study, we first report the synthesis of a WO3 photocatalyst with high photocatalytic activity and stability using synergetic internal Fe3+ doping and superficial Pt loading for ethylene degradation under visible-light irradiation. The optimal calcination temperature for WO2.72 to produce WO3, the optimal doping amount of Fe3+ and loading amount of Pt are studied in our experiment systematically. Internal Fe3+ doping not only enhances the visible-light absorption but also promotes the stability to some degree due to more positive reduction potential of Fe3+/Fe2+ than that of W6+/W5+. During the photocatalytic reaction, the photo-generated electrons are more easily captured by Fe3+ and are converted to Fe2+, which can avoid the photo-corrosion of WO3 effectively and promote the separation of photo-generated carriers. Furthermore, the loading of Pt as a co-catalyst through the photo-reduction of H2PtCl6 on the surface of Fe-doped WO3 promotes the effective transfer of photo-generated electrons and reduces the photo-corrosion of WO3. The synergistic effect of internal Fe3+ doping and superficial Pt loading can realize the best photocatalytic activity for the degradation of ethylene under visible-light irradiation. The synergetic mechanism can be expressed clearly using a metaphor: the photo-generated electrons are water, the internal doping of Fe3+ can be represented by a water reservoir and superficial Pt co-catalyst functions as a water pump. Thus, the photo-generated electrons and holes can be separated efficiently. After a certain time, the water reservoir should be released. Calcination is an effective way to convert Fe2+ back to Fe3+; thus, the photocatalyst can realize excellent recyclability. The effective synergistic effect can provide a good model for other photocatalytic systems.
2. Experimental
2.1 Material synthesis
2.2 Material characterization
XRD was characterized on a Bruker AXS D8 diffractometer equipped with Cu Kα excitation. UV-vis DRS of the products was conducted using a Shimadzu UV 2550 spectrophotometer equipped with an integrating sphere. Morphology was observed by a field emission scanning electron microscope (SEM) (Hitachi S-4800) equipped with an energy dispersive spectrometer (EDS). XPS measurements were obtained using a Thermo Fisher Scientific Escalab 250 spectrometer, and the peak positions of various elements were calibrated by C 1s (284.8 eV). The PL curves using 350 nm as the excitation wavelength were surveyed by a Hitachi F-4500 fluorescence spectrophotometer. Photoelectrochemical measurements with a three-electrode system were conducted using a Princeton Applied Research EG&G 263A electrochemical workstation. The platinum sheet served as the counter electrode; Ag/AgCl served as the reference electrode, and catalyst-covered FTO glass served as the working electrode. The electrolyte solution was 0.5 M Na2SO4. A 300 W Xe-arc lamp equipped with an AM 1.5 cut-off filter was used as the light source.2.3 Photocatalytic test
The photocatalytic ethylene degradation experiment was carried out in a special reactor with a volume of 320 mL; 0.4 g of photocatalyst was sprinkled uniformly at the bottom of the reactor, and the reactor was sealed by a silicone rubber stopper. Then, 0.4 mL of high-purity ethylene gas was injected into the reactor, and the reaction temperature of the system was maintained at 15 °C with cooling water. The initial concentration of ethylene (C2H4) was 1250 ppm. A 300 W Xe lamp with a 420 nm cut-off filter was used to provide the visible light. Prior to irradiation, the system was magnetically stirred in the dark for 2 h to establish an adsorption–desorption equilibrium of the gas with the samples. When a balance was reached, the photocatalytic test began. First, 60 μL of the gas mixture was sampled from the reaction system at a certain time interval and was analyzed by an online gas chromatograph (Shimadzu GC-2014C) equipped with a thermal conductivity detector (TCD). A blank test was also conducted without photocatalyst to prove that the degradation of ethylene was entirely caused by the photocatalytic reaction. The degradation percentage is expressed as C/C0, where C0 is the initial concentration of ethylene and C represents the corresponding concentration at a certain sampling time. The stability was tested as follows: after each ethylene oxidation reaction, the photocatalyst was collected and calcined at 450 °C for 0.5 hours to remove possible residuary organics. Then, the regenerated product was employed to conduct another round of ethylene degradation test under the same conditions.3. Results and discussion
3.1 X-ray diffraction study of the samples
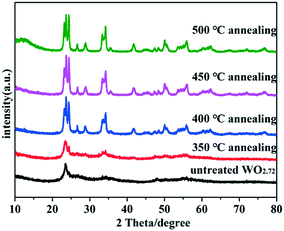
The crystallographic structures of the samples were characterized by X-ray diffraction (XRD). The XRD spectra of untreated WO2.72 and WO2.72 calcined at different temperatures are shown in Fig. 1. As can be seen, the crystallinity of all products improved after calcination. The diffraction peaks gradually transformed from WO2.72 (JCPDS no. 36-101) to WO3 (JCPDS no. 43-1035) with increase in calcination temperature. When the calcination temperature reached 400 °C, the sample entirely transformed into WO3. Therefore, the calcination temperature is a very important factor for the formation of WO3 from WO2.72.As shown in Fig. 2a, after calcination at 450 °C, all the diffraction peaks of the as-prepared samples are nearly similar to that of pure WO3. With the increase in Fe content, no apparent diffraction peaks of iron oxides or other impurity phases can be detected, illustrating that Fe3+ ions were doped into the crystal lattice of WO3.21 However, from the enlarged peaks in Fig. 2b, we infer that the peaks in the Fe-doped products display apparent shifts compared to that of original WO3. With the increase in Fe content, the diffraction peaks gradually shifted to a small angle. Because the radius of Fe3+ (0.64 Å) is larger than the radius of W6+ (0.62 Å), slight lattice distortion of WO3 was observed. According to the Bragg's law, the diffraction angle will become smaller due to larger lattice spacing, which can explain the result of the peak offset. This phenomenon further indicates that the Fe3+ ions were doped into the crystal lattice of WO3 successfully. Moreover, the XRD peaks of 0.75 wt% Pt@0.25 mol% Fe–WO3 were similar to those of 0.25 mol% Fe–WO3, and no clear peaks of Pt were detected, which might be caused by the low amount and high dispersion of Pt nanoparticles.
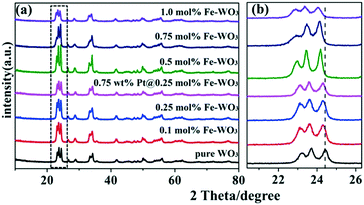 | ||
| Fig. 2 The XRD spectra (a) and the enlarged XRD spectra (b) of the pure WO3, Fe-doped WO3 and Pt@Fe–WO3 samples. | ||
3.2 UV-vis spectroscopy
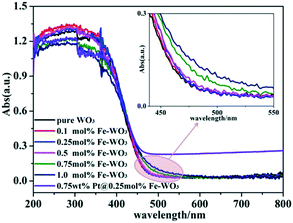
The UV-vis diffuse reflectance spectra of bare WO3, Fe-doped WO3 and Pt@Fe–WO3 samples are shown in Fig. 3. As can be seen, bare WO3 displays a sharp absorption edge at around 470 nm and a corresponding band gap energy of about 2.64 eV, which is consistent with previous results (2.5–2.8 eV).8 All products exhibited absorption in both UV and visible-light regions. Due to the low doping amount of Fe3+, the absorption edge only has a small red shift. Based on the enlarged view inserted in Fig. 3, we observe that the red shift of the absorption increases gradually with the increase in Fe3+ doping from 0.1 to 1.0%. The enhanced visible-light absorption of Fe-doped WO3 is beneficial for the photocatalytic reaction, and it also confirms that Fe3+ was indeed doped into the lattice of WO3. After photo-reduction of H2PtCl6, the light absorption increased in the 500–800 nm region, which was ascribed to the loading of Pt nanoparticles on the surface.3.3 Morphology and structure of nanostructures
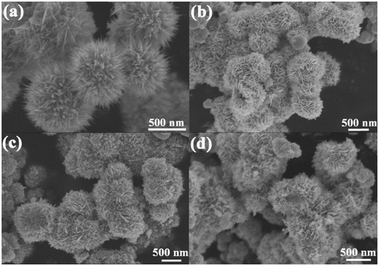
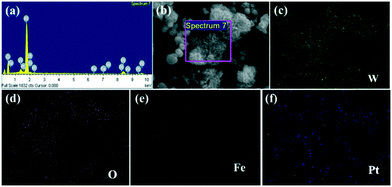
The morphologies of the obtained samples were studied by SEM (Fig. 4). It can be observed that the WO2.72 product possesses uniform urchin-like hierarchical structures with sizes ranging from 600 to 800 nm (Fig. 4a), which is consistent with the results from a previous report.22 The morphology of the as-synthesized urchin-like WO2.72 architectures calcined at 450 °C is shown in Fig. 4b. After calcination, the original urchin-like hierarchical structures transformed into hierarchical microspheres consisting of nanoflakes due to recrystallization. The detailed morphologies of the as-synthesized urchin-like WO2.72 architectures calcined at different temperatures are shown in Fig. S1.† As the temperature increased, the transformation process started gradually and the thickness of the nanoflakes increased. Combined with the result of XRD, we infer that the urchin-like WO2.72 has been completely converted to WO3 at 400 °C. As shown in Fig. 4c, the morphology of 0.25 mol% Fe-doped WO3 is also composed of nanosheet arrays but with slight disorder compared with the morphology of un-doped WO3. In addition, it should be noted that 0.75 wt% Pt@0.25 mol% Fe–WO3 exhibits no significant morphological change after 9 time consecutive photocatalytic degradation experiments (Fig. 4d), indicating that the loading of Pt by photo-reduction and calcination at 450 °C for 0.5 h after every cycle experiment have almost no influence on the morphology.Fig. 5 displays the EDS and mapping analysis of the 0.75 wt% Pt@0.25 mol% Fe–WO3 sample. In Fig. 5a, W, O, Fe and Pt can be detected by the EDS measurements. To intuitively observe the elemental distribution, EDS mapping was carried out. The detailed results can be seen in Fig. 5b–f. These results further prove the successful Fe doping and Pt loading in the WO3 system.
3.4 X-ray photoelectron spectroscopy study
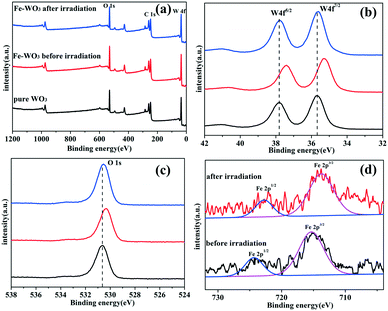
To assess the surface chemical status of Fe-doped WO3 before and after irradiation, X-ray photoelectron spectroscopy (XPS) was carried out. Fig. 6a shows the full XPS spectra of bare WO3 and Fe-doped WO3 before and after irradiation; the corresponding peaks of O 1s, C 1s and W 4f can be observed clearly. The peak of C 1s located at 284.8 eV is used to calibrate the peak positions. Due to the small doping amount of Fe, the XPS peak of Fe3+ 2p cannot be easily seen in Fig. 6a. From Fig. 6b and c, we can see that the peaks of W 4f (35.28 eV for W 4f7/2 and 37.4 eV for W 4f5/2) and O 1s (530.3 eV) for Fe-doped WO3 before irradiation exhibit a slightly negative shift relative to the peaks of W 4f (35.8 eV for W 4f7/2 and 37.9 eV for W 4f5/2) and O 1s (530.64 eV) for un-doped WO3. From the high-resolution Fe3+ 2p spectrum (Fig. 6d), we observe that the two small peaks located at 715.35 eV and 724.86 eV, corresponding to Fe 2p3/2 and Fe 2p1/2, exhibit slightly positive shifts compared to that of Fe2O3 reported previously (710.7 eV for Fe 2p3/2 and 724.3 eV for Fe 2p1/2).23 The shift of the peaks in the XPS spectrum is due to different electronegativities of W and Fe; the electronegativity of W is relatively smaller than that of Fe.24,25 When Fe3+ is doped into WO3, Fe3+ replaces a part of W6+ to form an Fe–O–W bond. Compared with the Fe–O–Fe bonding in Fe2O3, the bonding between Fe and O is slightly enhanced in the Fe–O–W bond, and the bonding between W and O is slightly reduced compared with that in W–O–W. Therefore, the peak of Fe 2p has a slightly positive shift, and the peaks of W 4f and O 1s have slightly negative shifts. After the photocatalytic reaction, the binding energy positions of Fe 2p exhibit slightly negative shifts (713.74 eV for Fe 2p3/2 and 722.77 eV for Fe 2p1/2); the binding energy positions of W 4f (35.62 eV for W 4f7/2 and 37.78 eV for W 4f5/2) and O 1s (530.6 eV) for Fe-doped WO3 after irradiation exhibit a slightly positive shift relative to that of Fe-doped WO3 before irradiation. The binding energy positions of W 4f and O 1s for Fe-doped WO3 after the photocatalytic reaction are almost the same as those of un-doped WO3. According to the variation in binding energy positions, we conclude that the reduction potential of Fe3+/Fe2+ is more positive than that of W6+/W5+; therefore, Fe3+ can more easily capture photo-generated electrons to generate Fe2+ during the photocatalytic reaction, which results in decrease in the electronegativity. Therefore, the bonding between O and Fe is weakened and the bonding between O and W is strengthened in Fe–O–W. Simultaneously, the presence of Fe3+ can prevent the photo-corrosion of WO3 (W6+ changes into W5+ by photo-generated electrons), which is beneficial for the photocatalytic reaction.3.5 Photocatalytic activity
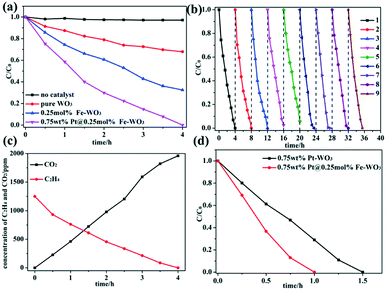
The photocatalytic activities of WO3, Fe-doped WO3 and Pt@Fe-doped WO3 were evaluated by performing photocatalytic ethylene degradation under visible-light irradiation. To obtain the optimal calcination temperature for WO2.72 to determine the optimal photocatalytic performance for initial WO3, multi-group degradation experiments were performed under the irradiation of full spectrum light. The detailed results can be seen in the ESI† (Fig. S2a). Among the studied samples, the sample calcined at 450 °C exhibited optimal photocatalytic ethylene degradation performance; thus, we chose 450 °C as the optimal annealing temperature. In addition, the optimal doping amount of Fe3+ ions was also chosen in our experiment, and the detailed result can be seen in the ESI† (Fig. S2b). When the doping amount of Fe3+ ions reached 0.25 mol%, the sample exhibited optimal photocatalytic performance under irradiation with full spectrum light. More doping amount caused decrease in the photocatalytic activity due to introduction of too much recombination centers.26,27 The photocatalytic activity can be further improved by loading of Pt as a co-catalyst, and the optimal loading amount of Pt is 0.75 wt%; the detailed result can be seen in ESI† (Fig. S2c). After all the optimal parameters were chosen, we performed the photocatalytic degradation of ethylene using no photocatalyst, pure WO3, 0.25 mol% Fe–WO3 and 0.75 wt% Pt@0.25 mol% Fe–WO3 under visible-light irradiation. The detailed results are shown in Fig. 7a. Without a photocatalyst, the concentration of ethylene was almost invariable, which proved that the degradation of ethylene is entirely caused by the photocatalytic reaction. After Fe3+ ions were doped into WO3, the photocatalytic activity improved almost 2 times than that of pure WO3. To further improve the photocatalytic activity, Pt as a co-catalyst was loaded on the 0.25 mol% Fe–WO3 sample through photo-reduction. The 0.75 wt% Pt@0.25 mol% Fe–WO3 sample exhibited the optimal photocatalytic activity and could degrade all of the ethylene in four hours under irradiation of visible light. From Fig. 7c, we can see that the concentration of CO2 increased gradually during the process of photocatalytic degradation of C2H4, and the results illustrate that 80% C2H4 can be completely degraded to CO2. The other partially oxidized intermediate species contain mainly CO and a small amount of formaldehyde. Stability is a very important criterion for the practical application of a photocatalyst. The recyclability of the photocatalyst was studied by performing consecutive degradation experiments under irradiation of visible light. After each cycle, the sample was collected and calcined at 450 °C for 0.5 hour to remove possible residuary organics. The result of the cycle experiment can be seen in Fig. 7b; the sample still maintained the initial photocatalytic activity after nine cycles, revealing that the photocatalyst has excellent recyclability. To prove the important effect of Fe doping, a contrast experiment was carried out using 0.75 wt% Pt–WO3 and 0.75 wt% Pt@0.25 mol% Fe–WO3 as photocatalysts under irradiation with full spectrum light. The detailed results can be seen in Fig. 7d. The results show that the photocatalytic activity of 0.75 wt% Pt@0.25 mol% Fe–WO3 is superior to that of 0.75 wt% Pt–WO3, thereby illustrating that Fe doping in the system plays an important role during the photocatalytic degradation. The photocatalytic degradation activity of 0.75 wt% Pt@0.25 mol% Fe–WO3 sample was compared with that of other photocatalysts such as Pt–TiO2, Ag–ZnO, AuAg–ZnO, BiVO4/P25, and In2O3–Ag–Ag3PO4; the detailed information can be found in Table S1 (ESI†). Under visible-light irradiation, the photocatalytic C2H4 degradation activity of 0.75 wt% Pt@0.25 mol% Fe–WO3 was better than those of BiVO4/P25 and In2O3–Ag–Ag3PO4. Under full light irradiation, its activity was no less than those of Ag–ZnO and AuAg–ZnO, but it was poorer than that of Pt–TiO2. This proves that Pt@Fe–doped WO3 has a good application prospect.3.6 Photoelectrochemical measurement and photoluminescence spectra
Photoelectrochemical tests and PL spectra are usually used to determine the separation ability of photo-excited carriers.28–30Fig. 8a shows the results of the transient photocurrent response of pure WO3 and 0.25 mol% Fe–WO3 under AM 1.5 light irradiation in 0.5 M Na2SO4 aqueous solution at a bias potential of 1.23 V. Clearly, the 0.25 mol% Fe–WO3 sample shows larger photocurrent density than pure WO3 at the same bias potential, suggesting that the photo-generated electron–hole pairs in Fe-doped WO3 can be easily separated compared to those in pure WO3. Fig. 8b displays the PL intensity of pristine WO3, 0.25 mol% Fe–WO3 and 0.75 wt% Pt@0.25 mol% Fe–WO3. As can be seen, the PL intensity of 0.25 mol% Fe–WO3 is lower than that of pristine WO3, demonstrating a lower electron–hole recombination rate for 0.25 mol% Fe–WO3 compared with that of pristine WO3. This result is consistent with the result of the transient photocurrent response. Furthermore, the PL intensity further decreased when 0.75 wt% Pt was loaded onto 0.25 mol% Fe–WO3, indicating that the recombination rate of electrons and holes further decreased. These results are in good agreement with photocatalytic activity.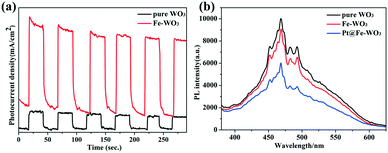 | ||
| Fig. 8 (a) Photocurrent curves of pure WO3 and 0.25 mol% Fe-doped WO3; (b) PL spectra of pure WO3, 0.25 mol% Fe-doped WO3 and 0.75 wt% Pt@0.25 mol% Fe–WO3. | ||
3.7 Photocatalytic mechanism
From all the above results, the possible photocatalytic mechanism is shown in Fig. 9. When the photocatalyst is irradiated using visible light (λ ≥ 420 nm), WO3 absorbs photons to produce photo-generated electrons and holes. In previous studies, it has been reported that Fe3+ usually acts as an electron acceptor during the photocatalytic O2 production for WO3.31,32 Also, according to the XPS results, we can conclude that Fe3+ more easily captures photo-generated electrons to generate Fe2+ during the photocatalytic reaction due to more positive reduction potential of Fe3+/Fe2+ (0.771 V) than that of W6+/W5+.33 This can avoid the photo-corrosion of WO3 effectively and decrease the recombination of photo-generated carriers. Furthermore, Pt as a co-catalyst was loaded onto the surface of Fe-doped WO3 through photo-reduction of H2PtCl6. The work function of WO3 (5.7 eV) is larger than that of Pt (5.1 eV); when they are in contact with each other, the electrons migrate from Pt to the conduction band of WO3 to achieve equilibration of the Fermi level.34 The formation of the built-in electric field can promote the effective transfer of photo-generated electrons to Pt sites under visible irradiation, which is beneficial for the separation of photo-generated carriers and the reduction of the photo-corrosion of WO3. Due to the low CB level of WO3, the process of the single-electron reduction of oxygen cannot proceed. The accumulated electrons on the Pt particles are then used for the multi-electron reduction of oxygen molecules to form H2O2 and then for further production of hydroxyl radicals (˙OH); loading of Pt can accelerate the reaction of the photo-excited electrons with O2.35,36 The photo-generated holes with high oxidation potential react with the surface-absorbed H2O to produce hydroxyl radicals. The hydroxyl radicals as extremely strong oxidants can degrade the C2H4 molecules effectively. The synergistic effect of internal Fe3+ doping and superficial Pt loading can be expressed by a metaphor: the photo-generated electrons are water, the internal doping of Fe3+ functions as a water reservoir, and the superficial Pt co-catalyst functions as a water pump. After a certain time, the water reservoir should be released. Calcination is an effective way to convert Fe2+ back to Fe3+, and the photocatalyst can realize excellent recyclability.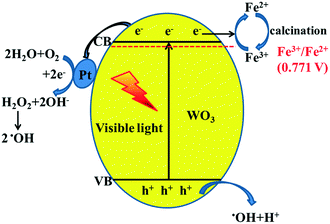 | ||
| Fig. 9 Proposed schematic diagram of charge transfer in the Pt@Fe–WO3 system under visible-light irradiation. | ||
4. Conclusions
We first report the synthesis of WO3 nanostructures with high photocatalytic activity and stability using synergetic internal Fe3+ doping and superficial Pt loading for ethylene degradation under visible-light irradiation. The optimal doping amount of Fe3+ is 0.25 mol% and the optimal loading amount of Pt is 0.75 wt%; the synergetic modification can result in about 3.3-fold improvement in the degradation rate than that of pure WO3 in photocatalytic ethylene degradation. The doped Fe3+ and loaded Pt particles can capture photo-generated electrons to reduce the recombination of photo-generated carriers and protect WO3 from photo-corrosion. This photocatalyst shows excellent photocatalytic degradation stability, revealing that it has an excellent application prospect.Conflicts of interest
There are no conflicts to declare.Acknowledgements
This work was financially supported by a research grant from the National Natural Science Foundation of China (No. 51602179, 21333006, 21573135 and 11374190), and the National Basic Research Program of China (973 Program, No. 2013CB632401), Recruitment Program for Young Professionals, China and Taishan Scholar Foundation of Shandong Province, China.Notes and references
- M. E. Saltveit, Postharvest Biol. Technol., 1999, 15(3), 279–292 CrossRef CAS
.
- X. L. Song, Y. Y. Li, Z. D. Wei, S. Y. Ye and D. D. Dionysiou, Chem. Eng. J., 2017, 314, 443–452 CrossRef CAS
.
- N. Keller, M. N. Ducamp, D. Robert and V. Keller, Chem. Rev., 2013, 113, 5029–5070 CrossRef CAS PubMed
.
- J. A. Labinger and J. E. Bercaw, Nature, 2002, 417, 507–514 CrossRef CAS PubMed
.
- M. R. Hoffmann, S. T. Martin, W. Choi and D. W. Bahnemann, Chem. Rev., 1995, 95, 69–96 CrossRef CAS
.
- S. G. Kumar and K. S. R. K. Rao, Appl. Surf. Sci., 2017, 391, 124–148 CrossRef CAS
.
- P. Wang, B. Huang, X. Qin, X. Zhang, Y. Dai and M. Whangbo, Inorg. Chem., 2009, 48(22), 10697–10702 CrossRef CAS PubMed
.
- C. Brian, B. Marsen, E. Miller, Y. Yan and B. To, J. Phys. Chem. C, 2008, 112(13), 5213–5220 CrossRef
.
- W. Morales, M. Cason, O. Aina, N. R. de Tacconi and K. Rajeshwar, J. Am. Chem. Soc., 2008, 130(20), 6318–6319 CrossRef CAS PubMed
.
- T. Gunji, A. J. Jeevagan, M. Hashimoto, T. Nozawa, T. Tanabe, S. Kaneko, M. Miyauchi and F. Matsumoto, Appl. Catal., B, 2016, 181, 475–480 CrossRef CAS
.
- D. P. DePuccio, P. Botella, B. O. Rourke and C. C. Landry, ACS Appl. Mater. Interfaces, 2015, 7(3), 1987–1996 CrossRef CAS PubMed
.
- A. Tanaka, K. Hashimoto and H. Kominami, J. Am. Chem. Soc., 2014, 136(2), 586–589 CrossRef CAS PubMed
.
- J. Jin, J. Yu, D. Guo, C. Cui and W. Ho, Small, 2015, 11(39), 5262–5271 CrossRef CAS PubMed
.
- W. L. Yu, J. X. Chen, T. T. Shang, L. F. Chen, L. Gu and T. Y. Peng, Appl. Catal., B, 2017, 219, 693–704 CrossRef CAS
.
- F. G. Wang, C. D. Valentin and G. Pacchioni, ChemCatChem, 2012, 4, 476–478 CrossRef CAS
.
- L. F. Li, X. L. Zhao, D. L. Pan and G. S. Li, Chin. J. Catal., 2017, 38, 2132–2140 CrossRef CAS
.
- J. G. Wang, Z. M. Chen, G. J. Zhai and Y. Men, Appl. Surf. Sci., 2018, 462, 760–771 CrossRef CAS
.
- C. Feng, S. Wang and B. Geng, Nanoscale, 2011, 3(9), 3695–3699 RSC
.
- H. Irie, S. Miura, K. Kamiya and K. Hashimoto, Chem. Phys. Lett., 2008, 457, 202–205 CrossRef CAS
.
- N. Li, H. Teng, L. Zhang, J. Zhou and M. Liu, RSC Adv., 2015, 5(115), 95394–95400 RSC
.
- H. Song, Y. G. Li, Z. R. Lou, M. Xiao, L. Hu, Z. Z. Ye and L. P. Zhu, Appl. Catal., B, 2015, 166, 112–120 CrossRef
.
- G. Xi, J. Ye, Q. Ma, N. Su, H. Bai and C. Wang, J. Am. Chem. Soc., 2012, 134(15), 6508–6511 CrossRef CAS PubMed
.
- T. Yamashita and P. Hayes, Appl. Surf. Sci., 2008, 254, 2441–2449 CrossRef CAS
.
- M. Xu, P. M. Da, H. Y. Wu, D. Y. Zhao and G. F. Zheng, Nano Lett., 2012, 12, 1503 CrossRef CAS PubMed
.
- T. Zhang, Z. Zhu, H. Chen, Y. Bai, S. Xiao, X. Zheng, Q. Xue and S. Yang, Nanoscale, 2015, 7, 2933–2940 RSC
.
- Y. H. Lu, W. H. Lin, C. Y. Yang, Y. H. Chiu, Y. C. Pu, M. H. Lee, Y. C. Tseng and Y. J. Hsu, Nanoscale, 2014, 6, 8796–8803 RSC
.
- R. R. Prabhakar, N. Mathews, K. B. Jinesh, K. Karthik, S. S. Pramana, B. Varghese, C. H. Sow and S. Mhaisalkar, J. Mater. Chem., 2012, 22, 9678–9683 RSC
.
- X. L. Liu, Q. Li, P. Wang, Y. Z. Liu, B. B. Huang, E. A. Rozhkova, Q. Q. Zhang, Z. Y. Wang, Y. Dai and J. Lu, Chem. Eng. J., 2018, 337, 480–487 CrossRef CAS
.
- X. L. Liu, P. Wang, H. S. Zhai, Q. Q. Zhang, B. B. Huang, Z. Y. Wang, Y. Y. Liu, X. Y. Qin and X. Y. Zhang, Appl. Catal., B, 2018, 232, 521–530 CrossRef CAS
.
- Y. Q. Wu, P. Wang, Z. H. Guan, J. X. Liu, Z. Y. Wang, Z. K. Zheng, S. Y. Jin, Y. Dai, M. H. Whangbo and B. B. Huang, ACS Catal., 2018, 8, 10349–10357 CrossRef CAS
.
- G. R. Bamwenda, T. Uesigi, Y. Abe, K. Sayama and H. Arakawa, Appl. Catal., A, 2001, 205(1–2), 117–128 CrossRef CAS
.
- O. Tomita, S. Nitta, Y. Matsuta, S. Hosokawa, M. Higashi and R. Abe, Chem. Lett., 2016, 46(2), 221–224 CrossRef
.
- H. G. Yu, H. Irie, Y. Shimodaira, Y. Hosogi, Y. Kuroda, M. Miyauchi and K. Hashimoto, J. Phys. Chem. C, 2010, 114, 16481–16487 CrossRef CAS
.
- Q. Arutanti, A. Nandiyanto, T. Ogi, T. Kim and K. Okuyama, ACS Appl. Mater. Interfaces, 2015, 7(5), 3009–3017 CrossRef PubMed
.
- S. M. Sun, W. Z. Wang, S. Z. Zeng, M. Shang and L. Zhang, J. Hazard. Mater., 2010, 178(1–3), 427–433 CrossRef CAS PubMed
.
- R. Abe, H. Takami, N. Murakami and B. Ohtani, J. Am. Chem. Soc., 2008, 130, 7780–7781 CrossRef CAS PubMed
.
Footnotes |
| † Electronic supplementary information (ESI) available. See DOI: 10.1039/c8cy02375a |
| ‡ These authors contributed equally to this work. |
| This journal is © The Royal Society of Chemistry 2019 |

