Spatially offset Raman scattering line-mapping as a potential tool for particle size analysis
Sanghoon
Cho
a,
Si Won
Song
b,
Hyung Min
Kim
 *b and
Hoeil
Chung
 *a
*a
aDepartment of Chemistry and Research Institute for Convergence of Basic Science, Hanyang University, 222 Wangsimni-ro, Seoul 04763, Republic of Korea. E-mail: hoeil@hanyang.ac.kr; Fax: +82 2 2299 0762; Tel: +82 2 2220 0937
bDepartment of Chemistry, Kookmin University, 77 Jeongneung-ro, Seoul 02707, Republic of Korea. E-mail: hyungkim@kookmin.ac.kr; Fax: +82 2 910 4415; Tel: +82 2 910 5770
First published on 12th April 2021
Abstract
A spatially offset Raman spectroscopy (SORS) line-mapping scheme was explored as a tool for the measurement of particle size. The proposed scheme is based on the fact that photon migration in powder packing varies as a function of the reduced scattering coefficient, which is directly related to the particle size of the sample. It is known that a smaller particle yields a larger reduced scattering coefficient. Therefore, recognition of the particle size-dependent photon migration (distribution) could be a means to determine the sample's particle size and SORS is a versatile tool for this purpose. Peak intensities acquired along the SORS mapping line are expected to decrease with an increase of the offset distance and the descending slope of the peak intensity can be translated into particle size, for example, a greater slope (steeper intensity decrease) for smaller particles yielding a narrower (denser) photon distribution. For the study, low-density polyethylene (LDPE) and middle-density PE (MDPE) powders with four particle sizes were measured. In each case, the slope of intensity decrease became less steep with the increase of particle size due to the broader photon distribution. A comparative analysis of LDPE and MDPE spectra found that the slope was steeper in the measurement of MDPE powder since the photon distribution was narrower owing to the high particle density. Together, these findings suggest that the proposed scheme is potentially expandable to measure particle sizes of samples with relevant prior calibration and provide useful information on sample composition also for chemical analysis.
Introduction
Spatially offset Raman spectroscopy (SORS)-based line-mapping has been demonstrated earlier as an effective tool to determine the variation of coating thickness of pharmaceutical tablets.1 It is known that the positions of Raman photon collection are distant from those of laser excitation in SORS measurement.2,3 When SORS line-mapping was executed along the coated tablet, the intensity of the outer coating peak decreased along the mapping line. Therefore, the ratio of peak intensities between coating material and inner core tablet varied in a series of mapped spectra, and the slope of the intensity ratio variation was correlated with the coating thickness. For example, a thicker coating resulted in a steeper slope, which was equivalent to a more substantial decrease of coating peak along the mapping line.1 This research was a trial of SORS line-mapping to measure the coating thickness of a tablet.In Raman measurement of powder samples, laser photons propagate isotropically inside the medium due to continual scattering, and generated Raman photons distribute broadly in the sample packing.4,5 As reported, the photon migration in powder packing varied as a function of the reduced scattering coefficient.5 Based on a previous report,6 the Raman photon distribution in a packed sample became broader with a decrease of the reduced scattering coefficient since the mean free path of laser photons (the average photon travel distance between consecutive scattering locations) became longer under this situation.7–10 The larger photon distribution corresponds to a less dense photon population in a given volume,11 while the photon population is higher near the laser illumination spot.12 By utilizing the described tendency, the reduced scattering coefficient of a turbid sample was effectively determined using SORS measurement.13
Meanwhile, the reduced scattering coefficient is directly related to the particle size of the sample. As reported, a smaller particle yielded a larger reduced scattering coefficient (equivalent to narrower photon distribution).6 This particle size-dependent Raman photon distribution was also confirmed using Monte Carlo simulation.6,14 Therefore, SORS line-mapping on a packed powder sample could be another versatile analytical tool for the measurement of particle size. Peak intensities of the sample in consecutive line-mapped spectra are expected to decrease with the distance from the laser illumination point15 and the slope of the intensity decrease is potentially related to sample particle size. For example, a steeper intensity decrease (slope) along a mapping line is anticipated for a sample composed of smaller particles since the subsequent photon distribution is narrower and denser than that of larger particles. Therefore, the slope of intensity variation could be translated into the particle size of a measured sample and exploration of this feasibility is a major goal of this study. Typically, particle size analysis is based on laser diffraction and dynamic light scattering.16 However, such analysis provides information only on the physical property (particle size), and not the chemical identity of the sample,17 such as provided by Raman spectroscopy.
For the exploratory study, low-density polyethylene (LDPE) powders with four particle sizes (95.7, 147, 223, and 303 µm) were prepared, and SORS line-mapping was performed over the packing of each sample. The slope of the peak intensity variation in the line-mapped spectra was analyzed, and the relationship between particle size and slope was investigated. Particle density also governs the photon distribution in a packed sample. To address this issue, middle density PE (MDPE) powders with four particle sizes (82.0, 129, 202, and 282 µm) were also measured, and the results were compared with those of LDPE measurement.
Experimental
The LDPE (density: 0.92 g cm−3, refractive index: 1.51) and MDPE (density: 0.94 g cm−3, refractive index: 1.53) powders were purchased from Sigma-Aldrich. Particles of four sizes (95.7 ± 42.8, 147 ± 52.8, 223 ± 72.3, and 303 ± 88.9 µm for LDPE; 82.0 ± 19.9, 129 ± 34.3, 202 ± 53.9, and 282 ± 100 µm for MDPE) were prepared by sieving the purchased powders. The particle sizes were analyzed using a particle size analyzer (Malvern Instruments, Malvern, UK). As determined, the particle size variations in the sieved samples were considerable. Fig. 1 shows the microscopic pictures of the separated LDPE and MDPE particles. The shapes of LDPE particles largely differ; while, the MDPE particles are relatively more spherical.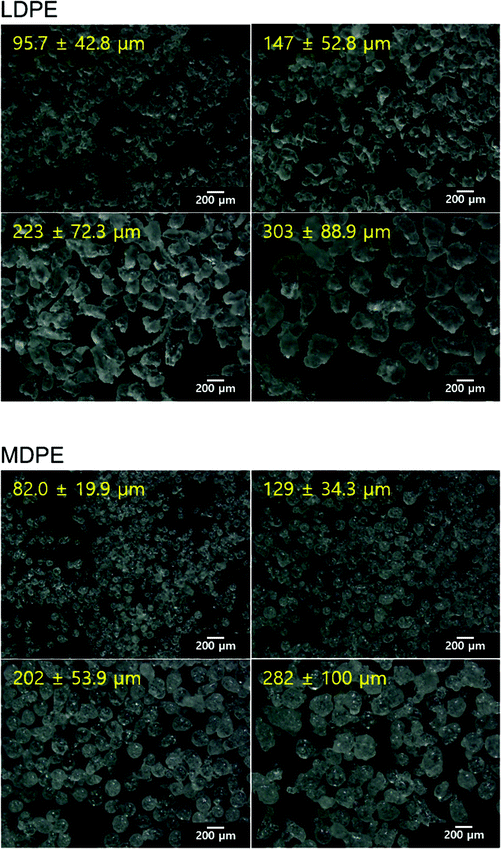 | ||
| Fig. 1 Microscopic picture of the separated LDPE (top) and MDPE (bottom) particles with 4 different sizes. | ||
Each sieved sample (1 g) was transferred into a 1 cm rectangular quartz cuvette for SORS line-mapping. The packing densities of 95.7, 147, 223, and 303 µm LDPE particles were 0.464 ± 0.020, 0.446 ± 0.015, 0.450 ± 0.004, and 0.450 ± 0.005 g cm−3, respectively. Furthermore, the packing densities of 82, 129, 202, and 282 µm MDPE particles were 0.491 ± 0.004, 0.503 ± 0.004, 0.484 ± 0.004, and 0.475 ± 0.008 g cm−3, respectively. In both the cases, the packing densities in the three replicates did not change significantly (relative standard deviations: 0.8–4.3%). Hyperspectral line-mapping of each sample was performed using an in-house wide-depth SORS system. Detailed description on the employed SORS system can be found in our previous publication;1 while, a schematic description of the overall instrumentation is shown in Fig. 2. Briefly, it consisted of a polychromator (Acton SP2300, Princeton Instruments, NJ, USA), a large-area CCD camera (PIXIS 400BR, Princeton Instruments, NJ, USA), a 785 nm diode laser (LML-785.0, PD-LD, NJ, USA), and relevant optical components. For spectral acquisition, the laser (power: 375 mW) was initially illuminated at 45° on the PE particle packing through a lens (focal length: 100 mm). The laser illumination area measured using a laser beam profiler (LBP02-VIS, Newport, CA, USA) was approximately 0.26 mm2. Then, scattered photons were passed through a long-pass filter (LL01-785-25, Semrock, NY, USA) and projected onto the slit of the polychromator. Next, the photons were dispersed by grating and imaged onto a CCD with 1340 × 400 pixels. Out of 400 rows in the CCD, 300 rows were used to acquire SORS spectra. The calculated offset size for an image pixel was 25 µm, while the actual size of the camera pixel was 20 µm. With this instrumentation, the range of physical spatial offset distance covered in this study was from 0.25 to 7.5 mm. SORS spectra of each sample were collected by accumulating 10 scans with a laser exposure time of 3 s for each scan (total acquisition time: 30 seconds).
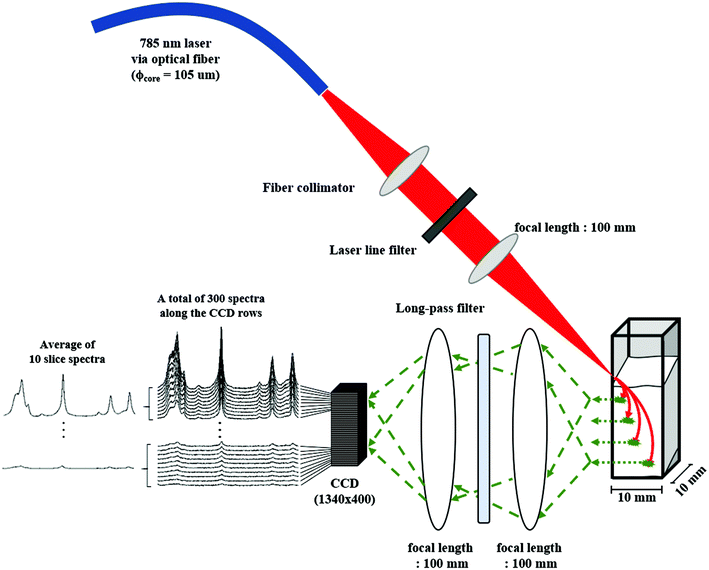 | ||
| Fig. 2 Schematic description on overall SORS system employed in this study and average of acquired slice spectra for line-mapping analysis. | ||
Results and discussion
Fig. 3(a) shows Raman spectra (1504–1050 cm−1 range) of the 303 μm LDPE powder acquired using the SORS line-mapping scheme. Three hundred rows in the CCD were utilized to collect 300 individual offset-dependent spectra as described in the Experimental section, whereas 10 consecutive spectra were averaged into one slice spectrum to improve the signal-to-noise ratio (refer to the left-bottom part in Fig. 2). Therefore, a total of 30 slice spectra along the offset distance are shown in the figure. Slice spectra #1 and #30 were acquired at offset distances of 0.25 and 7.5 mm, respectively. Meanwhile, the odd numbered slice spectra and #30 slice spectrum are only shown in the figure for clear comparison. Typical PE Raman peaks were observed at 1441, 1299, 1134, 1068 cm−1.18 The 1441 and 1299 cm−1 peaks originated from CH2 bending and CH2 twisting, respectively. The C–C backbone stretching was responsible for the 1134 and 1068 cm−1 peaks. The intensities of PE peaks in the 1st through 30th slice spectra (corresponding to the offset distances from 0.25 to 7.5 mm) continuously decreased as indicted by the arrow. As the offset distance increases, the number of Raman photons arriving at the corresponding offset position decreases.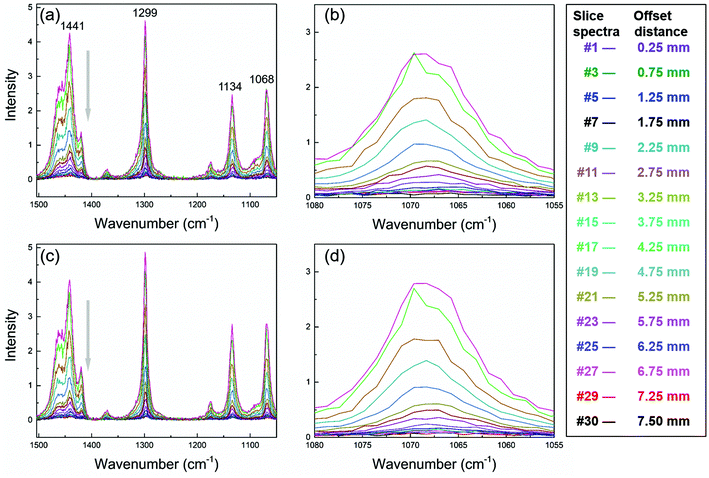 | ||
| Fig. 3 SORS line-mapped spectra of the 303 μm LDPE packing in the 1504–1050 (a) and 1080–1055 cm−1 ranges (b) and the 282 μm MDPE packing in the 1504–1050 (c) and 1080–1055 cm−1 (d) ranges. | ||
For a detailed observation, the 1080–1055 cm−1 range containing the 1068 cm−1 peak is highlighted in Fig. 3(b). The decrease of peak intensity is apparent and more significant in the earlier slice spectra acquired at the offset positions nearer the laser illumination point. In the later slice spectra (such as the 15th through 30th slice spectra, corresponding to the offset distances from 3.75 to 7.5 mm), the decrease of peak intensity becomes less substantial because of the relatively low photon counts at these farther offset positions.
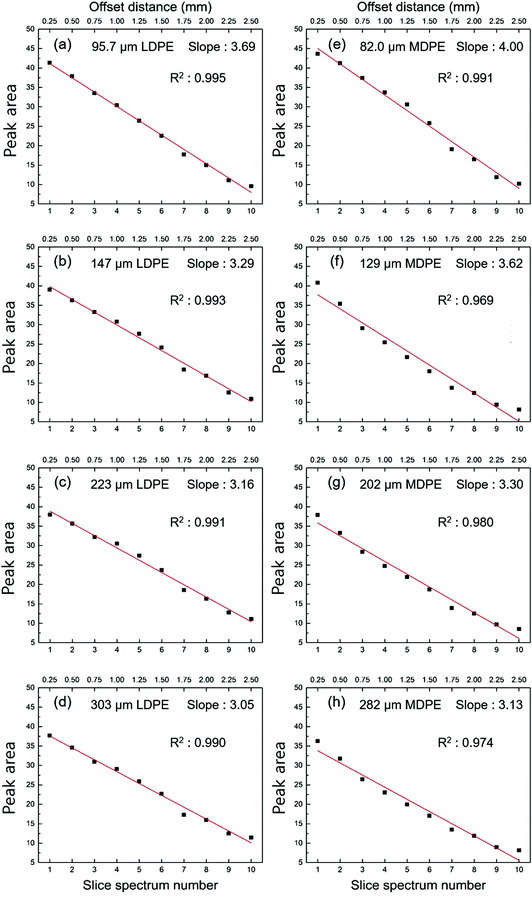
Fig. 4(a) shows the variation of peak area in the 1080–1055 cm−1 range in the 1st to 10th slice spectra (the offset distances from 0.25 to 2.5 mm) of the 95.7 μm LDPE particle packing. The real physical offset distance corresponding to each slice spectrum is designated at the top x-axis, which ranges from 0.25 to 2.50 mm. The 11th to 30th slice spectra (the offset distances from 2.75 to 7.5 mm) were excluded from investigation since their peak intensities were weak, thereby hampering the sensitive recognition of particle size change. As clearly seen, the peak area decreases as the offset distance increases up to 2.50 mm, and the variation is linear (R2: 0.995), as indicated by the regression line. The calculated value of slope is indicated inside the figure. It is worthwhile to note that the intensity decrease is linear over the offset distance from 0.25 to 2.50 mm (corresponding to the 1st to 10th slice spectra), but nonlinear over the whole offset distance (from 0.25 to 7.5 mm), as also observed in another publication.19Fig. 4(b), (c), and (d) show the variations of peak area in the measurements of 147, 223, and 303 μm LDPE particle packing, respectively. The trend of declining peak area is observed in these measurements, and the slopes decrease as the particle size increases. Since the photon distribution becomes broader in the packing composed of larger LDPE particles, the decrease of peak area becomes less steep. Overall, the slope is clearly indicative of the particle sizes of the measured samples. Fig. 3(c) shows Raman spectra of the 282 μm MDPE packing collected with the same SORS line-mapping scheme, and Fig. 3(d) highlights the corresponding 1068 cm−1 peaks. The decrease of peak area with an increase in the offset distance is observed and the variation pattern is similar to that in Fig. 4(a) irrespective of the number of detected photons. Fig. 4(e), (f), (g), and (h) show the variation of peak area in the 1080–1055 cm−1 range in the 1st to 10th slice spectra (the offset distances from 0.25 to 2.50 mm) of the 82.0, 129, 202, and 282 μm MDPE particle packing, respectively. Again, the decreases of peak area are apparent in each case, and the slopes become less steep with the increase of particle size.
Because the densities and subsequent refractive indices of LDPE and MDPE particles differ (refer to the Experimental section), it is reasonable to expect that their particle size-dependent slope variations would be dissimilar. The higher density of MDPE results in the higher refractive index. When the measurements of 95.7 μm LDPE (Fig. 4(a)) and 129 μm MDPE packing (Fig. 4(f)) are compared, the slope magnitudes of the two are similar although the particle size of MDPE is considerably larger than that of LDPE. As the density of particles in a packing increase (such as MDPE particles), subsequent mean free paths of laser photons become shorter due to the increased particle density. Therefore, the photon distribution in the packing becomes narrower, and the intensity decrease becomes steeper. This comparison demonstrates that the peak intensity variation depends not only on particle size but also on particle density.
Fig. 5 shows the relationships between particle size and slope of peak area variation in the measurements of LDPE and MDPE particles of four sizes. The errors were calculated based on separate triplicate measurements of the samples (re-packing of the sample in each measurement). As shown by the fitted lines, non-linear relationships were observed in both the cases, and the change of slope was larger when the particle sizes of measured samples were smaller, such as below 150 μm. The curve of MDPE measurement is positioned above that of LDPE measurement due to the higher particle density, as expected. The result demonstrates that SORS line-mapping is effective to separately recognize the particle size variation of LDPE as well as MDPE samples.
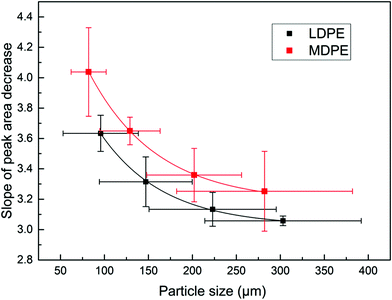 | ||
| Fig. 5 Relationships between particle size and slope of peak area decrease in the measurements of LDPE and MDPE particles with four sizes. | ||
It is important to note that absorption of the sample, another factor influencing photon distribution in a sample, is not readily discussed in this study. When sample absorption is higher, the following photon distribution becomes narrower due to the attenuation of photons by the absorption and the slope of intensity variation subsequently varies. Therefore, along with sample scattering, sample absorption needs to simultaneously consider when a target sample absorbs photons. In addition, shape, crystallinity, and surface gloss of a particle could affect the resulting photon distribution in a sample. Since the diverse parameters as mentioned above are simultaneously related to photon distribution and also different from sample to sample, the demonstrated SORS scheme is confined for the measurement of particle size for a given sample. A separate calibration requires when a different sample is newly analyzed.
Conclusion
The potential of the SORS line-mapping scheme to measure particle sizes of samples was first explored in this study. Although the proposed scheme is unable to provide absolute particle size, determination of particle size for a given sample is feasible with prior calibration, such as shown in Fig. 3. The ultimate goal of this research is to develop a robust and particle size-tolerable SORS scheme for quantitative analysis of powder mixture samples. Two important issues need to be critically addressed to meet the aim. First, Raman spectra fully representative of sample composition should be acquired to resolve a sub-sampling problem.20 Typically, deep Raman measurements such as transmission21 and SORS schemes satisfy this requirement. If a series of SORS line-mapping spectra is averaged, then the average spectrum is representative of sample composition due to the large SORS sampling volume, thereby allowing more reliable quantitative analysis.22 Second, the variation of particle size sensitively alters Raman spectral features of the sample and ultimately degrades accuracy. Since the variation of particle size can be recognized1 using SORS line-mapping, a strategy effectively correcting particle size-induced spectral features and employing the corrected spectra for quantitative analysis will be beneficial to prevent accuracy degradation. The investigation of the above-mentioned issues is underway in this research group.Conflicts of interest
There are no conflicts to declare.Acknowledgements
This research was supported by the Basic Science Research Program through the National Research Foundation of Korea (NRF) funded by the Ministry of Education (2020R1A6A1A06046728) and a National Research Foundation of Korea (NRF) grant funded by the Korean government (MSIP) (No. NRF-2020R1A2C2010170).References
- S. W. Song, J. Kim, C. Eum, Y. Cho, C. R. Park, Y.-A. Woo, H. M. Kim and H. Chung, Anal. Chem., 2019, 91, 5810–5816 CrossRef CAS PubMed
.
- K. Chao, S. Dhakal, J. Qin, Y. Peng, W. F. Schmidt, M. S. Kim and D. E. Chan, Sensors, 2017, 17, 618 CrossRef PubMed
.
- P. Matousek, I. P. Clark, E. R. Draper, M. Morris, A. Goodship, N. Everall, M. Towrie, W. Finney and A. Parker, Appl. Spectrosc., 2005, 59, 393–400 CrossRef CAS PubMed
.
- N. Townshend, A. Nordon, D. Littlejohn, J. Andrews and P. Dallin, Anal. Chem., 2012, 84, 4665–4670 CrossRef CAS PubMed
.
- S. N. Volkov, I. V. Samokhvalov and D. Kim, Appl. Opt., 2011, 50, 4054–4062 CrossRef PubMed
.
- P. K. Duy, S. Chun and H. Chung, Anal. Chem., 2017, 89, 11937–11943 CrossRef CAS PubMed
.
- B. H. Hokr and V. V. Yakovlev, J. Mod. Opt., 2014, 61, 57–60 CrossRef CAS
.
- M. V. Pellow-Jarman, P. J. Hendra and R. J. Lehnert, Vib. Spectrosc., 1996, 12, 257–261 CrossRef CAS
.
- H. Wang, C. K. Mann and T. J. Vickers, Appl. Spectrosc., 2002, 56, 1538–1544 CrossRef CAS
.
- Y. Hu, H. Wikström, S. R. Byrn and L. S. Taylor, Appl. Spectrosc., 2006, 60, 977–984 CrossRef CAS PubMed
.
- O. Man'ko and N. Tcherniega, J. Russ. Laser Res., 1997, 18, 479–493 CrossRef
.
- N. Teranishi, IEEE Trans. Electron Devices, 2012, 59, 2199–2205 Search PubMed
.
- S. Mosca, P. Dey, M. Salimi, B. Gardner, F. Palombo, N. Stone and P. Matousek, Anal. Chem., 2021, 93, 3386–3392 CrossRef CAS PubMed
.
- P. Matousek, C. Conti, C. Colombo and M. Realini, Appl. Spectrosc., 2015, 69, 1091–1095 CrossRef CAS PubMed
.
- P. Matousek, Chem. Soc. Rev., 2007, 36, 1292–1304 RSC
.
- M. Kaszuba, D. McKnight, M. T. Connah, F. K. McNeil-Watson and U. Nobbmann, J. Nanopart. Res., 2008, 10, 823–829 CrossRef CAS
.
- F. M. Etzler and M. S. Sanderson, Part. Part. Syst. Charact., 1995, 12, 217–224 CrossRef CAS
.
- S. Kim, H. Shinzawa, H. Chung and Y. Ozaki, Analyst, 2015, 140, 1906–1912 RSC
.
- P. Matousek, M. Morris, N. Everall, I. Clark, M. Towrie, E. Draper, A. Goodship and A. Parker, Appl. Spectrosc., 2005, 59, 1485–1492 CrossRef CAS PubMed
.
- H. J. Venables and J. Wells, Drug Dev. Ind. Pharm., 2002, 28, 107–117 CrossRef CAS PubMed
.
- P. Matousek and A. Parker, J. Raman Spectrosc., 2007, 38, 563–567 CrossRef CAS
.
- C. Eliasson and P. Matousek, Anal. Chem., 2007, 79, 1696–1701 CrossRef CAS PubMed
.
| This journal is © The Royal Society of Chemistry 2021 |

