Fabrication and characterization of laser-heated, multiplexed electrospray emitter†
Emily R.
Groper
a,
Jack A.
Barnes
a,
Rory
McEwen
a,
Younès
Messaddeq
 b,
Richard D.
Oleschuk
 *a and
Hans-Peter
Loock
 *ac
*ac
aDepartment of Chemistry, Queen's University, Kingston, ON, Canada K7L 3N6. E-mail: richard.oleschuk@chem.queensu.ca; hploock@uvic.ca
bCentre d'optique, photonique et laser (COPL), Université Laval, Quebec, QC, Canada G1V 0A6
cDepartment of Chemistry, University of Victoria, Victoria, BC, Canada V8P 5C2
First published on 12th March 2021
Abstract
We present a one-step fabrication method for a new multiplexed electrospray emitter with nine parallel micronozzles. The nozzles were formed by wet chemical etching of the end of a microstructured silica fiber containing nine 10 μm flow channels. By carefully adjusting the water flow through the channels while etching, we controlled the shape of the conical micronozzles and were able to obtain conditions under which the micronozzles, together with the flow channels, formed optical micro-axicon lenses. When 1064 nm light was guided through the flow channels and focused by the micro-axicon lenses into the Taylor cones, we were able to increase the desolvation of a model analyte and thereby increased the spray current produced by the emitter. This work paves the way towards a rapidly modulated mass-spectrometry source having a greatly enhanced throughput.
Introduction
Electrospray (ES) emission has found many applications, with those related to electrospray ionization (ESI) as an ion source for mass-spectrometry being the most familiar to analytical chemists. However, other fields also exploit that electrospray emission is a highly controllable source of fast ions and clusters.1 Examples are thrusters for spacecraft such as the micro-Newton “colloidal thrusters” for the laser interferometer space antenna (LISA) pathfinder mission by NASA and the European Space Agency (ESA)2,3 and the electrospray coating devices to generate ultra-thin films and coatings.4 In all these fields, including mass spectrometry, of course, having a highly controllable and reliable ion current is an important consideration.Among the many ionization techniques used in mass-spectrometry, electrospray ionization (ESI) is particularly popular for soft ionization of larger (bio)molecules. ESI relies on the quick desolvation of charged droplets in a process that is driven by both solvent evaporation and coulombic fission events to produce bare analyte ions for detection. Even for large molecules, the process results in isolated molecules that can carry multiple charges. ESI-mass spectrometry frequently produces these multiply charged ions with very little fragmentation, thereby extending the mass-range of the mass spectrometer.
The ESI emitter is typically a single-channel capillary made from a conducting or non-conducting material, which is biased at its tip to several kilovolts and is held at near-ambient temperature and pressure. The sample liquid exiting the emitter forms a cone – the Taylor cone – in front of the orifice that is stabilized by surface tension counteracting the liquid's surface charge. The spray droplets are ejected from the tip of the cone and then undergo the desolvation process mentioned above.
In designing ESI emitters, one wants to balance sample throughput against desolvation efficiency. Emitters with large internal diameters produce an electrospray at higher flow rates. With a high flow rate the samples are delivered more quickly to the spectrometer, which results in a larger ion current per mass/charge (m/z) signal at the MS detector. Unfortunately, large-diameter emitters also produce larger Taylor cones which tend to produce larger charged droplets and therefore poorer ionization efficiencies. So-called nano-spray or pico-spray emitters consist of capillaries with orifices having diameters of only 2–20 μm, which produce much smaller droplets at the expense of sample throughput. However, a small sample throughput may also be beneficial for expensive samples or those of very limited supply, such as proteins or peptides. Karas et al.5–7 has further demonstrated that nano-ESI reduces the interference effects from salts and other species that are often experienced with conventional ESI schemes. Nano-ESI was found to be superior for detecting analytes that lack surface activity such as sugars, for spraying solvents with high surface tensions such as water, and for sample solutions that contain high levels of salts or buffers.8
When emitter orifices are as small as a few micrometers in diameter, the pressure required to pump the sample through the capillary of the same diameter may become very high. Manufacturers therefore supply larger-diameter capillaries that are internally tapered to a small orifice at the tip. Unfortunately, these tips clog easily when the sample liquid contains solid particles.
Since 2001, there has been considerable effort to improve the stability and throughput of ESI by multiplexing emitters in micro-fabricated arrays.9–11 For example, linear/planar array designs improved the MS sensitivity, but the inhomogeneous field at the emitting orifices also resulted in emitters operating under a variety of conditions with those in the interior of the array experiencing much lower electric fields relative to those at the border. These effects render the optimization of spraying conditions difficult and limit the ability to fabricate arrays with a higher number of emitters. Emitters arranged in a large circular array successfully avoid the heterogeneity issue, but may require an ion funnel or Einzel lens to direct the ions from the much larger source into the entrance of the mass spectrometer.12,13
Microstructured fibers (MSFs) such as hollow-core waveguides were originally developed as optical waveguides14,15 but may also operate as electrospray emitters. MSFs that are designed for waveguiding applications include photonic crystal fibers, kagome waveguides and polarization maintaining fibers. Many are produced by inserting capillaries into the preform to create well-defined channels. After drawing a fiber from the preform the MSF contains extremely long (hundreds of meters) capillaries with uniform diameters on the micron-scale.16 In ESI applications these open channels can then be used to direct an analyte-containing solution into a mass spectrometer. Unfortunately, commercially available MSFs were found to be poor ESI emitters, since the close proximity of their channels prevents the formation of distinct Taylor cones at each orifice.12 For example, Gibson et al. were able to generate multiple electrosprays (MESs) using polycarbonate MSFs only with completely aqueous samples due to wetting effects.17
In addition to multiplexing nano- or pico-emitters, one may further increase the desolvation efficiency by heating the sample at the emitter source e.g. by providing a coaxial sheath flow of heated gas.18
Finally, the signal-to noise ratio for many instruments – not just mass-spectrometers – may be improved by rapid modulation of the source and lock-in detection of the modulated signal.19 Neither flow nor heating methods are typically rapid enough to provide the fast shutter speeds necessary to obtain a lock-in advantage at kilohertz modulation frequencies, but even low modulation frequencies (milli-hertz) have shown to provide multiplex advantages in ESI.20
In this report, we present an emitter suitable for ESI that consists of an array of micron-sized orifices in an MSF which can be laser-heated to provide rapid desolvation, and which may be readily modulated at high frequencies. While mass-spectrometry will be the immediate application of our emitter, other applications such as propulsion sources, nozzles for fabrication of nano-yarns by electrospinning,21–23 or electrospray nozzles to generate thin films are certainly considered.
Here, the emitter array consists of nine nozzles arranged equidistantly in a radial pattern, each with an orifice of ∼10 μm. By splitting the flow into smaller streams, we can prevent clogging and achieve the sensitivity benefits associated with nano-ESI. It has been shown through experiments and modelling that the ion current scales with the square root of the number of emitters,24,25 and we therefore expect an increase of the ion current by up to a factor of three, if the sample flow is directed through nine smaller emitters instead of one large emitter.
Here, the nozzles are fabricated via wet-chemical etching of a custom-designed microstructured fiber (MSF) in hydrofluoric acid. Since the MSF was designed to have nine fused silica capillaries in a circle embedded in borosilicate glass, the difference in etch rates between the fused silica and the borosilicate matrix results in protruding conical nozzles in the silica-doped regions of the fiber. The cone angle of these silica cones can be controlled by adjusting the etching conditions.
Furthermore, the difference in refractive index between fused silica (n = 1.464) and borosilicate glass (n = 1.461) allows for light-guiding of near-infrared (IR) light along the capillaries and tight focusing at the conical nozzle tips. The absorption of the IR light through solvent overtone vibrations heats the emitted droplets enough that evaporation is accelerated and the spray current is measurably increased. The temperature can be changed by adjusting the laser output power.
In the following, we first briefly describe the manufacture of the MSF, followed by the fabrication and characterization of the nozzles and finally present a preliminary study showing the effect of laser heating the solvent through focusing at the nozzle tips.
The main purpose of this work lies in the development of a multi-emitter source having an ion current that is controllable through both laser intensity and by changing the flow regime. We therefore use a simple home-made system capable of measuring the emitter current while the flow regime can be observed through a microscope. We note that several previous studies were able to relate the ion current with such an “offline” system to the ion current (and therefore signal to noise ratio) in a mass-spectrometer.26–30
The implementation and characterization of the emitter in its possible applications, such as a nozzle for electrospray-coating, electrospinning, or an ESI source for a mass-spectrometer will not be discussed. The focus of the present study is instead on the fabrication of emitters with different geometries and their characterization as reliable, high throughput emitters having an ion current that can be widely adjusted by changing the flow regime or the laser intensity.
Fabrication of the microstructured fiber
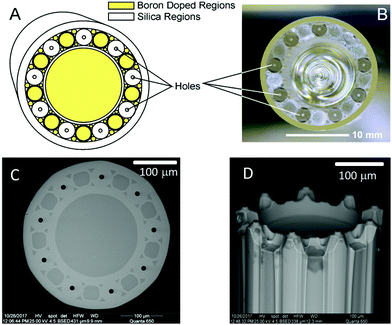
In this work, a custom designed MSF was fabricated at Centre for Optics, Photonics and Lasers (COPL, Québec City, Canada) using the “stack and draw” method. The preform consisted of tubes and rods of both borosilicate and fused silica glass (Fig. 1A and B). By employing glass having different refractive indices and different etch rates in HF-solutions, we can create multiple protruding ESI emitters each terminated in an axicon lens. By maintaining near-IR waveguiding capabilities along the silica sections of the MSF, the fiber also operates as a multimode optical fiber waveguide via total internal reflection (TIR).The MSF was drawn to a diameter of about 360 μm with each open orifice having a diameter of 9.9 ± 0.2 μm. Before etching the embedded silica waveguides had a diameter of 45.1 ± 0.3 μm (Fig. 1C and Electronic Supplementary Information†). The fiber was cut into pieces of about 50 mm length using a fiber cleaver (LDC-400, Vytran, Morganville, NJ, USA). Etching in HF-solution (∼40%) then produced the nine protruding ESI emitters shown in Fig. 1D.8,12,31
A flow-assisted procedure was implemented in order to produce nine micronozzles (one at each channel) at the facet of the custom-designed MSF.32 Once the fiber is stripped and cleaved, it is coupled to the pump of a high-performance liquid chromatography system (Waters NanoAcquity Ultra Performance LC, Binary Solvent Manager) via a fused silica capillary (60 cm length, 100 μm O.D.) in order to deliver water flow through each of the fiber channels. The fiber is held orthogonal to the etchant (HF) that is contained within a centrifuge tube at the desired depth and is coupled to the capillary using polyether ether ketone (PEEK) fittings, here, a liquid–liquid union with a 360 μm I.D. and fluorinated ethylene propylene (FEP) sleeves. To fill the capillary and eliminate dead volume or debris, the system is initially flushed with higher flow rates (1 μL min−1) for approximately 5 minutes. The flow rate is then reduced to the desired rate and equilibrated until stable pressures are achieved (approximately 10 to 15 minutes depending on the fiber length, etch time and flow rate). Details are given in the Electronic Supplementary Information.†
When working with HF-solutions one should be aware of their unique dangers. Hydrofluoric acid (HF) readily penetrates the skin, causing destruction of deep tissue layers, including bone. Pain associated with skin exposure to HF may not occur for 1–24 hours. Unless preventative measures are taken immediately, tissue destruction may continue for days and result in limb loss or death. Safety precautions must be taken and appropriate protection must be worn. Ensure that calcium gluconate antidote is on hand before handling HF. Always handle HF in a properly functioning laboratory hood and in an area equipped with an eyewash and safety shower. Never work with HF alone.
Throughout the etching process, water is directed through each of the nine channels to protect the channel walls from deterioration.33 The protective water flow is introduced at a rate matched to the diffusion rate of the etchant. It locally decreases the HF concentration and creates an etchant concentration gradient extending radially from the center axis of the flow channel.31 The borosilicate regions etch faster than fused silica, which results in the formation of nine protruding micronozzles (or individual electrospray emitters). As will be shown theoretically and experimentally, we can change the morphology of each nozzle by altering the etchant concentration, etch time and flow rate of water during the etching procedure.
The etching mechanism has been modelled previously using simple rate equations by Bachus et al. (2016).31 The model assumes that the material removal rate depends linearly on the (locally constant) concentration of the etchant, HF, and a rate constant, ki, which differs for borosilicate (k1) and fused silica glass (k2). This assumption can be written as:31
 | (1) |
This model also assumes that the HF concentration varies linearly between the inner rim of the filled channel, [HF]D, and the outer border of that channel, [HF]C.
Each micronozzle can be described by its axicon angle, γ, and post angle, α. Kotsas et al. (1991)34 explained that when a single-mode fiber is dipped into an etchant, a protuberance is created on its end-surface and the fiber core is transformed into a cone. The base radius of this cone is always equal to the fiber core radius.34 The geometric parameters of the fiber end (base-angle, height and top radius) were calculated using rate equations as determined experimentally by Kawachi and Edahiro (1982).35
Here, the post angle, α, was obtained by employing the integral of (1) to yield12,31
 | (2) |
Within our assumptions, the post angle depends solely on the ratio of etching rate constants for borosilicate and fused silica glass, and is expected to be largely independent of etch time.
The micronozzle morphology is also described by the axicon angle, γ, which can similarly be calculated with31
 | (3) |
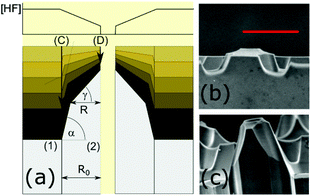 | ||
| Fig. 2 (a) Schematic of the micronozzle formation during etching. Regions (1) and (2) correspond to the borosilicate and fused silica regions, respectively. R0 is the distance from the channel wall (D) to the borosilicate boundary (C) and R is the width of the upper portion of the nozzle. Each nozzle can be described by its axicon angle, γ, and post angle, α (adapted from ref. 15). (b) Scanning electron micrographs of the micronozzles fabricated by etching the custom-designed MSF for 15 minutes and (c) for 20 minutes at a water flow rate of ∼54 nL min−1. The red scale bar is 50 μm. | ||
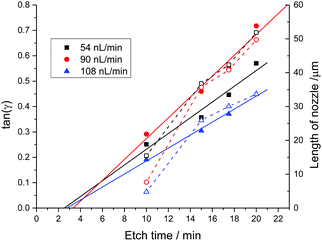
A series of MES emitters was produced from a polyacrylate coated fiber having nine channels at different water flow rates of 54 nL min−1, 90 nL min−1 and 108 nL min−1 using two different pumps as described in the Electronic Supplementary Information.† For each of the fabrication runs we analyzed SEM images taken after three different etch times. The axicon angle, γ, the post angle, α, and the length of the nozzle were obtained by averaging measurements taken by image analysis of SEM micrographs from duplicate or triplicate runs. Fig. 3 shows that the axicon angle increases with etch time as expected from (3), where tan(γ) increases approximately linearly with time. The post angle (not shown) remains nearly constant at 68.7 ± 1.3 degrees for all runs, as expected from (2). The nozzle length also increases linearly with time as one might expect from (1). The shorter than expected nozzles at the highest flow rate are likely due to dilution of the HF solution. Dilution of the etching solution may also explain why the gradient of the [HF] concentrations in (3) is smallest for the highest flow rate and therefore the axicon angles increases less than for the two lower flow rates.
The reproducibility of this fabrication process is quite high. Six independent etching processes at a flow rate of 90 nL min−1 and 20 min etch time yielded nozzle lengths of 28.6 ± 4.5 μm (16% relative standard deviation, RSD), an axicon angle of γ = 18.4 ± 2.6 degrees (14% RSD) and a post angle α = 67.7 ± 3.0 degrees (5% RSD). See the Electronic Supplementary Information† for details.
Here, we demonstrated that one can obtain a high degree of control over the geometry of the ESI emitter by systematically adjusting etch time and water flow rate. Reproducibility can likely be further increased using larger volumes of etching solution to avoid dilution, and/or automating the fabrication process.
Optical properties of micronozzle array
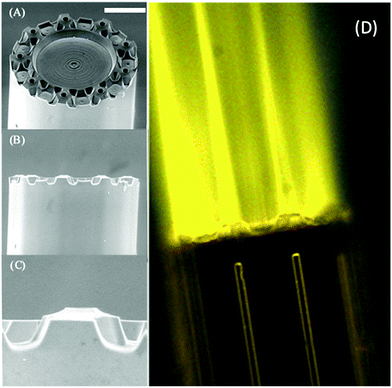
In order to confirm the micronozzles’ ability to guide and focus light, we used fluorescence microscopy employing 532 nm radiation from a fiber-coupled class IIIB laser (EVO Laser, Wicked Lasers, Limassol, CY) and a rhodamine 6G (R6G) dye solution (Exciton, Lockbourne, OH) to image the emission from the axicon fiber nozzles. Light from the laser was collinearly coupled into the high-index components of the MES emitter via a polyether ether ketone (PEEK) union. By submerging the emitter in an aqueous solution of R6G dye, fluorescence at each of the nine microaxicon lenses could be imaged using a 532 nm dichroic filter and optical microscopy. The Electronic Supplementary Information† provides details on the setup. The results showed that light emitted by the micronozzle array, was (a) predominantly conducted by the embedded multicore waveguide structure and (b) tightly focused in front of each nozzle. Fig. 4 shows multiple focal lines – one from each micronozzle. In this case, each axicon angle was 13° with 25 μm nozzle length and 66° post angle.Light focused by axicon lenses with larger angles remains confined inside the tip of the nozzle as expected from modelling.31,32 Imaging of light emission in air was attempted using a fine mist of dye solution but was largely unsuccessful. Modelling of the emission from a γ = 13° axicon lens in air (n ≈ 1.0) indicates, however, that the focal line should be outside the nozzle.31
The experiments largely validate the optical models31 and indicate that light guided by the multiple fiber cores is focused into each of the Taylor cones in front of the micronozzles where it will interact with the sample. In the following, we use near-infrared light instead of visible light at 532 nm to photo-thermally heat the solutions in the Taylor cone and thereby enhance the desolvation efficiency during ESI.
Laser-enhanced desolvation
We demonstrate photothermal excitation of the spray current through the focusing of light from a 532/1064 nm laser (EVO Laser, Wicked Lasers, Limassol, CY). A PEEK cross union was used to couple the light source, analyte-containing solution and voltage to the MES emitter, which electrosprayed towards an aluminum block that acted as the counter electrode (Fig. 5). The ion current was measured using a picoammeter (Keithley 6485, Keithley Instruments Inc., Cleveland, OH, USA) and acquired via LabVIEW software. Analysis of the laser emission spectrum indicated that near-infrared radiation at 1064 nm (max ∼100 mW) is emitted in addition to the 532 nm light generated by second harmonic generation.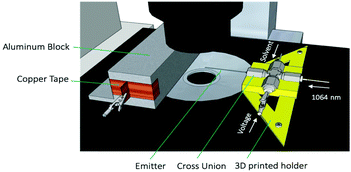 | ||
| Fig. 5 Drawing of the setup for electrospray testing. A custom-made 3D printed holder (yellow) houses the T-junction. The junction contains an electrode to apply a high-voltage bias to the solution and a multimode fiber optic cable to guide NIR light at 1064 nm into the emitter. The emitter sprays at an aluminum block that is connected to a pico-ammeter to measure the ion current. The assembly is placed in an inverted microscope to image the electrospray mode synchronously with the current measurement. See the Electronic Supplementary Information† for more detail. | ||
We measured the spray current from the emitter by generating a 3.5 kV bias from the cross-union (and from the emitter tip) to an aluminum block held at ground (Fig. 5). The distance from the nozzle tip to the block was 5 mm, and a solution of about 80% H2O, and 20% MeOH with 1% trifluoroacetic acid (TFA) solution was pumped through the nozzle at a flow rate of 300 nL min−1 using a syringe pump (Chemyx Fusion 100 Model, Stafford, Texas, USA).
A series of experiments at different bias voltages and sample flow rates helped identify the optimal electrospray conditions. Observation of the Taylor cones through a microscope showed a considerable boost in spray current when individual Taylor cones are formed in front of each nozzle (i.e. MES, Fig. 6b) as opposed to a coalescence of the nine Taylor cones into a single Taylor cone (Fig. 6a). We expect a three-fold increase in spray current when nine Taylor cones are formed instead of a single coalesced Taylor cone from previous theoretical predictions and experimental measurements.24,25 Depending on the axicon angle value, we observed experimental increases by more than a factor of three in some cases and less than three in other cases. Fig. 6 shows an increase in flow current by more than a factor of ten. Since the switch between the desired multispray emission and single-cone emission had to be initiated either by a voltage change or a change in flow rate, it is difficult to decouple the effect of the flow conditions from the effect that multiple Taylor cones have on the spray current. In Fig. 6 the switch to multispray mode was initiated by an increase in bias from 3000 V to 3500 V. We also note that the spray current is somewhat less stable (fluctuations of about 15%) when 9 Taylor cones are formed, compared to the single Taylor cone (∼5%). The cause of this effect is presently unknown.
The influence of the experimental variables (flow rate, bias voltage, electric field gradient) and parameters (channel number and channel diameter, nozzle hydrophobicity, solvent dielectric constant, conductivity, surface tension) on the spray conditions is complicated and subject to ongoing experimental and theoretical work.32,36–41 For example, we observed a small increase in spray current with increased bias voltage even if the spray mode does not change. Even though an increase in spray current does not necessarily imply an increase in detection efficiency in a mass spectrometer, one might expect the two parameters to be correlated if the ion transmission is approximately constant.
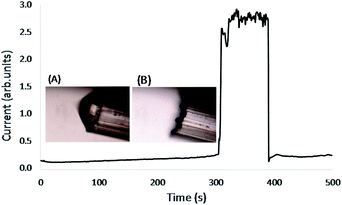
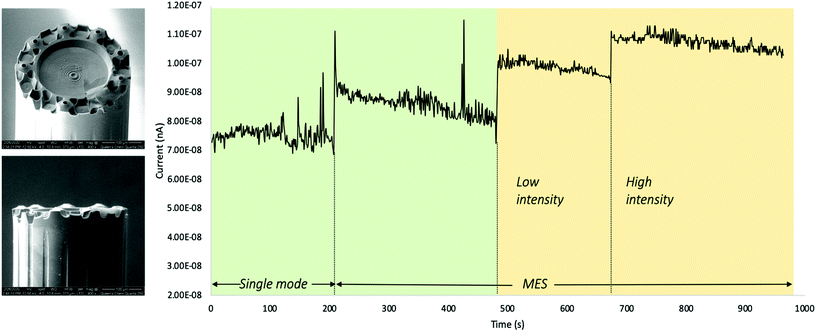
The effect of focusing NIR laser light into the Taylor cones was explored by measuring the spray current with and without laser radiation at the same conditions. The boost in spray current from the light-assisted desolvation is depicted in Fig. 7. We observe a step-wise increase of spray current as the single Taylor cone transforms into a multi-emitter spray (MES). While we expect an increase by a factor of three, we observe a much smaller increase of only 10%, since neither the single mode operation nor the multi electrospray mode are very stable at the applied voltage (3500 V) and solvent flow rate (800 nL min−1).
The current increases again when the laser is turned on at low power (about 20 mW at 1064 nm). The spray current reaches its maximum value when the laser power is increased to about 100 mW at 1064 nm while operating in MES mode. Other experiments (please see the Electronic Supplementary Information†) show that the decrease of spray current is as rapid as its increase when the laser is turned off. The rapid (<1 s) increase is consistent with a photothermal heating and desolvation process in front of the nozzle as expected for the small-angle axicon lenses in this experiment.
The gradual decrease of the spray current in each of the operating modes, has not been investigated. It is likely due to the accumulation of charges either on the aluminum block detector or on the nozzle tip.
When using multispray emitters with larger axicon angles, γ, light is expected to be predominantly reflected into the nozzle tip. We then observed similar increases of spray current but with slower response times. This is consistent with laser heating of the nozzle tip and the corresponding slow response due to the heat capacity of the fiber material.
The results in Fig. 7 indicate that the ion current rapidly increases as expected when the laser is turned on and that modulation of the ion current above 1 Hz is possible. It is also apparent that the ion signal is more stable when the solvent is laser heated at the nozzle. These experiments indicate that the micronozzles act as axicon lenses for laser light as expected.
Discussion and conclusion
This report demonstrates that arrays of electrospray emitters can be produced in a single step by simple etching. The resulting protruding nozzles allow for electrospray formation in front of each orifice and permit guiding and focusing of infrared light for selective heating of the solvent. In many regards the performance of the micro-nozzle array is surprising. For example, the optical quality of the axicon lenses is not actively controlled and is not improved by post-processing such as polishing, sintering or ablation. Also, it is apparent from SEM images that the cones forming the axicon lenses are concave tapered. Yet, the lenses work surprisingly well in collimating and focusing light as Fig. 4 clearly indicates. We think that the small size of the structures of less than 20 μm leads to imperfections and surface roughness features that are substantially smaller than the wavelength of the light (about 1 μm) and are therefore not distorting the wave fronts as much as one might expect.The cost of the fabrication of the emitters lies nearly entirely in the fabrication of the custom design MSF. A single MSF production run can readily produce kilometers of fiber, however, which allows for the fabrication of tens of thousands of emitter arrays – each with a length of 3–5 cm. The fabrication process is therefore commercially viable at larger production scale. Also, the etching process can be readily parallelized and scaled up using larger, and therefore more homogenous, etching solution volumes.
Finally, we note that the laser used for the experiments was not optimal for the photothermal excitation of water through its vibrational overtone bands. Excitation at the ν3 – fundamental band using e.g. an Er:YAG laser at a wavelength of 2.94 μm should allow for about 10![[thin space (1/6-em)]](https://www.rsc.org/images/entities/char_2009.gif) 000-fold more effective excitation.
000-fold more effective excitation.
In comparing the performance of the proposed system with other heating methods, we note that NIR heating using a laser has some advantages over using a hot sheath gas flow, or electric heating of the nozzle tip. The main advantage lies in a very fast modulation of ion current that is possible by modulating the intensity of the laser output. This allows for lock-in detection of weak ion signals and consequent boost in the signal-to-noise ratio. Also, the laser wavelength may be tuned to absorption features of either the solvent or of the analyte thereby allowing for either general or molecule-specific signal enhancement. The experimental complexity and cost of an all-optical setup such as ours is comparable to either a sheath gas system or an electrical heating system.
Compared to commercial tapered emitters, the MSF has the well-documented advantage of being largely resistant to clogging.16 This is likely due to the straight channels which contrast those of some emitters which have an internal taper. We noted that sometimes not all nozzles spray equally well, likely due to narrowing of the flow channels due to contaminants or variations of internal diameters arising from the fabrication process. Yet, none of the emitters clogged completely during the present study and many were used for several months.
Author contributions
The manuscript was written through contributions of all authors.Conflicts of interest
There are no conflicts to declare.Acknowledgements
We thank the Centre d'optique, photonique et laser (COPL) for fabricating and characterizing the micro-structured fibre. We also thank Adam Bernicky for technical assistance and Kyle Bachus for helpful discussions. HPL, RDO and ERG acknowledge financial support by the Natural Science and Engineering Research Council (NSERC) of Canada through the Discovery Grant and CREATE programs.References
- P. R. Chiarot, P. Sullivan and R. B. Mrad, J. Microelectromech. Syst., 2011, 20, 1241–1249 Search PubMed.
- M. Armano, et al. , Phys. Rev. Lett., 2016, 116, 231101 CrossRef CAS PubMed.
- G. Anderson, et al. , Phys. Rev. D, 2018, 98, 102005 CrossRef CAS.
- A. Jaworek, J. Mater. Sci., 2007, 42, 266–297 CrossRef CAS.
- R. Juraschek, T. Dülcks and M. Karas, J. Am. Soc. Mass Spectrom., 1999, 10, 300–308 CrossRef CAS.
- M. Karas, U. Bahr and T. Dülcks, Fresenius’ J. Anal. Chem., 2000, 366, 669–676 CrossRef CAS PubMed.
- A. Schmidt, M. Karas and T. Dülcks, J. Am. Soc. Mass Spectrom., 2003, 14, 492–500 CrossRef CAS PubMed.
- Y. Fu, PhD, Queen's University, 2015.
- K. Jin-Sung, Electrophoresis, 2001, 22, 3993–3999 CrossRef.
- L. F. Velasquez-Garcia, A. I. Akinwande and M. Martinez-Sanchez, J. Microelectromech. Syst., 2006, 15, 1272–1280 CrossRef.
- F. A. Hill, E. V. Heubel, P. P. d. Leon and L. F. Velásquez-García, J. Microelectromech. Syst., 2014, 23, 1237–1248 CAS.
- K. Bachus, PhD, Queen's University, 2017.
- P. Mao, R. Gomez-Sjoberg and D. Wang, Anal. Chem., 2013, 85, 816–819 CrossRef CAS PubMed.
- F. Benabid, F. Couny, J. C. Knight, T. A. Birks and P. S. Russell, Nature, 2005, 434, 488–491 CrossRef CAS PubMed.
- P. S. J. Russell, J. Lightwave Technol., 2006, 24, 4729–4749 Search PubMed.
- Y. Fu, S. Morency, K. Bachus, D. Simon, T. Hutama, G. T. T. Gibson, Y. Messaddeq and R. Oleschuk, Sci. Rep., 2016, 6, 21279 CrossRef PubMed.
- G. T. T. Gibson, R. D. Wright and R. D. Oleschuk, J. Mass Spectrom., 2011, 47, 271–276 CrossRef PubMed.
- J. T. Cox, I. Marginean, R. T. Kelly, R. D. Smith and K. Q. Tang, J. Am. Soc. Mass Spectrom., 2014, 25, 2028–2037 CrossRef CAS PubMed.
- R. Burdett, Amplitude Modulated Signals: The Lock-in Amplifier, in Handbook of Measuring System Design, ed. P. H. Sydenham and R. Thorn, 2005, DOI:10.1002/0471497398.mm588.
- R. T. Filla, A. M. Schrell, J. B. Coulton, J. L. Edwards and M. G. Roper, Anal. Chem., 2018, 90, 2414–2419 CrossRef CAS PubMed.
- Y. Zheng, H. Cao, Z. Zhou, X. Mei, L. Yu, X. Chen, G. He, Y. Zhao, D. Wu and D. Sun, Fibers Polym., 2019, 20, 1180–1186 CrossRef CAS.
- A. S. Levitt, C. E. Knittel, R. Vallett, M. Koerner, G. Dion and C. L. Schauer, J. Appl. Polym. Sci., 2017, 134, 44813 CrossRef PubMed.
- J. X. He, K. Qi, Y. M. Zhou and S. Z. Cui, Polym. Int., 2014, 63, 1288–1294 CrossRef CAS.
- K. Tang, Y. Lin, D. W. Matson, T. Kim and R. D. Smith, Anal. Chem., 2001, 73, 1658–1663 CrossRef CAS PubMed.
- J. S. Page, R. T. Kelly, K. Tang and R. D. Smith, J. Am. Soc. Mass Spectrom., 2007, 18, 1582–1590 CrossRef CAS PubMed.
- I. Marginean, R. T. Kelly, D. C. Prior, B. L. LaMarche, K. Tang and R. D. Smith, Anal. Chem., 2008, 80, 6573–6579 CrossRef CAS PubMed.
- I. Marginean, R. T. Kelly, J. S. Page, K. Q. Tang and R. D. Smith, Anal. Chem., 2007, 79, 8030–8036 CrossRef CAS PubMed.
- R. T. Kelly, J. S. Page, K. Q. Tang and R. D. Smith, Anal. Chem., 2007, 79, 4192–4198 CrossRef CAS PubMed.
- L. Parvin, M. C. Galicia, J. M. Gauntt, L. M. Carney, A. B. Nguyen, E. Park, L. Heffernan and A. Vertes, Anal. Chem., 2005, 77, 3908–3915 CrossRef CAS PubMed.
- X. Wu, R. D. Oleschuk and N. M. Cann, Analyst, 2012, 137, 4150–4161 RSC.
- K. Bachus, E. S. de Lima Filho, K. Wlodarczyk, R. Oleschuk, Y. Messaddeq and H. P. Loock, Opt. Express, 2016, 24, 20346–20358 CrossRef CAS PubMed.
- E. Groper, M.Sc, Queen's University, 2020.
- R. T. Kelly, J. S. Page, Q. Luo, R. J. Moore, D. J. Orton, K. Tang and R. D. Smith, Anal. Chem., 2006, 78, 7796–7801 CrossRef CAS PubMed.
- A. Kotsas, H. Ghafouri-Shiraz and T. S. M. Maclean, Opt. Quantum Electron., 1991, 23, 367–378 CrossRef CAS.
- M. Kawachi, T. Edahiro and H. Toba, Electron. Lett, 1982, 18, 71–72 CrossRef CAS.
- J. Rosell-Llompart, J. Grifoll and I. G. Loscertales, J. Aerosol Sci., 2018, 125, 2–31 CrossRef CAS.
- M. Cloupeau and B. Prunet-Foch, J. Electrost., 1990, 25, 165–184 CrossRef CAS.
- J. M. Grace and J. C. M. Marijnissen, J. Aerosol Sci., 1994, 25, 1005–1019 CrossRef CAS.
- A. Jaworek and A. Krupa, J. Aerosol Sci., 1999, 30, 873–893 CrossRef CAS.
- S. Verdoold, L. L. F. Agostinho, C. U. Yurteri and J. C. M. Marijnissen, J. Aerosol Sci., 2014, 67, 87–103 CrossRef CAS.
- I. Marginean, P. Nemes and A. Vertes, Phys. Rev. E: Stat., Nonlinear, Soft Matter Phys., 2007, 76, 1–6 CrossRef PubMed.
Footnote |
| † Electronic supplementary information (ESI) available: Details on the dimensions of the MSF and its fabrication process. The etching process is described in greater detail and SEM images of micronozzle arrays obtained under different etching conditions are presented. Additional optical micrographs show the focusing of an emitter similar to Fig. 4. Finally, we present details on the setup used to acquire the optical micrographs and to measure the spray current (file type: PDF). See DOI: 10.1039/d1an00264c |
| This journal is © The Royal Society of Chemistry 2021 |

