Measurement of the effective electric field radius on digital ion trap spectrometer†
Fuxing
Xu
*,
Weimin
Wang‡
 ,
Liuyu
Jin
,
Bingjun
Qian
and
Chuan-Fan
Ding
*
,
Liuyu
Jin
,
Bingjun
Qian
and
Chuan-Fan
Ding
*
Key Laboratory of Advanced Mass Spectrometry and Molecular Analysis of Zhejiang Province, Institute of Mass Spectrometry, School of Materials Science & Chemical Engineering, Ningbo University, Ningbo, Zhejiang 315211, China. E-mail: dingchuanfan@nbu.edu.cn; xufuxing@nbu.edu.cn; Tel: +86-0574-87605710
First published on 26th April 2021
Abstract
The effective electric field radius is a fundamental parameter of ion traps, and it has a significant influence on ion-trapping capability, signal intensity, mass range and some other properties of the ion trap. For a quadrupole ion trap built with ideal hyperbolic electrodes, its effective electric field radius can be obtained by its geometrical size, while it is very difficult to obtain the effective electric field radius for a non-hyperbolic ion trap. In this study, the effective electric field radius of a linear ion trap and some ceramic rectilinear ion traps (cRITs) were investigated via the digital ion trap technology. The dipole frequency of supplementary AC for excitation was locked at a certain value of the main RF trapping wave, and the characteristic q values for excitation could be determined accordingly. The q values could be further used to calculate the effective electric field radius through theoretical calculations. A linear equation had been fitted between the q values for excitation and the square of period T2 through experiments subsequently. The relative deviation between the measured electric field radius and the simulative electric field radius is less than 2%. The simulation results and experimental validation show that the approach has predictive power for modeling and measuring the effective field radius of non-hyperbolic ion traps. It is certainly significant for further understanding the performances of non-hyperbolic quadrupole systems.
Introduction
Mass spectrometry (MS) plays an increasingly important role in chemical and biological analyses due to its wide applicability, as well as fast and high sensitivity and specificity. Among the different types of mass spectrometers, the ion trap (IT) mass spectrometer is used in numerous cases because of its specific characters of ion storage, multiple-stage mass-selected isolation, ion dissociation and molecular structure analysis.1–3 The pioneer ion trap called Paul Trap is a 3D hyperbolic ion trap, which could generate an ideal quadrupole electric field. An ion trap by the application of the U + V![[thin space (1/6-em)]](https://www.rsc.org/images/entities/char_2009.gif) cos(Ωt) voltage at the ring electrode can be described by the stability diagram related to the a and q variables that are defined as
cos(Ωt) voltage at the ring electrode can be described by the stability diagram related to the a and q variables that are defined as | (1) |
 | (2) |
Numerous evolved ion trap analyzers have been explored and fabricated during past decades, such as cylindrical ion trap (CIT), rectilinear ion trap (RIT), printed circuit board ion trap (PCBIT), mesh-electrode linear ion trap (MELIT), triangular-electrode linear ion trap (TeLIT) and halo ion trap.8–13 For these ion traps, ions are trapped in the axial direction instead of in the center, which benefits the trapping capacity, while the effective electric field radius of these ion trap analyzers cannot be directly calculated through the eqn (1) and (2) as they are not ideal hyperbolic electrodes.
The digital ion trap (DIT) is suited for theoretical studying and miniaturization and has been used to reduce the chemical mass shifts14 and detecting biological molecules.15 The ion trapping field and excitation electric field in DIT were provided by switching voltages. The timings of these switching circuits are controlled by high-precision digital circuits. It is normally the frequency rather than the amplitude of the driving voltage that is scanned during a mass scan. Compared with the conventional RF resonator method, DIT has notable advantages such as analysis of higher m/z ions at low RF voltages that could prevent the electrical discharge and digital asymmetric wave isolation (DAWI). Our recent research results found that highly efficient collision-induced dissociation (CID) can be realized by simply changing the duty cycle of the resonance excitation waveform and the associated frequency.16
In this study, the effective electric field radius of a linear ion trap and some ceramic rectilinear ion traps (cRIT) were investigated using the digital ion trap technology. The dipole frequency of supplementary AC for excitation was locked at a certain ratio value of the main RF trapping wave, and the characteristic q values for excitation could be determined accordingly. The q values could be further used to calculate the effective electric field radius through theoretical calculations. A linear equation had been fitted between the q values for excitation and the square of period T2 through experiments subsequently. For cRITs with x0 × y0 = 5.0 mm × 5.0 mm, 5.50 mm × 5.00 mm, 6.50 mm × 5.00 mm, and 7.00 mm × 5.00 mm, their measured electric field radius are 4.89 mm, 5.15 mm, 5.79 mm and 6.10 mm, respectively. The relative deviation between the recorded electric field radius and the simulative electric field radius was less than 2%. The simulation results and experimental validation showed that the approach has the predictive power for modeling and measuring the effective field radius of non-hyperbolic ion traps. It is certainly significant for further understanding the performances of non-hyperbolic quadrupole systems.
Experimental
Theory of the digital ion trap technology
Balanced rectangular waveforms RF with similar amplitude but in the opposite phase were applied to the ring electrode. The dipolar frequency of supplementary AC for excitation was derived digitally by dividing down the RF frequency and coupling to the RF similar to conventional linear ion trap mode on the x-axis.17 Stability conditions of the ion motion in a pure quadrupole field with digital waveforms may still be expressed in terms of the conventional Mathieu (a, q),18 as shown in eqn (3). We generally define U to be the DC component and V to be the average RF amplitude. In the present case where a square wave (50% duty cycle rectangular wave) is used, U is the mean value between the positive and negative voltage levels, and V is the half-voltage difference between the positive and negative voltage levels. The first region of stability in the (a, q) plane for a square wave looks similar to a sinusoidal waveform. In the following discussion, we will assume no DC voltage on the ring electrode for convenience. For the square wave, the q value at the boundary of the first stability region was given as 0.7125, while it is 0.908 for the sinusoidal wave.19The relationship between the q values and m/z in DIT can be expressed as follows:20
 | (3) |
Then, the effective electric field radius r could be expressed as:
 | (4) |
According to eqn (4), r can only be calculated when m/z, V, period T and q are known. In the experiment, m/z and V can be pre-set, and q can be deduced by eqn (5). According to the study by Ding, when the digital waveform is used to drive an ion trap within the first region of stability, the relationship between q and β can be expressed as below:20
 | (5) |
The excitation waveform may be generated by the frequency division of the trapping waveform. At a division ratio of n, the excitation waveform has a period n times the period of the trapping waveform. β is a stability parameter (characteristic exponent), which determines the ion oscillation frequencies. In this study, the relations among q, β and n were calculated using eqn (5) and (6), respectively, and they are listed in Table S1.†17
 | (6) |
During the ion ejection scan, ions are brought into resonance with the dipole AC excitation field and ejected from the trapping region in the order of their mass-to-charge ratios. In order to use a fixed q value for excitation or ejection, the frequency of the AC should be scanned together with the primary trapping frequency RF. Also, the secular frequency ωs of ions can be expressed in terms of the β parameters as follows:
 | (7) |
Determining the RF frequency and dipole AC frequency through fragmentation efficiency
CID (collision-induced dissociation) is usually realized when the dipole AC frequency matches the secular frequency ωs. AC is a supplementary potential coupled to the primary radio frequency, and the ion resonates excitedly and absorbs energy from the electric field when the frequency of AC equals the secular frequency of the selected precursor ion, which would increase its kinetic energy dramatically. Collisions of the ion with the buffer gas such as helium, nitrogen or argon will convert the kinetic energy into ion internal energy. Also, eventually, the ions with high internal energy will overcome the chemical bond energy barriers and dissociate into fragments. The ion resonance excitation frequency was found through experiments by observing the CID mass spectrum. The fragmental ion with the highest fragmentation efficiency should correspond to the “right” frequency of AC.17In order to use a fixed ejection q value, the frequency of the supplementary AC should be scanned together with the primary trapping frequency. The supplementary AC potential is divided from the main RF power supply, and therefore, the RF frequency can also be obtained when the ion CID process is found in the experiment.
Instrumentation
All experiments were performed on a homemade three-stage differential vacuum pumping ion trap mass spectrometry system, as previously described.21 An electrospray ionization (ESI) source was used to produce a positive sample ion from its solution. A linear ion trap (LIT) with hyperbolic electrodes (x0 × y0 = 4 mm × 4 mm) was placed in the third vacuum chamber to perform mass analysis, as depicted in Fig. 1a. Several gold-plated ceramic-based rectilinear ion traps (cRITs)21 with rectangular cross-section of x0 × y0 = 5.00 mm × 5.00 mm, 5.50 mm × 5.00 mm, 6.50 mm × 5.00 mm, and 7.00 mm × 5.00 mm, were used for further testing, and one of them is depicted in Fig. 1b. The pressure was kept at 1.0 × 10⁻⁵ Torr for mass analysis and 8.0 × 10⁻⁵ Torr for CID experiments. A channeltron electron multiplier (CEM 4879, Burle/Photonis, USA) was used as an ion detector. The schematic of a whole digital ion trap mass spectrometer is presented in Fig. 1c.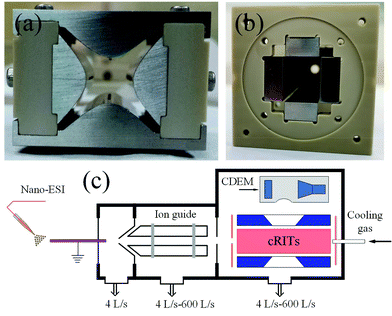 | ||
| Fig. 1 (a) Photograph of the hyperbolic linear ion trap, (b) photograph of the ceramic-based rectilinear ion trap, and (c) the schematic of the digital ion trap mass spectrometer. | ||
Operation parameters of the digital ion trap mass spectrometer are presented in Table S2.† The ion trap operation mode consists of the following six steps:22 (i) injection, (ii) cooling, (iii) DAWI, (iv) CID, (v) mass analysis and (vi) emptying. At the injection stage, the voltage of the front ion gate is lowered, and the ions from the ionization cell are transferred through the static lens and enter the linear ion trap. After the cooling stage (10–100 ms), the precursor ions were isolated by the digital asymmetric waveform isolation (DAWI) method.23 Then, the ions are resonated excitedly by introducing collision gas. Finally, the ions are scanned out of the trap by resonance ejection and detected by a continuous dynode electron multiplier. The amplitude of the digital dipole waveform may be adjusted, and the dipole frequency was locked at a certain value of the main trapping wave frequency. The resonance excitation and ejection take place on which q values are listed in Table S1.†
Sample preparation
Reserpine was purchased from Aladdin-Reagent Ltd (Shanghai, China), and its solution was prepared by dissolving raw reagents with methanol/water (50![[thin space (1/6-em)]](https://www.rsc.org/images/entities/char_2009.gif) :
:![[thin space (1/6-em)]](https://www.rsc.org/images/entities/char_2009.gif) 50 V/V, 0.5% acetic acid) into 5 × 10⁻⁵ mol L−1. In the experiments, the solution was pumped into an ESI capillary with an i.d. of 100 μm (TSP100200, Polymicro Technologies, L.L.C., Phoenix, AZ, USA) with a syringe pump (SP100i, World Precision Instruments, Inc., Sarasota, FL, USA.) at 1 μL min−1.
50 V/V, 0.5% acetic acid) into 5 × 10⁻⁵ mol L−1. In the experiments, the solution was pumped into an ESI capillary with an i.d. of 100 μm (TSP100200, Polymicro Technologies, L.L.C., Phoenix, AZ, USA) with a syringe pump (SP100i, World Precision Instruments, Inc., Sarasota, FL, USA.) at 1 μL min−1.
Results and discussion
The measurement of the effective electric field radius of a linear ion trap
A hyperbolic electrode linear ion trap was built, and its effective electric field radius was measured first for method validation. It is constructed with four 50 mm long stainless-steel hyperbolic electrodes with x0 = y0 = 4.0 mm, and as y0 represents the distance from the center to the y-electrodes and x0 is the distance from the center to the x-electrodes, then its theoretic geometrical electric field radius should be r = 4.0 mm. According to the above discussion and eqn (5), for a given m/z ion, when a resonance excitation point q is selected, the optimum RF and the associated resonance frequency of AC can be found by calculating the fragmentation efficiency. To obtain the maximum fragmentation efficiency, it is necessary to measure the intensity of the precursor and fragment ions. The fragmentation efficiency was calculated using the following formula:24 | (8) |
In this experiment, the CID experimental mass spectrometry results at each q value and the obtained optimum trapping waveform RF are shown in Fig. 2. Fig. 2a shows the isolated precursor m/z = 609 ions through the DAWI method, and Fig. 2b–f shows the CID results at different q values and optimized RF. It was found that, for m/z = 609 reserpine ions, the maximum fragmentation efficiencies were obtained at 906.62 kHz, 890.47 kHz, 865.05 kHz, 838.22 kHz, and 811.03 kHz when the corresponding q values were at 0.3522, 0.3661, 0.3890, 0.4147, and 0.4435. The m/z = 448 [M − C10NOH10]+, 397 [M − C10O5H11]+ and 365 [M − C10O5H11 − CH3O]+ are the series of fragments from the isolated precursor ion, which had been introduced by Collings.25Table 1 lists the optimum trapping waveform frequencies at different q values and corresponding fragmentation efficiency. The list shows that the precursor ions almost dissociated through resonance excitation at this trapping frequency of RF because the fragmentation efficiency was close to 100% gradually. It was also interesting to find that the fragmentation efficiency was increasing with the q value, and the reason might be that the fragmentation is dependent on q.24 The secular frequency is dependent on β, which is a function of q, and it is expected based upon an examination of eqn (5), indicating that increasing the secular frequency benefitted the resonance excitation.25
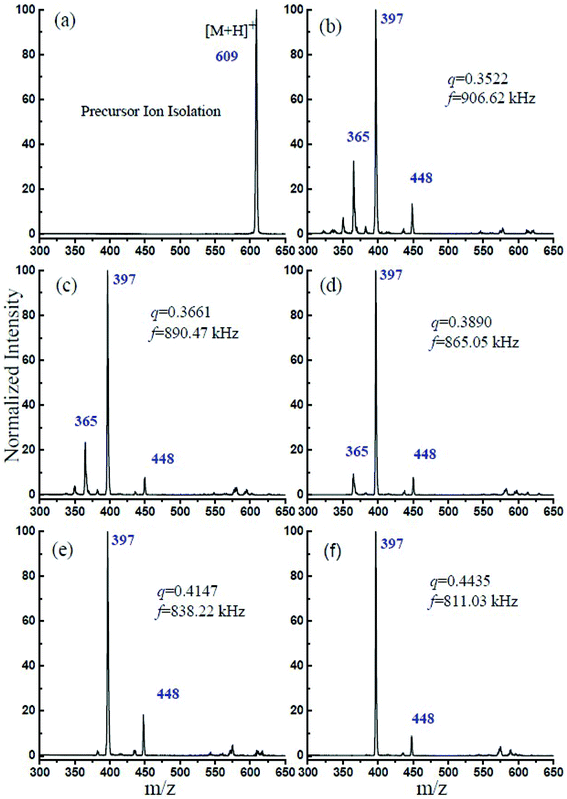 | ||
| Fig. 2 (a) Isolation of the precursor ion of reserpine m/z 609. (b–f) The optimum trapping waveform frequency at different q values for maximum CID efficiency. | ||
| q | f (kHz) | T (μs) | 1/f2(μs)2 | Fragmentation efficiency (m = 397/m = 609) × 100% |
|---|---|---|---|---|
| 0.3522 | 906.62 | 1.102 | 1.2166 | 74.25% |
| 0.3661 | 890.47 | 1.123 | 1.2611 | 78.66% |
| 0.3890 | 865.05 | 1.156 | 1.3363 | 85.66% |
| 0.4147 | 838.22 | 1.193 | 1.4232 | 88.05% |
| 0.4435 | 811.03 | 1.233 | 1.5203 | 90.22% |
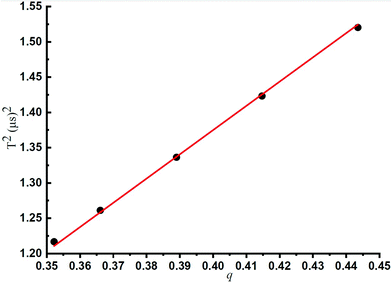
Fig. 3 shows the linear relationship between q and f, which has been illustrated in Table 1. Under the same experimental conditions, the lower the q values, the higher the trapping waveform frequency. A linear relationship between q and the square of T (1/f2 = T2) was observed according to the experimental results, and this is very consistent with the theoretical prediction by eqn (3). The least-squares best-fit linear curve was obtained with Table 1 data subsequently. It could be deduced that for any mass-selected ion in this ion trap using DIT, its optimum trapping waveform frequency f for the maximum CID efficiency could be calculated at any q according to eqn (9) directly.
It could also be deduced that for any mass-selected ion in this ion trap using DIT, and the effective electric field radius could be calculated according to eqn (4). In this case, the effective electric field radius of this linear ion trap could be deduced to 4.07 mm, and it is very close to the theoretical value of r = 4.0 mm, which is obtained by its geometric structure. Such practice is better than just simply using one of the geometrical measured values or directly calculating the effective electric field radius with eqn (4) because fitting to multiple experiment points can reduce the measurement error.
 | (9) |
Measurement of the effective electric field radius of cRITs through experiments and simulation
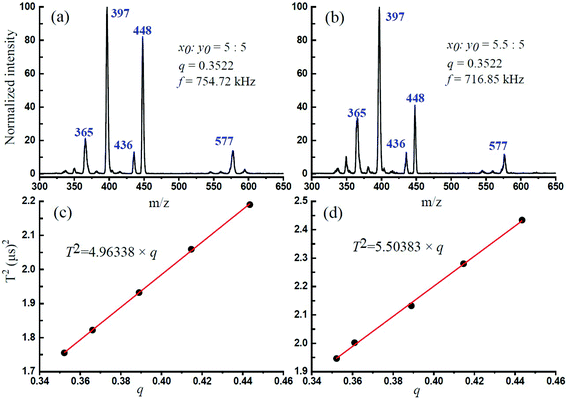
Several ceramic-based rectilinear ion traps (cRITs) with different geometries were built, and their effective electric field radius, r, was investigated by the above-mentioned method. The maximum fragmentation efficiencies for x0 × y0 = 5.00 mm × 5.00 mm and 5.50 mm × 5.00 mm were achieved, and their corresponding optimum trapping waveform frequency was at 754.72 kHz and 716.85 kHz, respectively, when q was set at 0.3522. Fig. 4a and b present the experimental mass spectra results, where the precursor m/z = 609 ions are indiscernible from the background, while the main fragmental ion peaks m/z = 448, 397 and 365 could be found. The m/z at 577 and 436 might be some tiny fragmental ions from [M − OCH3]+ and [M − C11NOH10]+. The maximum fragmentation efficiencies for x0 × y0 = 6.50 mm × 5.00 mm and 7.00 mm × 5.00 mm had also been reached, and their experimental results are presented in Fig. S1† when q was set at 0.3522.Fig. 4c and d show the linear relationship between q and T2 for x0 × y0 = 5.0 mm × 5.0 mm and 5.50 mm × 5.00 mm ion trap analyzers, which are listed in Table 2. The linear equation from the least-squares best-fit could be used to calculate the optimum trapping waveform frequency f for the maximum CID efficiency. Besides, for any mass-selected ion in this ion trap using DIT, the effective electric field radius can be calculated according to the above-mentioned eqn (4). In this case, the effective electric field radius of these four rectangular ion traps was 4.89, 5.15, 5.79 and 6.10 mm for x0 × y0 = 5.00 mm × 5.00 mm, 5.50 mm × 5.00 mm, 6.50 mm × 5.00 mm and 7.00 mm × 5.00 mm, respectively, and it is very close to their geometrical radius.
| q | RIT1 (x0![[thin space (1/6-em)]](https://www.rsc.org/images/entities/char_2009.gif) : :![[thin space (1/6-em)]](https://www.rsc.org/images/entities/char_2009.gif) y0 = 5 y0 = 5![[thin space (1/6-em)]](https://www.rsc.org/images/entities/char_2009.gif) : :![[thin space (1/6-em)]](https://www.rsc.org/images/entities/char_2009.gif) 5) 5) |
RIT2 (x0![[thin space (1/6-em)]](https://www.rsc.org/images/entities/char_2009.gif) : :![[thin space (1/6-em)]](https://www.rsc.org/images/entities/char_2009.gif) y0 = 5.5 y0 = 5.5![[thin space (1/6-em)]](https://www.rsc.org/images/entities/char_2009.gif) : :![[thin space (1/6-em)]](https://www.rsc.org/images/entities/char_2009.gif) 5) 5) |
RIT3 (x0![[thin space (1/6-em)]](https://www.rsc.org/images/entities/char_2009.gif) : :![[thin space (1/6-em)]](https://www.rsc.org/images/entities/char_2009.gif) y0 = 6.5 y0 = 6.5![[thin space (1/6-em)]](https://www.rsc.org/images/entities/char_2009.gif) : :![[thin space (1/6-em)]](https://www.rsc.org/images/entities/char_2009.gif) 5) 5) |
RIT4 (x0![[thin space (1/6-em)]](https://www.rsc.org/images/entities/char_2009.gif) : :![[thin space (1/6-em)]](https://www.rsc.org/images/entities/char_2009.gif) y0 = 7 y0 = 7![[thin space (1/6-em)]](https://www.rsc.org/images/entities/char_2009.gif) : :![[thin space (1/6-em)]](https://www.rsc.org/images/entities/char_2009.gif) 5) 5) |
||||
|---|---|---|---|---|---|---|---|---|
| f (kHz) | T 2 (μs)2 | f (kHz) | T 2 (μs)2 | f (kHz) | T 2 (μs)2 | f (kHz) | T 2 (μs)2 | |
| 0.3522 | 754.72 | 1.755 | 716.85 | 1.946 | 641.02 | 2.059 | 606.06 | 2.434 |
| 0.3661 | 740.74 | 1.822 | 706.71 | 2.002 | 626.96 | 2.148 | 591.72 | 2.544 |
| 0.3890 | 719.42 | 1.932 | 684.93 | 2.122 | 606.06 | 2.265 | 574.71 | 2.723 |
| 0.4147 | 696.86 | 2.059 | 662.25 | 2.280 | 588.24 | 2.418 | 560.22 | 2.890 |
| 0.4435 | 675.68 | 2.190 | 641.03 | 2.434 | 571.43 | 2.592 | 540.54 | 3.063 |
Axsim is the software for the simulation of ion motion in dynamic mass spectrometry and was programmed by M. Sudakov,26 and it was adopted to simulate the ion motion and spectral analysis in cRITs with different geometries. Detailed conditions of the simulation are presented in Table S3.† The secular frequency ωs was simulated according to the experimental conditions, which means that the RF equals optimum trapping waveform frequency. β could be deduced from eqn (7), and the q values could be calculated from eqn (5). The detailed calculation process for cRITs with different sizes is presented in Tables S4−S7.†
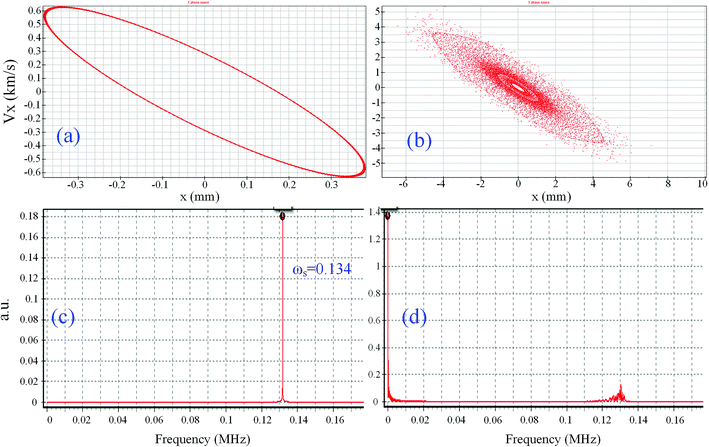
Table 3 compares the simulated electric radius (rs) with the geometrical radius (r0) and the experimental results (re). It could be found that the results of rs are very close to re and that the error was less than 2%, while the geometrical radius r0 has a specific deviation with the increase in the size in the x-direction. In Fig. 5a and b, the simulative ion trajectory in the cRIT (x0 × y0 = 5.50 mm × 5.00 mm) using the digital rectangular wave was presented, and corresponding frequency spectra to show if there is dipole AC or not proved that the resonance excitation and ejection occurred in the ion trap, where the observed ωs = 0.134 is the secular frequency of the reserpine ion in the cRIT with x0 × y0 = 5.50 mm × 5.00 mm, and the recorded ωs = 0 is the simulative frequency spectra of reserpine in the cRIT when there is an AC, which means that the ions resonated excitedly immediately. It also could be found that the simulative diameter of the ion cloud was within 5.5 mm approximately.
| cRIT sizes | Geometrical radius (mm) | Experimental radius (mm) | Simulative radius (mm) |
|---|---|---|---|
cRIT1 (x0![[thin space (1/6-em)]](https://www.rsc.org/images/entities/char_2009.gif) : :![[thin space (1/6-em)]](https://www.rsc.org/images/entities/char_2009.gif) y0 = 5 y0 = 5![[thin space (1/6-em)]](https://www.rsc.org/images/entities/char_2009.gif) : :![[thin space (1/6-em)]](https://www.rsc.org/images/entities/char_2009.gif) 5) 5) |
5.00 | 4.89 | 4.804 |
cRIT2 (x0![[thin space (1/6-em)]](https://www.rsc.org/images/entities/char_2009.gif) : :![[thin space (1/6-em)]](https://www.rsc.org/images/entities/i_char_2009.gif) y0 = 5.5 y0 = 5.5![[thin space (1/6-em)]](https://www.rsc.org/images/entities/char_2009.gif) : :![[thin space (1/6-em)]](https://www.rsc.org/images/entities/char_2009.gif) 5) 5) |
5.50 | 5.15 | 5.046 |
cRIT3 (x0![[thin space (1/6-em)]](https://www.rsc.org/images/entities/char_2009.gif) : :![[thin space (1/6-em)]](https://www.rsc.org/images/entities/char_2009.gif) y0 = 6.5 y0 = 6.5![[thin space (1/6-em)]](https://www.rsc.org/images/entities/char_2009.gif) : :![[thin space (1/6-em)]](https://www.rsc.org/images/entities/char_2009.gif) 5) 5) |
6.50 | 5.79 | 5.598 |
cRIT4 (x0![[thin space (1/6-em)]](https://www.rsc.org/images/entities/char_2009.gif) : :![[thin space (1/6-em)]](https://www.rsc.org/images/entities/char_2009.gif) y0 = 7 y0 = 7![[thin space (1/6-em)]](https://www.rsc.org/images/entities/char_2009.gif) : :![[thin space (1/6-em)]](https://www.rsc.org/images/entities/char_2009.gif) 5) 5) |
7.00 | 6.10 | 5.890 |
Conclusion
The methodfor the determination of the effective electric field radius of the non-hyperbolic ion trap was developed and validated. The field radius of several rectilinear ion traps was investigated by both experiments and simulations using the digital ion trap (DIT) technology. The mass-selected m/z ion resonated excitedly and dissociated by digital waveform, and the ion resonance excitation frequency was determined by calculating the fragmentation efficiency. Thus, the electric field radius can be deduced by the measured frequency f at pre-selected q, V and m/z values. The linear relation obtained in the experiment agreed with the theoretic relationship very well, and the fitted coefficient can be used to determine the electric field radius with an error of less than 2%. The simulation result and experiment validation showed that the above approach displays potential for modeling and measuring the effective field radius of non-hyperbolic ion traps.Author contributions
Fuxing Xu: conceptualization, experiments, methodology, investigation and writing – original draft; Weimin Wang: methodology, simulation, investigation, writing – review and editing, and resources; Jin Liuyu and Bingjun Qian: review and editing; Chuan-Fan Ding: writing – review and editing, funding acquisition and supervision.Conflicts of interest
The authors declare no competing financial interest.Acknowledgements
This work is sponsored by the National Natural Science Foundation of China (No. 21803013, 21927805).References
- Y. Wang, X. Zhang, Y. Zhai, Y. Jiang, X. Fang, M. Zhou, Y. Deng and W. Xu, Anal. Chem., 2014, 86, 10164–10170 CrossRef CAS PubMed.
- L. Li, X. Zhou, J. W. Hager and Z. Ouyang, Anal. Chem., 2014, 139, 4779–4784 CAS.
- Z. Xu, T. Jiang, Q. Xu, Y. Zhai and W. Xu, Anal. Chem., 2019, 91, 13838–13846 CrossRef CAS PubMed.
- R. E. March, F. A. Londry and R. L. Alfred, J. Mass Spectrom., 2010, 27, 1151–1152 Search PubMed.
- Y. Tian, J. Higgs, A. Li, B. Barney and D. E. Austin, J. Mass Spectrom., 2014, 49, 233–240 CrossRef CAS PubMed.
- Z. Ouyang and R. G. Cooks, Annu. Rev. Anal. Chem., 2009, 2, 187–214 CrossRef CAS PubMed.
- R. E. March, Rapid Commun. Mass Spectrom., 1998, 12, 1543–1554 CrossRef CAS.
- L. S. Riter, Y. Peng, R. J. Noll, G. E. Patterson, T. Aggerholm and R. G. Cooks, Anal. Chem., 2002, 74, 6154–6162 CrossRef CAS PubMed.
- W. P. Peng, M. P. Goodwin, Z. Nie, M. Volny, Z. Ouyang and R. G. Cooks, Anal. Chem., 2008, 80, 6640–6649 CrossRef CAS PubMed.
- D. Jiang, G.-Y. Jiang, X.-X. Li, F. Xu, L. Wang, L. Ding and C.-F. Ding, Anal. Chem., 2013, 85, 6041–6046 CrossRef CAS.
- L. Wang, F. Xu, X. Dai, X. Fang and C.-F. Ding, J. Am. Soc. Mass Spectrom., 2014, 25, 548–555 CrossRef CAS PubMed.
- Y. Xiao, Z. Ding, C. Xu, X. Dai, X. Fang and C.-F. Ding, Anal. Chem., 2014, 86, 5733–5739 CrossRef CAS.
- M. Wang, H. E. Quist, B. J. Hansen, Y. Peng, Z. Zhang, A. R. Hawkins, A. L. Rockwood, D. E. Austin and M. L. Lee, J. Am. Soc. Mass Spectrom., 2011, 22, 369–378 CrossRef CAS PubMed.
- L. Sun, B. Xue, Z. Huang, P. Cheng and L. Ma, J. Am. Soc. Mass Spectrom., 2018, 29, 1386–1393 CrossRef CAS PubMed.
- K. W. Lee, C. P. Harrilal, L. Fu, G. S. Eakins and S. A. Mcluckey, Int. J. Mass Spectrom., 2020, 458, 116437 CrossRef CAS PubMed.
- F. Xu, C. Xu, L. Ding, M. Zhou and C.-F. Ding, Int. J. Mass Spectrom., 2018, 428, 29–34 CrossRef CAS.
- F. Xu, Q. Dang, X. Dai, X. Fang, Y. Wang, L. Ding and C.-F. Ding, J. Am. Soc. Mass Spectrom., 2016, 27, 1351–1356 CrossRef CAS PubMed.
- N. V. Konenkov, M. Sudakov and D. J. Douglas, J. Am. Soc. Mass Spectrom., 2002, 13, 597–613 CrossRef CAS PubMed.
- A. Berton, P. Traldi, L. Ding and F. L. Brancia, J. Am. Soc. Mass Spectrom., 2008, 19, 620–625 CrossRef CAS.
- L. Ding, M. Sudakov, F. L. Brancia, R. Giles and S. Kumashiro, J. Mass Spectrom., 2004, 39, 471–484 CrossRef CAS.
- L. Wang, F. Xu and C.-F. Ding, Rapid Commun. Mass Spectrom., 2012, 26, 2068–2074 CrossRef CAS PubMed.
- F. Xu, L. Wang, X. Dai, X. Fang and C.-F. Ding, J. Am. Soc. Mass Spectrom., 2014, 25, 556–562 CrossRef CAS PubMed.
- F. L. Brancia, B. Mccullough, A. Entwistle, J. G. Grossmann and L. Ding, J. Am. Soc. Mass Spectrom., 2010, 21, 1530–1533 CrossRef CAS PubMed.
- B. A. Collings, J. Am. Soc. Mass Spectrom., 2007, 18, 1459–1466 CrossRef CAS PubMed.
- B. A. Collings, W. R. Stott and F. A. Londry, J. Am. Soc. Mass Spectrom., 2003, 14, 622–634 CrossRef CAS.
- M. Sudakov, User's Manual Version 2010, St. Petersburg, 2010 Search PubMed.
Footnotes |
| † Electronic supplementary information (ESI) available: Related parameters of the digital ion trap mass spectrometer; Introduction to the simulation process with Axsim; Measurement of the effective electric field radius through experiments for cRITs with x0 × y0 = 6.50 mm × 5.00 mm and x0 × y0 = 7.00 mm × 5.00 mm when q was fixed at 0.3522. See DOI: 10.1039/d1an00468a |
| ‡ These authors are contributed equal. |
| This journal is © The Royal Society of Chemistry 2021 |

