Ruthenium red: a highly efficient and versatile cell staining agent for single-cell analysis using inductively coupled plasma time-of-flight mass spectrometry†
Wen
Qin
 a,
Hans-Joachim
Stärk
a and
Thorsten
Reemtsma
 *ab
*ab
aDepartment of Analytical Chemistry, Helmholtz Centre for Environmental Research – UFZ, Permoserstrasse 15, 04318, Leipzig, Germany. E-mail: thorsten.reemtsma@ufz.de
bInstitute of Analytical Chemistry, University of Leipzig, Linnéstrasse 3, 04103, Leipzig, Germany
First published on 13th October 2021
Abstract
Staining of biological cells with heavy metals can increase their visibility in mass spectrometry. In this study, the potential of ruthenium red (RR) as a staining agent for single-cell analysis by inductively coupled plasma time-of-flight mass spectrometry (SC-ICP-TOF-MS) is explored using two different yeast strains and one algal species. Time-of-flight mass spectrometry allows the simultaneous detection of Ru and multiple intrinsic elements in single cells. Ru has a better correlation with Mg than with P in Saccharomyces cerevisiae (S. cerevisiae) cells. For the three tested strains, the staining efficiency of RR exceeded 96%; the staining strengths were 30–32 ag μm−2 for the yeast cells and 59 ag μm−2 for the algal cells. By deriving the cell volume of single cells from their Ru mass, the concentration of Mg and P in individual cells of S. cerevisiae can be calculated. Elemental concentrations of Mg and P were highly variable in the cell individuals, with their 25–75 percentile values of 0.10–0.19 and 0.76–2.07 fg μm−3, respectively. RR staining has several advantages: it is fast, does not affect cell viability and is highly efficient. Provided that the shape of the individual cells of a culture is similar, Ru staining allows the elemental content to be directly correlated with the cell volume to accurately calculate the intracellular concentration of target elements in single cells. Therefore, RR can be a promising cell staining agent for future application in SC-ICP-TOF-MS research.
Introduction
It is well-known that cells from the same population may differ in elemental content due to changes in their surroundings or differences in cell phases and genetic expression. This phenomenon is called cell heterogeneity. To study cell heterogeneity and the factors influencing it in more detail, analysis on a single-cell level is required. One of the earliest uses of the SC-ICP-MS method was reported by Li et al.1 They determined the element uranium in single Bacillus subtilis cells. Since then, elemental analysis based on SC-ICP-MS has been applied to various cell samples. It was found that ferric iron can affect the absorption of a bismuth-based drug by Helicobacter pylori.2Magnetospirillum magneticum and its ability to assimilate iron from the external environment have been studied to evaluate the role of magnetotactic bacteria in the biogeochemical cycle of iron.3 In addition to prokaryotes, eukaryotic cells can also be the target of the analysis by SC-ICP-MS. Chlamydomonas reinhardtii was found to have changed its lipid profile after absorbing arsenate.4S. cerevisiae was reported to have a cell signal length of less than 1 millisecond in SC-ICP-MS.5 Additionally, the distribution profile of mineral elements6 and the uptake of anti-cancer drugs7 were studied for different types of human cells. These examples show the immense potential of the SC-ICP-MS method and the large variety of cells which can be analyzed with it.The volume of an individual cell is usually at the femtolitre (cubic micrometer) level and the amount of elements contained therein is at the picogram or femtogram level.6 This presents a challenge as very sensitive methods are required. Intrinsic elements could be employed to detect single cells in SC-ICP-MS, provided that their concentrations in the individual cells would not differ significantly.8 Polyatomic interference and unavoidable noise often hinder the effective determination of these elements. Therefore, cell staining with heavy elements was developed to increase the visibility of cell signals by ICP-MS. One commonly used agent to deliver heavy elements to cells is antibodies.9 At present, antibodies as a cell staining agent are mainly used in mass cytometry, which avoids detecting ions smaller than 80 Da and, thereby, most intrinsic elements of cells. With the help of mass cytometry, a method called CellCycleTRACER was developed to obtain cell cycle and cell volume information,10 which are essential to study cells in depth. Bendall et al. used labeled antibodies to bind to human bone marrow cells and simultaneously analyzed up to 34 different cell parameters through mass cytometry.11 The size of mammalian cells was studied by OsO4 staining (a lipid stain).12 Löhr et al. used DNA intercalators carrying Ir to label cells and analyzed elemental distribution in human monocytic leukemia cells using laser ablation combined with SC-ICP-TOF-MS.13 However, these cell staining agents have the disadvantages of cumbersome pre-processing of cell samples and a high price. Besides, platinum-based cisplatin used to stain cells can be applied for cell viability testing by distinguishing dead cells from live cells.14 Metal nanoparticles (e.g. Au) can also be used for cell staining,15 provided that a certain number of nanoparticles can enter the cell or be firmly attached to its surface, which directly determines the staining efficiency. Therefore, an efficient and simple staining agent for the determination of single cells by SC-ICP-MS would be valuable.
At present, it is still a challenge to determine the elemental concentration in a single cell by SC-ICP-MS because the cell size cannot be measured simultaneously with the elemental content. A method for plotting elemental content data obtained by SC-ICP-MS against cell volume data from microscopic analysis in a numerical order and, then, estimating the elemental concentration was reported.8,16 However, this method has a shortcoming: the accuracy of the data plotting cannot be ensured. Therefore, a cell staining that can provide cell size information by SC-ICP-TOF-MS analysis would allow direct access to elemental concentrations in single cells. RR can bind with polysaccharides on the cell surface and its initial purpose was to enhance the optical visibility of cellular or subcellular structures of cells in electron microscopy.17,18 Due to the binding tendency to the cell surface,19 RR may be a suitable and versatile cell staining for the SC-ICP-MS analysis, which has not been investigated until now. Besides, Ru has an extremely low presence in biological samples, which should ensure a favorable signal-to-noise ratio and, thus, a high sensitivity of this staining approach.
The goal of this work is to explore the feasibility of RR as a cell staining agent for SC-ICP-MS analysis. This staining should serve two purposes: (1) to improve the detectability of single cells in ICP-MS and (2) to provide the possibility of direct connection between intrinsic elements and the cell volume of individual cells. This was tested using three cell samples: two strains of yeast cells and one type of algae cell.
Methods and materials
Materials, instrument and cell strain
RR was purchased from Sigma-Aldrich (Darmstadt, Germany). ICP standard solutions, including Mg, P, Ru and Au, for this work were purchased from Merck (Darmstadt, Germany). Milli-Q water used in the whole experiment was produced using the Millipore system of ELIX 3 combined with Element Milli-Q A10 from Merck (Darmstadt, Germany). The icpTOF (TOFWERK, Thun, Switzerland) performance was checked daily by a running tuning solution according to the instructions and guidelines provided by the company. 60 nm gold nanoparticles needed to verify the performance of the icpTOF were purchased from BBI solutions (Crumlin, UK). S. cerevisiae h155 (denoted as “strain 1” in this study) and Scenedesmus vacuolatus (S. vacuolatus) were obtained from the strain collections at the Helmholtz Centre for Environmental Research – UFZ (Leipzig, Germany). S. cerevisiae cells were incubated (with a starting cell density 106 cells per ml) for 48 hours under the conditions of 30 °C and 125 rpm in 100 ml of Schatzmann medium (Table S1†).20S. vacuolatus was incubated in a 14:10 hours light![[thin space (1/6-em)]](https://www.rsc.org/images/entities/char_2009.gif) :
:![[thin space (1/6-em)]](https://www.rsc.org/images/entities/char_2009.gif) dark cycle at 28 °C and more details of cultivation and medium can be found in previous papers.21,22 Another S. cerevisiae strain, commercial baker's yeast with a brand name of Natürliche Trocken-Back-Hefe (Seitenbacher, Buchen, Germany; hereafter: “strain 2”), was purchased at a local supermarket in Leipzig, Germany. To prepare the cell suspension of S. cerevisiae strain 2, 400 mg of yeast powder was dissolved in 10 ml of water and shaken sufficiently for 5 min by a vortex mixer (Digital Vortex-Genie 2, Scientific Industries, Inc., New York, USA) at a speed of 2850 rpm. Then, this cell suspension was filtered through 22 micron pores (Whatman grad 541, Merck, Darmstadt, Germany) to remove cell aggregates. Before SC-ICP-TOF-MS analysis, all cell samples were centrifuged and washed twice with Milli-Q water for medium removal under the conditions of 4 °C, 10 min and 6000g (Heraeus Fresco 21, Thermo Fisher, Darmstadt, Germany).
dark cycle at 28 °C and more details of cultivation and medium can be found in previous papers.21,22 Another S. cerevisiae strain, commercial baker's yeast with a brand name of Natürliche Trocken-Back-Hefe (Seitenbacher, Buchen, Germany; hereafter: “strain 2”), was purchased at a local supermarket in Leipzig, Germany. To prepare the cell suspension of S. cerevisiae strain 2, 400 mg of yeast powder was dissolved in 10 ml of water and shaken sufficiently for 5 min by a vortex mixer (Digital Vortex-Genie 2, Scientific Industries, Inc., New York, USA) at a speed of 2850 rpm. Then, this cell suspension was filtered through 22 micron pores (Whatman grad 541, Merck, Darmstadt, Germany) to remove cell aggregates. Before SC-ICP-TOF-MS analysis, all cell samples were centrifuged and washed twice with Milli-Q water for medium removal under the conditions of 4 °C, 10 min and 6000g (Heraeus Fresco 21, Thermo Fisher, Darmstadt, Germany).
Cell staining
The RR solution was always prepared freshly on the same day of use. To prepare, 1 mg of RR was fully dissolved in 1 ml of Milli-Q water with vigorous shaking. For cell staining, 950 μl of cell suspension containing about 108 cells and 50 μl of 1 mg ml−1 RR solution were mixed thoroughly and allowed to stand still at room temperature for 30 min. Then the cell suspensions were washed (conditions: 4 °C, 10 min, and 6000g) twice with Milli-Q water to remove excess RR. After washing, the stained cells were directly diluted and measured. RR staining changed the color of the cell pellet. Fig. S1† shows the color difference of S. cerevisiae between stained and unstained.Cell observation
Cells were observed and counted under the microscope Leica DM5500B (Leica Microsystems, Wetzlar, Germany) using C-Chip (NanoEntek, South Korea). ImageJ Fiji software was used to analyze the cell shape and cell size (Fig. S2†). During software processing, cells were treated as particles and distinguished from their background, and their particle size parameters such as particle cross sectional area value were automatically generated. At least 690 individuals of each type of cell were analyzed via microphotography. If the cell is assumed to be a sphere, the cell surface area (S) can be derived from the particle cross sectional area (A) obtained from microscopic analysis using eqn (1) and (2):| A = πr2, | (1) |
| S = 4πr2, | (2) |
| S = 4·A. | (3) |
In the equations above, r represents the radius of particles/cells and eqn (3) originates from (1) and (2).
Single-cell analysis by SC-ICP-TOF-MS
Cell suspensions were diluted with MilliQ water to reduce the probability of two-cell or multi-cell events. The cell density for SC-ICP-TOF-MS tests was optimized to approximately 5 × 10⁵ cells per ml. Other typical parameters of the instrument were: nebulizer gas flow (1 l min−1), sample uptake speed (0.3 ml min−1), plasma power (1550 W), dwell time (3 ms) and acquisition time (60 s). Five point-calibration curves were used for the quantitative analysis of each target element. The identification, collection and quantification of cell signals were performed through TOFWARE software (TOFWERK, Thun, Switzerland). Finally, the relevant data were exported to Excel and OriginPro for further processing and analysis.To calculate the elemental concentration of Mg and P in single cells, the following equations are used:
 | (4) |
| m′ = a·S, | (5) |
 | (6) |
 | (7) |
Eqn (7) is derived from (2) and (4–6). In these equations: V is the sphere volume; m (represents Mg or P) and m′ (represents Ru) stand for the elemental content in single cells, respectively; a represents the staining strength of RR, i.e. Ru; c is the elemental concentration of Mg or P.
Results & discussion
Commonly used agents for cell staining for ICP-MS determination interact with cells in different ways: antibodies bind to specific antigens, intercalators act on cell genetic material and metal nanoparticles need to be internalized by cells. In these staining processes, which are usually complicated and time-consuming, there may be factors that can affect the cell structure or change the physiological state of cells, such as the chemicals used for cell fixation and the biological toxicity of the staining agent itself. These factors may cause the experimental results for stained cells to deviate from unstained cells.Because the binding sites of RR are located on the cell surface, they do not penetrate into the cell membrane. This should avoid affecting the physiological state and structure of the stained cell and its viability. To confirm this, several parameters of cell integrity of S. cerevisiae cells with and without RR staining were compared (Table 1). Similar values were found by microphotography (Fig. S3†) with regard to average cell density and cell size (cell surface area), suggesting that RR does not induce changes in the cell structure or cause cell lysis. Elemental analysis of Mg and P also proved that there are no significant (p > 0.5) differences provoked by RR staining inside the cells. It can be concluded that RR staining leaves the cells studied in this work intact and viable.
| Cell density | Cell surface area (μm2) | Mg intensity (cts per cell) | Mg content (fg per cell) | P intensity (cts per cell) | P content (fg per cell) | |
|---|---|---|---|---|---|---|
| Without staining | 288 ± 19 | 144.1 ± 11.5 | 371 ± 11 | 26 ± 1 | 124 ± 10 | 271 ± 21 |
| With staining | 265 ± 28 | 156.6 ± 4.3 | 361 ± 23 | 25 ± 2 | 118 ± 8 | 258 ± 17 |
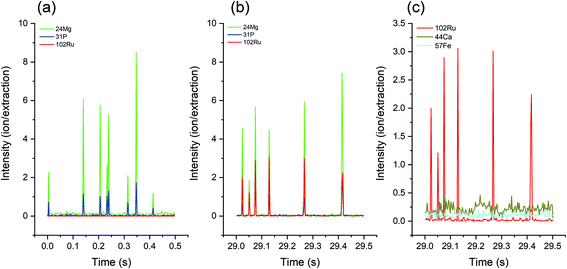
Since Mg and P are essential elements and are relatively abundant in cells, the simultaneous occurrence of their mass spectrometric signals can be regarded as a cellular event (Fig. 1a). Because the characteristic element of RR is Ru, the parallel occurrence of a 102Ru signal marks a stained cell (Fig. 1b). It is worth noting that the baseline of 102Ru is very low, indicating that the excess of dissolved RR has been sufficiently removed by the washing processes. On account of the low noise of Ru in biological samples, stained cells should be well detectable in single-cell analysis methods, including LA-SC-ICP-MS. In addition, RR staining can also help distinguish cells from noise, especially for elements with a high background signal: although Fe and Ca are present in cells, there is no distinguishable cell signal. With the support of 102Ru, the location of the cell signal is clearly shown (Fig. 1c).
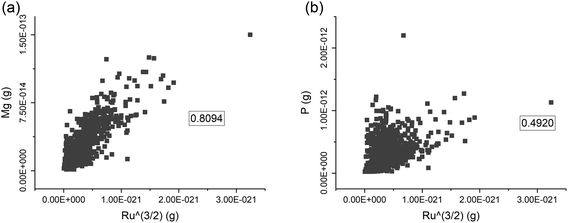
Since RR is only attached to the cell surface, it can be assumed that the amount of Ru bound to a single cell may be proportional to its surface area. Provided that cells have a regular shape, it would be possible to relate the surface area with their cell volume. For the yeast cells, it was previously suggested that the content of Mg and P in the cell is related to the cell volume.8 For a set of 1077 cells of S. cerevisiae strain 1, it was tested whether the content of Mg and P (proportional to r3) and Ru content (proportional to r2) are correlated (Fig. 2). For Mg, this correlation is 0.81, suggesting that the Mg content per cell is, indeed, correlated with the cell volume and that its concentration in the cells is rather constant (Fig. 2a). This supports previous findings for S. cerevisiae with an approximation approach.8 In contrast, the correlation with Ru is weaker for the P content, with a correlation coefficient of 0.49 (Fig. 2b). This indicates that the P concentration in single cells of strain 1 is more variable. Yeast can store P mostly in its vacuoles to prepare for the conditions of phosphorus deficiency.23,24 Thus, the P content of single yeast cells may be influenced by other factors than just their cell. In addition, the detection sensitivity of ICP-MS to P is generally lower than that of Mg, which may also lead to a weaker correlation with Ru.
In order to verify whether RR can effectively stain other species of biological samples, S. cerevisiae strain 2 and algal cells of S. vacuolatus were also investigated. The RR staining efficiency (the percentage of stained cell in total analyzed cells) can be determined by SC-ICP-MS. For the three investigated cell species, the staining efficiency ranges from 96.5 to 98.1% of cells (Table 2).
| S. cerevisiae strain 1 | S. cerevisiae strain 2 | S. vacuolatus | |
|---|---|---|---|
| Staining efficiency (%) | 96.5 ± 0.4 | 96.6 ± 0.2 | 98.1 ± 1.2 |
| Average Ru content (fg per cell) | 4.6 ± 0.2 | 3.2 ± 0.1 | 5.2 ± 0.1 |
| Staining strength (ag μm−2) | 30 ± 2 | 32 ± 2 | 59 ± 11 |
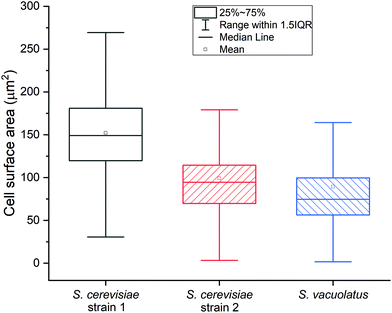
The average Ru content after staining two S. cerevisiae strains is 4.6 fg per cell and 3.2 fg per cell, while it is 5.2 fg per cell for S. vacuolatus (Table 2). The main advantage of SC-ICP-TOF-MS, however, is the ability to determine elements in individual cells: the Ru elemental content distributions of the three studied cell samples are demonstrated in Fig. S4.† Independent microscopic image analysis showed that S. vacuolatus cells had the smallest cell size and, thus, the smallest surface area of these three cell types (Fig. 3). Several factors may affect the staining strengths (Ru mass per surface) of cells of a given culture, including its culture conditions. Therefore, when using this RR staining, the corresponding culture-specific staining strength needs to be determined separately, for each type of cell under study, to allow the calculation of internal concentrations.
This staining strength value can be derived from the data of the average Ru content on single cells from SC-ICP-TOF-MS measurements and the data of average cell surface area, derived from optical microscopy (Table S2 and Fig. S5†). Based on these data, the two S. cerevisiae strains exhibited similar staining strengths of 30–32 ag μm−2, while the staining strength of S. vacuolatus was much stronger, 59 ag μm−2 (Table 2). As RR is assumed to bind to polysaccharides at the cell surface,19 this strong difference in staining strength between the yeast and the algae may be due to a higher polysaccharide density at the surface of the algal cells. The algal cells, however, also exhibit a higher standard deviation of 19%. This may be due to the smaller size of the cells, which brings about a higher uncertainty in optical size estimation. Given the speed of analysis of single cells by SC-ICP-MS, the higher standard deviation could be compensated by analyzing a large number of cells.
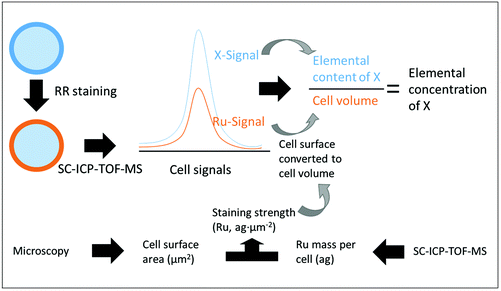
After having established a link between Ru mass and cellular surface for one species, this calibration can be used to calculate the surface area of each single cell of that species, depending on its Ru signal obtained by SC-ICP-TOF-MS. For converting the determined mass of an element in a cell into concentration, the cellular volume rather than its surface area is needed. For approximately spherical cells like the yeast and algal cells in this study, this is straightforward (eqn (2) and (4)). Therefore, based on the information of elemental content, the concentration of intrinsic elements (such as Mg and P) in the single cells stained by RR can be estimated (Fig. 4). But also for other shapes, a correlation exists between the cell surface area and the cell volume that could be employed for the volume calculation based on the Ru content. For example, the difference in volume between spherical and cubic shape does not exceed 30%. The fundamental prerequisite for any calculation of concentrations is that the cells of the culture have a sufficiently similar shape.
The cells of this study were approximately spherical (Fig. S2†) and volumes of each single cell were calculated from its Ru signal. The corresponding average elemental concentrations in single S. cerevisiae strain 1 cells are 0.16 fg μm−3 for Mg and 1.82 fg μm−3 for P. SC-ICP-MS analyses do not only yield average concentrations, but concentration distributions (Fig. 5): these show that for all three cultures studied the concentration of Mg is less variable (e.g. S. cerevisiae strain 1, 25–75 percentile: 0.10–0.19 fg μm−3) than the concentration of P (e.g. S. cerevisiae strain 1, 25–75 percentile: 0.76–2.07 fg μm−3).
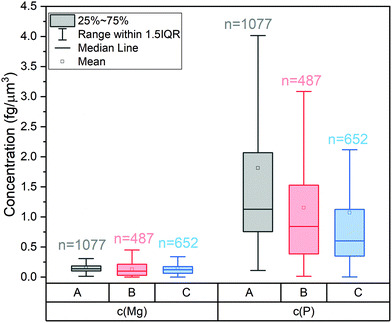 | ||
| Fig. 5 Distribution of the concentrations of Mg and P in cells of (a) S. cerevisiae strain 1, (b) strain 2, and (c) S. vacuolatus. | ||
These average data for S. cerevisiae strain 1 cells agree well with a previous quantification exercise solely on a data plotting approach, which yielded 0.12 fg μm−3 for Mg and 1.42 fg μm−3 for P.8 The new RR staining approach outlines, however, that not only the P but also the Mg concentration shows some variability. Therefore, RR staining should provide a more accurate access to internal elemental concentrations in single cells than normalizing to the Mg mass. RR staining greatly expands the application range of SC-ICP-TOF-MS and allows for a deeper exploration of internal elemental concentrations at the single-cell level and of the factors that affect these concentrations.
Conclusion
RR staining of cells for SC-ICP-TOF-MS analysis proved useful for yeast cell (S. cerevisiae) and algal cell (S. vacuolatus) culture. The staining efficiency was high for all cells studied, while the staining strength was shown to be species-dependent and differed by a factor of 2 between yeast and algae. Within one species, the amount of RR per cell appears to be correlated to the cell surface. For regularly shaped cells this correlates with the cell volume. On this basis, a procedure is proposed to use RR staining for the determination of internal concentrations of elements in single cells by SC-ICP-TOF-MS. Its application in yeast cells proves that the elemental concentrations of Mg and P can be appropriately calculated through RR staining.Author contributions
Wen Qin: conceptualization, methodology, validation, investigation, writing-original draft. Hans-Joachim Stärk: methodology, validation, writing-review and editing. Thorsten Reemtsma: supervision, resources, writing-review and editing.Conflicts of interest
The authors declare that there is no conflict of interest.Acknowledgements
We thank Dana Kühnel (Department of Bioanalytical Ecotoxicology, UFZ) for providing algae cell: S. vacuolatus and Susann Müller (Department of Environmental Microbiology, UFZ) for contributing S. cerevisiae strain 1. This research was funded by the Helmholtz Centre for Environmental Research – UFZ in the framework of the program-oriented research IV, topic “Chemicals in the Environment” (CITE).Notes and references
- F. Li, D. W. Armstrong and R. Houk, Behavior of bacteria in the inductively coupled plasma: atomization and production of atomic ions for mass spectrometry, Anal. Chem., 2005, 77(5), 1407–1413 CrossRef CAS PubMed.
- C.-N. Tsang, K.-S. Ho, H. Sun and W.-T. Chan, Tracking Bismuth Antiulcer Drug Uptake in Single Helicobacter pylori Cells, J. Am. Chem. Soc., 2011, 133(19), 7355–7357 CrossRef CAS PubMed.
- M. Amor, M. Tharaud, A. Gélabert and A. Komeili, Single–cell determination of iron content in magnetotactic bacteria: implications for the iron biogeochemical cycle, Environ. Microbiol., 2020, 22(3), 823–831 CrossRef CAS PubMed.
- E. Mavrakis, L. Mavroudakis, N. Lydakis-Simantiris and S. A. Pergantis, Investigating the Uptake of Arsenate by Chlamydomonas reinhardtii Cells and its Effect on their Lipid Profile using Single Cell ICP–MS and Easy Ambient Sonic-Spray Ionization–MS, Anal. Chem., 2019, 91(15), 9590–9598 CrossRef CAS PubMed.
- Z. Liu, A. Xue, H. Chen and S. Li, Quantitative determination of trace metals in single yeast cells by time-resolved ICP-MS using dissolved standards for calibration, Appl. Microbiol. Biotechnol., 2019, 103(3), 1475–1483 CrossRef CAS PubMed.
- H. Wang, B. Wang, M. Wang, L. Zheng, H. Chen and Z. Chai, et al., Time-resolved ICP-MS analysis of mineral element contents and distribution patterns in single cells, Analyst, 2015, 140(2), 523–531 RSC.
- M. Corte Rodríguez, R. Álvarez-Fernández García, E. Blanco, J. Bettmer and M. Montes-Bayón, Quantitative evaluation of cisplatin uptake in sensitive and resistant individual cells by single-cell ICP-MS (SC-ICP-MS), Anal. Chem., 2017, 89(21), 11491–11497 CrossRef PubMed.
- W. Qin, H. J. Stark, S. Muller, T. Reemtsma and S. Wagner, Determination of elemental distribution and evaluation of elemental concentration in single Saccharomyces cerevisiae cells using single cell-inductively coupled plasma mass spectrometry, Metallomics, 2021, 13, mfab032 CrossRef PubMed.
- S. Theiner, K. Loehr, G. Koellensperger, L. Mueller and N. Jakubowski, Single-cell analysis by use of ICP-MS, J. Anal. At. Spectrom., 2020, 35(9), 1784–1813 RSC.
- M. A. Rapsomaniki, X.-K. Lun, S. Woerner, M. Laumanns, B. Bodenmiller and M. R. Martínez, CellCycleTRACER accounts for cell cycle and volume in mass cytometry data, Nat. Commun., 2018, 9(1), 1–9 CrossRef CAS PubMed.
- S. C. Bendall, E. F. Simonds, P. Qiu, D. A. El-ad, P. O. Krutzik and R. Finck, et al., Single-cell mass cytometry of differential immune and drug responses across a human hematopoietic continuum, Science, 2011, 332(6030), 687–696 CrossRef CAS PubMed.
- A. D. Stern, A. H. Rahman and M. R. Birtwistle, Cell size assays for mass cytometry, Cytometry, Part A, 2017, 91(1), 14–24 CrossRef CAS PubMed.
- K. Löhr, O. Borovinskaya, G. Tourniaire, U. Panne and N. Jakubowski, Arraying of single cells for quantitative high throughput Laser Ablation ICP-TOF-MS, Anal. Chem., 2019, 91(18), 11520–11528 CrossRef PubMed.
- Y. Guo, S. Baumgart, H.-J. Stärk, H. Harms and S. Müller, Mass cytometry for detection of silver at the bacterial single cell level, Front. Microbiol., 2017, 8, 1326 CrossRef PubMed.
- J. Hu, D. Deng, R. Liu and Y. Lv, Single nanoparticle analysis by ICPMS: a potential tool for bioassay, J. Anal. At. Spectrom., 2018, 33(1), 57–67 RSC.
- W.-Y. Lau, K.-H. Chun and W.-T. Chan, Correlation of single-cell ICP-MS intensity distributions for the study of heterogeneous cellular responses to environmental stresses, J. Anal. At. Spectrom., 2017, 32(4), 807–815 RSC.
- T. A. Fassel and C. E. Edmiston, Ruthenium red and the bacterial glycocaly, Biotech. Histochem., 1999, 74(4), 194–212 CrossRef CAS PubMed.
- R. Dierichs, Ruthenium red as a stain for electron microscopy. Some new aspects of its application and mode of action, Histochemistry, 1979, 64(2), 171–187 CAS.
- M. Havelková, Use of ruthenium red for visualization of the regenerating cell wall in yeast protoplasts, Folia Microbiol., 1981, 26(1), 65–67 CrossRef PubMed.
- H. Schatzmann, Anaerobes Wachstum von Saccharomyces cerevisiae: regulatorische Aspekte des glycolytischen und respirativen Stoffwechsels, ETH Zurich, 1975 Search PubMed.
- L. Grimme and N. Boardman, Photochemical activities of a particle fraction P1 obtained from the green alga Chlorella fusca, Biochem. Biophys. Res. Commun., 1972, 49(6), 1617–1623 CrossRef CAS PubMed.
- R. Altenburger, H. Walter and M. Grote, What contributes to the combined effect of a complex mixture?, Environ. Sci. Technol., 2004, 38(23), 6353–6362 CrossRef CAS PubMed.
- R. E. Beever and D. Burns, Phosphorus uptake, storage and utilization by fungi, Advances in Botanical Research. 8, Elsevier, 1981, pp. 127–219 Search PubMed.
- S.-Y. Yang, T.-K. Huang, H.-F. Kuo and T.-J. Chiou, Role of vacuoles in phosphorus storage and remobilization, J. Exp. Bot., 2017, 68(12), 3045–3055 CrossRef CAS PubMed.
Footnote |
| † Electronic supplementary information (ESI) available. See DOI: 10.1039/d1an01143j |
| This journal is © The Royal Society of Chemistry 2021 |

