Improved discrimination of phenylalanine enantiomers by surface enhanced Raman scattering assay: molecular insight into chiral interaction†
Yanxiu
He‡
,
Qinghai
Zhou‡
 ,
Ning
Wang
,
Haifeng
Yang
,
Ning
Wang
,
Haifeng
Yang
 * and
Xinling
Liu
 *
*
The Education Ministry Key Lab of Resource Chemistry, College of Chemistry and Materials Science, Shanghai Normal University, Shanghai 200234, China. E-mail: hfyang@shnu.edu.cn; xlliu@shnu.edu.cn
First published on 10th March 2022
Abstract
SERS spectroscopy, a nontraditional chiral analysis tool, is used to discriminate between D- and L-phenylalanine (Phe), with the Raman scattering enhancement degree of D-Phe being 50-fold greater than that of L-Phe. Such discrimination is achieved by chiral interactions between Phe and the chiral drug molecule of sertraline on silver coated gold nanorods.
Homochirality of biomolecules and drug molecules is extremely important to maintain various physiological processes.1,2 The discrimination of two enantiomeric molecules is of great importance but is difficult due to their almost same properties. For example, the differential chiroptical effects usually account for 0.1% (or even less) of the total optical signals of chiral molecules.3 Therefore, the amplification of differences between enantiomers is a key issue for enantio-differentiation. As a normal strategy, enantiomers interacting with other chiral molecules might amplify their structural difference and realize the discrimination. At the molecular level, insights into these chiral interactions are useful to understand the pharmacodynamic effect of chiral drugs, establish novel stereoselective synthesis protocols and explore methodologies for enantiomer separation and detection.4,5
Therefore, the development of novel analytical techniques to easily discriminate enantiomers and understand the molecular interaction mechanism between chiral molecules is highly appreciated. Spectroscopic analysis tools for chiral molecules include circular dichroism (CD), vibrational circular dichroism (VCD) and Raman optical activity (ROA). The CD method is based on the UV-Vis absorption of chromophores and may suffer from weak signals and insufficiency in molecule-specific structural information. Although VCD and ROA spectra are informative regarding molecular vibrations, they require expensive instruments that are inaccessible and the tests are usually time-consuming. Alternatively, surface enhanced Raman scattering (SERS) spectroscopy seems to be a good candidate, owing to its high sensitivity, abundant molecular structural vibration information, non-destructive sampling and rapid detection.6 Nevertheless, the SERS assay hardly offers direct evidence to discriminate chirality. Only in a few literature studies,7–12 the small SERS spectral differences are used to distinguish enantiomers after they are adsorbed on substrate surfaces modified with chirality-selector molecules. However, such kinds of discrimination signals are not obvious in some cases. Moreover, the discrimination mechanism still needs to be further clarified.
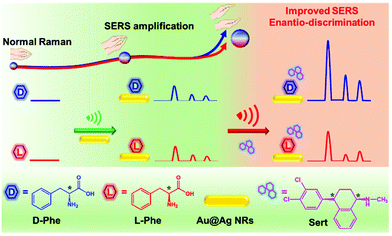
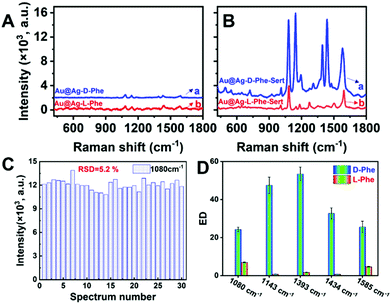
Herein, we demonstrated a remarkable SERS enantio-discrimination assay by using D- and L-phenylalanine (Phe) as model enantiomers (Scheme 1). As shown in Fig. S1A,† the same Raman spectra of powder D-Phe and L-Phe suggest that the normal Raman technique is ineffective for chirality discrimination. Alternatively, Ag coated Au nanorod (Au@Ag NR) substrates were synthesized due to their potential in boosting Raman scattering.13–16 Indeed, the enhancement effect of Au@Ag NRs is visible in D- (or L-) Phe solution at a concentration of 6.7 × 10⁻⁶ mol L−1 (Fig. 1A) while the Raman spectra (Fig. S1B†) of these Phe solutions are free of signals. However, the SERS spectra of D- and L-Phe on Au@Ag NRs present similar profiles. Astonishingly, when the sertraline (Sert) molecule (a kind of chiral drug) was employed to interact with Phe enantiomers on Au@Ag NRs, the scattering enhancement degree of D-Phe was 50-fold greater than that of L-Phe, which could realize excellent discrimination of Phe enantiomers. In other words, Sert acts as an enantiomer-selective amplifier to improve SERS enantio-discrimination, which is further supported by density functional theoretical (DFT) calculations to provide insight into the intermolecular chiral interactions between Phe and Sert.
We firstly prepared Au NRs by a seed-mediated method. In the TEM image shown in Fig. S2A,† the average length and diameter of Au NRs are respectively 27 and 8 nm, with a ratio of about 3:4. In the HRTEM image (Fig. S2A,† inset), the (111) plane of the cubic-phase of Au is identified by the lattice fringes with a d-spacing of 0.230 nm. As shown in the TEM image (Fig. S2B†), the morphologies of the parent Au NRs were well maintained on Au@Ag NRs. The EDS spectrum of Au@Ag NRs (Fig. S2C†) confirmed that the main component is Au, together with a small amount of Ag. The co-existence of Au and Ag is also supported by UV-Vis absorption and XPS spectra. Due to the anisotropic one-dimensional morphologies, two UV-Vis bands around 518 and 771 nm are visible (Fig. S2D(a)†), assigned to the transverse and longitudinal SPR modes of Au NRs, respectively. In comparison with Au NRs, the longitudinal SPR mode of Au@Ag NRs showed a blue shift from 771 nm to 679 nm on the UV-Vis absorption spectrum (Fig. S2D(b)†), which may be caused by the different dielectric functions of Au and Ag.16 In the XPS spectra of Au@Ag NRs (Fig. S3†), the characteristic peaks of Ag and Au are found to be as follows: 83.7 eV (Au 4f7/2), 87.4 eV (Au 4f5/2), 368.0 eV (Ag 3d5/2) and 373.8 eV (Ag 3d3/2).17
The absence of Raman signals in blank Au@Ag NRs (Fig. S4a†) demonstrated negligible background interferences for SERS detection. After mixing Au@Ag NRs with D-Phe (denoted as Au@Ag-D-Phe), Fig. 1A(a), D-Phe could be detected based on the Raman peaks at 1080 (NH2 bending), 1143 (C–C–N asymmetric stretching), 1393 (COO− symmetric stretching), 1434 (–CH2 scissoring) and 1585 cm−1 (NH2 vibrations).18–22 As for L-Phe, the SERS spectrum (Fig. 1A(b)) of Au@Ag-L-Phe is almost the same as that of Au@Ag-D-Phe. As revealed by the circular dichroism (CD) spectrum (Fig. S5A†), Au@Ag NRs did not show chiroptical activity. Therefore, SERS-based discrimination of D-Phe and L-Phe only by using Au@Ag NRs is difficult due to the lack of a chiral feature.
Therefore, additional chiral regulatory factors should be introduced to achieve the enantiomeric discrimination of Phe. For this purpose, the chiral molecule of sertraline (Sert, molecular structure shown in Scheme 1) was selected to amplify the SERS discrimination capability. SERS signals of Sert could not be recorded on Au@Ag NR substrates (Fig. S4b†). Interestingly, after Sert was mixed with Au@Ag-D-Phe, the SERS intensity of Au@Ag-D-Phe-Sert (Fig. 1B(a)) is elevated, compared with that of Au@Ag-D-Phe (Fig. 1A(a)). In the case of L-Phe, the enhancement phenomenon of Au@Ag-L-Phe-Sert (Fig. 1B(b)) is also observed compared with Au@Ag-L-Phe (Fig. 1A(b)). To check the reproducibility of this enhancement effect, three different batches of Au@Ag NRs were used, and ten Raman spectra were collected from different spots for each batch of Au@Ag-D-Phe-Sert (or Au@Ag-L-Phe-Sert) sample. The SERS signal intensities around 1080 cm−1 (defined as I1080) in the 30 spectra of Au@Ag-D-Phe-Sert are shown in Fig. 1C, and the relatively standard deviation (RSD) of I1080 is 5.2%. Moreover, the RSD values for five bands (1080, 1143, 1393, 1434, and 1585 cm−1) of Au@Ag-D-Phe-Sert and Au@Ag-L-Phe-Sert are shown in Table S1.† On the whole, these RSD values lie in the range from 3% to 12%, depicting good reproducibility.
To quantify the enhancement effects caused by Sert above, an enhancement degree (denoted as EDH-X) is proposed and calculated using formula (1):
 | (1) |
In formula (1), H represents the handedness tag of Phe (H = D for D-Phe, H = L for L-Phe); X indicates the Raman shift of a given SERS signal; the denominator is the signal intensity on the SERS spectrum of Ag@Au-H-Phe; and the numerator is the average signal intensity based on 30 replicate SERS spectra of Au@Ag-H-Phe-Sert.
The values of EDH-X calculated based on the selected signals are shown in Fig. 1D. With the addition of Sert, the SERS signal intensities at 1080 and 1585 cm−1 increased over 4 times in both D-Phe and L-Phe. Moreover, the signal at 1009 cm−1 (the benzene ring breathing vibration mode of Phe) is hardly detected in Au@Ag-D-Phe (or Au@Ag-L-Phe), but is clearly observable in Au@Ag-D-Phe-Sert (or Au@Ag-L-Phe-Sert).18 However, the enhancement effect featured enantiomeric selectivity. The enhancement degrees in D-Phe are larger than those in L-Phe at 1080 and 1585 cm−1: EDD-1080 = 24.2 > EDL-1080 = 6.9, and EDD-1585 = 25.6 > EDL-1585 = 4.7. What is more, the differences between D-Phe and L-Phe at 1143, 1393 and 1434 cm−1 became more significant: EDD-1143 = 47.5 > EDL-1143 = 0.8, EDD-1393 = 53.4 > EDL-1393 = 1.7, and EDD-1434 = 32.7 > EDL-1434 = 0.7. Obviously, with the employment of Sert, the SERS intensities of D-Phe at 1143, 1393 and 1434 cm−1 are increased obviously with the highest enhancement being over 50-fold, while the SERS intensities of L-Phe at 1143, 1393 and 1434 cm−1 did not show any distinct change. Consequently, the SERS discrimination of D-Phe and L-Phe would be easily achieved based on the differences in EDH-X by introducing the Sert molecule.
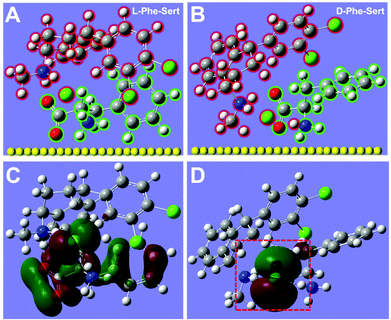
It is well known that the SERS signals of molecules on the plasmonic metal surfaces depend on many factors including their concentration, conformation, polarizability, and orientation.23–26 To explain the differences in the SERS signals above, the DFT simulated molecular structures of “D-Phe-Sert” and “L-Phe-Sert” complexes are shown in Fig. 2A and B. In both cases, the carboxylate group in D- (or L-) Phe is close to the amine group in Sert. Because these carboxylate and amine groups are connected to the chiral carbon atoms of Phe and Sert (see the molecular structures in Scheme 1), these simulated structures demonstrate the chiral interactions between Phe and Sert. Considering that the Raman scattering intensity is related to the molecular polarizability (a measure of the distortion of the electron cloud), the polarizability values of Phe and Phe-Sert are also calculated. The polarizability is 102.2, 102.2, 314.9 and 308.0 for D-Phe, L-Phe, D-Phe-Sert and L-Phe-Sert, respectively. Compared with D-Phe (or L-Phe), the polarizability is obviously increased in D-Phe-Sert (or L-Phe-Sert). This may be an important reason for the enhancement of the SERS signals for the amine group at 1080 and 1585 cm−1 and the appearance of the SERS signal for the benzene ring at 1009 cm−1 both in D-Phe-Sert and L-Phe-Sert. The polarizability of D-Phe-Sert is higher than that of L-Phe-Sert, which may result in enhanced scattering with increased EDH-X. Moreover, the electron density distribution of the highest occupied molecular orbital (HOMO) on “D-Phe-Sert” also differs from that on “L-Phe-Sert”. The electrons are homogeneously distributed on the whole framework of the L-Phe molecule in “L-Phe-Sert” (Fig. 2C). However, the electrons in “D-Phe-Sert” are confined mainly within the area between the two chiral carbon atoms from D-Phe and Sert (see the red frame at the bottom of Fig. 2D), where the three groups (C–C–N at 1143 cm−1, carboxylate at 1393 cm−1, and CH2 groups at 1434 cm−1) are involved. To some extent, such confinement of electrons is beneficial for generating strong scattering signals around 1143 cm−1, 1393 cm−1 and 1434 cm−1, and therefore their corresponding values of EDD-X for D-Phe are remarkably higher than the EDL-X values for L-Phe. Besides polarizability, the molecular orientation also affects scattering signals, according to the surface selection rules in SERS: the enhancement of Raman scattering can be more prominent when the molecular orientation is normal to the metal surface, compared to that in the flat orientation.23 Compared with L-Phe-Sert, it seems that D-Phe-Sert could show a more tilted orientation with respect to the metal surface, which may also contribute to amplified discrimination of D-Phe and L-Phe. Briefly, the DFT simulations revealed enantio-differentiation of the important molecular properties (polarizability, electron distribution and orientation) in regulating SERS signals, which led to an enantiomer-selective SERS spectral profile. In addition, these differences in the enhancement effect of the five bands may account for the differences in their RSD values (Table S1†).
For comparison, CD spectroscopy is used to probe the intermolecular interactions between Phe and Sert under the same experimental conditions. Although a pair of opposite CD signals are observed for D-Phe and L-Phe (Fig. S5B†), the signals are weak because the concentrations of Phe are low (6.7 × 10⁻⁶ mol L−1). The CD signals located between 200 and 300 nm are visible for the Sert solution (Fig. S5C†). Due to the strong CD signals of Sert, the CD signals of the four kinds of mixtures containing Sert (D-Phe-Sert, L-Phe-Sert, Au@Ag-D-Phe-Sert and Au@Ag-L-Phe-Sert) showed CD spectral files similar to that of the Sert solution (Fig. S5D and S5E†). Therefore, it is difficult to reveal the chiral discrimination caused by Sert in Au@Ag NRs according to the CD spectra. These results also demonstrated the high sensitivity of the SERS assay for the analysis of intermolecular chiral interactions.
In summary, the SERS signals of D-Phe and L-Phe in Au@Ag NRs could be amplified by the chiral sertraline molecule. Moreover, the scattering enhancement degree of the groups connecting to the chiral carbon center in D-Phe could be 50-fold higher than that in L-Phe, showing the obvious enantiomer selectivity for D-Phe and L-Phe. These amplified differences also hint at the valuable molecular-scale information regarding the chiral interaction between Phe and Sert. Therefore, it is believed that this chiral-interaction-based SERS protocol can be explored in discrimination detection of enantiomers.
Author contributions
Conceptualization: Y. H., H. Y., and X. L.; investigation: Y. H. and N. W.; formal analysis: Q. Z.; writing – original draft: Y. H. and X. L.; writing – review & editing: Y. H., Q. Z., H. Y., and X. L.; funding acquisition: H. Y. and X. L.; and supervision: H. Y. and X. L.Conflicts of interest
There are no conflicts to declare.Acknowledgements
This work was partially supported by the National Natural Science Foundation of China (No. 21475088 and 52103345), the Education Ministry Key Lab of Resource Chemistry, Joint International Research Laboratory of Resource Chemistry of Ministry of Education, Shanghai Key Laboratory of Rare Earth Functional Materials, and Shanghai Frontiers Science Center of Biomimetic Catalysis.Notes and references
- V. Sundaresan and R. Abrol, Chirality, 2005, 17, S30–S39 CrossRef CAS PubMed.
- B. Kasprzyk-Hordern, Chem. Soc. Rev., 2010, 39, 4466–4503 RSC.
- A. Kakkanattu, N. Eerqing, S. Ghamari and F. Vollmer, Opt. Express, 2021, 29, 12543–12579 CrossRef CAS PubMed.
- M. Bieri, C. Gautier and T. Bürgi, Phys. Chem. Chem. Phys., 2007, 9, 671–685 RSC.
- M. Lämmerhofer, J. Chromatogr. A, 2010, 1217, 814–856 CrossRef PubMed.
- W. J. Xi, B. K. Shrestha and A. J. Haes, Anal. Chem., 2018, 90, 128–143 CrossRef CAS PubMed.
- O. Guselnikova, P. Postnikov, A. Trelin, V. Švorčík and O. Lyutakov, ACS Sens., 2019, 4, 1032–1039 CrossRef CAS PubMed.
- Y. Kalachyova, O. Guselnikova, R. Elashnikov, I. Panov, J. Žádný, V. Církva, J. Storch, J. Sykora, K. Zaruba, V. Švorčík and O. Lyutakov, ACS Appl. Mater. Interfaces, 2019, 11, 1555–1562 CrossRef CAS PubMed.
- Y. Ma, Z. Cao, J. Hao, J. Zhou, Z. Yang, Y. Yang and J. Wei, J. Phys. Chem. C, 2020, 124, 24306–24314 CrossRef CAS.
- Y. Wang, X. Zhao, Z. Yu, Z. Xu, B. Zhao and Y. Ozaki, Angew. Chem., Int. Ed., 2020, 59, 19079–19086 CrossRef CAS PubMed.
- S. X. Leong, C. S. L. Koh, H. Y. F. Sim, Y. H. Lee, X. Han, G. C. Phan-Quang and X. Y. Ling, ACS Nano, 2021, 15, 1817–1825 CrossRef CAS PubMed.
- J. Tao, D. Li, Y. Guo and W. Deng, Chem. Commun., 2021, 57, 11064–11067 RSC.
- M. Fan, F.-J. Lai, H.-L. Chou, W.-T. Lu, B.-J. Hwang and A. G. Brolo, Chem. Sci., 2013, 4, 509–515 RSC.
- J. Huang, Y. Zhu, C. Liu, Y. Zhao, Z. Liu, M. N. Hedhili, A. Fratalocchi and Y. Han, Small, 2015, 11, 5214–5221 CrossRef CAS PubMed.
- R. Moradian and M. Saliminasab, Plasmonics, 2018, 13, 1143–1151 CrossRef CAS.
- C.-F. Ning, Y.-F. Tian, W. Zhou, B.-C. Yin and B.-C. Ye, Analyst, 2019, 144, 2929–2935 RSC.
- L. Sun, Y. Yin, P. Lv, W. Su and L. Zhang, RSC Adv., 2018, 8, 3964–3973 RSC.
- R. Botta, A. Rajanikanth and C. Bansal, Chem. Phys. Lett., 2015, 618, 14–19 CrossRef CAS.
- C. Gao, L. Yu, L. Ma, X. Lu, S. Wu, P. Song and L. Xia, Chem. Phys. Lett., 2020, 745, 137273 CrossRef CAS.
- A. K. Ojha, A. Singha, S. Dasgupta, R. K. Singh and A. Roy, Chem. Phys. Lett., 2006, 431, 121–126 CrossRef CAS.
- F. Wei, D. Zhang, N. J. Halas and J. D. Hartgerink, J. Phys. Chem. B, 2008, 112, 9158–9164 CrossRef CAS PubMed.
- F. Madzharova, Z. Heiner and J. Kneipp, J. Phys. Chem. C, 2017, 121, 1235–1242 CrossRef CAS.
- M. Moskovits, J. Chem. Phys., 1982, 77, 4408–4416 CrossRef CAS.
- H. K. Lee, Y. H. Lee, C. S. L. Koh, G. C. Phan-Quang, X. Han, C. L. Lay, H. Y. F. Sim, Y.-C. Kao, Q. An and X. Y. Ling, Chem. Soc. Rev., 2019, 48, 731–756 RSC.
- H.-J. Ryu, W. K. Lee, Y. H. Kim and J.-S. Lee, Microchim. Acta, 2021, 188, 164 CrossRef CAS PubMed.
- W. Zhu, J. A. Hutchison, M. Dong and M. Li, ACS Sens., 2021, 6, 1704–1716 CrossRef CAS PubMed.
Footnotes |
| † Electronic supplementary information (ESI) available. See DOI: 10.1039/d2an00246a |
| ‡ These authors contributed equally. |
| This journal is © The Royal Society of Chemistry 2022 |


