A modified magnetic bottle electron spectrometer for the detection of multiply charged ions in coincidence with all correlated electrons: decay pathways to Xe3+ above xenon-4d ionization threshold
I.
Ismail
 *a,
M. A.
Khalal
a,
M.
Huttula
 b,
K.
Jänkälä
 b,
J.-M.
Bizau
cd,
D.
Cubaynes
cd,
Y.
Hikosaka
 e,
K.
Bučar
f,
M.
Žitnik
f,
L.
Andric
a,
P.
Lablanquie
a,
J.
Palaudoux
a and
F.
Penent
 *a
*a
aSorbonne Université, CNRS, Laboratoire de Chimie Physique-Matière et Rayonnement, LCPMR, F-75005 Paris Cedex 05, France. E-mail: iyas.ismail@sorbonne-universite.fr; francis.penent@sorbonne-universite.fr
bNano and Molecular Systems Research Unit, University of Oulu, PO Box 3000, FI-90014, Finland
cISMO, CNRS UMR 8214, Université, Paris-Sud, bâtiment 350, F-91405, Orsay, France
dSynchrotron SOLEIL, l'Orme des Merisiers, Saint-Aubin, BP 48, F-91192, Gif-sur-Yvette Cedex, France
eInstitute of Liberal Arts and Sciences, University of Toyama, 930-0194, Japan
fJozef Stefan Institute, Jamova Cesta 39, SI-1001 Ljubljana, Slovenia
First published on 12th August 2022
Abstract
Single-photon multiple photoionization results from electron correlations that make this process possible beyond the independent electron approximation. To study this phenomenon experimentally, the detection in coincidence of all emitted electrons is the most direct approach. It provides the relative contribution of all possible multiple ionization processes, the energy distribution between electrons that can reveal simultaneous or sequential mechanisms, and, if possible, the angular correlations between electrons. In the present work, we present a new magnet design of our magnetic bottle electron spectrometer that allows the detection of multiply charged Xen+ ions in coincidence with n electrons. This new coincidence detection allows more efficient extraction of minor channels that are otherwise masked by random coincidences. The proof of principle is provided for xenon triple ionization.
1 Introduction
The photoelectric effect1–4 is one of the cornerstones of modern physics, which is the origin of analytical methods such as X-ray photoelectron spectroscopy (XPS)5–7 in chemistry and surface science. To this end, high-resolution electron spectrometers have been developed, allowing also high-resolution Auger electron spectroscopy (AES) after inner-shell ionization. At first order approximation, the independent electron model and Koopmans' theorem8 are sufficient to understand the main lines resulting from inner-shell ionization in the photoelectron spectra. However, in addition to these main lines, satellite peaks corresponding to inner-shell ionization with simultaneous excitation of a valence electron (shake-up) also appear and are a first indication of electron correlations since the absorption of a single photon induces a two-electron process. If the second electron is not simply excited but ionized, shake-up becomes shake-off, i.e., double ionization (DI). Provided the photon energy is sufficient to reach multiple ionization thresholds, electron correlations make possible multiple ionization by absorption of a single photon. Conversely, multiple ionization studies provide a direct probe of electron correlations that can be accounted for at various levels of theory beyond the independent electron model with higher and higher accuracy. When the ionization process involves a deep inner-shell, cascade Auger decay becomes the dominant decay pathway leading to multiply charged ions due to the successive creation of shallower inner-shell vacancies.9,10 The first important information for multiple ionization processes are the absolute cross-sections. For valence multiple ionization, these cross-sections typically decrease by one order of magnitude from n to the next n + 1 ionization levels. They can be determined by ion spectroscopy by analyzing the different charge states (e.g., Li3+, ref. 11), but this provides little, if any, information on the pathways and mechanisms leading to multiple ionization. When inner-shell ionization is involved, a similar decrease by one order of magnitude is observed between single, double and multiple Auger decay and is again a direct result of electron correlations in the intermediate core-ionized states.2 Experimental approaches
The deep understanding of the mechanisms of multiple ionization relies experimentally on the detection of all the electrons in coincidence. This has been a very active field for double ionization of the simplest systems such as He and H2 in the past decades.12–15 Fully differential cross sections were obtained with reaction microscopes16 or related techniques and were well interpreted by sophisticated theoretical models.17–19 For higher ionization levels (triple, quadruple…), complete angular correlation between all electrons becomes experimentally unattainable, although it remains possible, for instance, to determine the angular correlation between two electron out of three (for example, between two Auger electrons in double Auger decay20). Nevertheless, energy correlation (without angular correlation) between many electrons remains possible in most cases.2.1 The magnetic bottle
Since 2003,21 experiments using magnetic bottle time-of-flight electron spectrometers22,23 have allowed the study of multiple ionization processes with good energy resolution and have shown a very high sensitivity, able to reveal weak processes such as two-site double core hole ionization (K−1 K−1) which is only ∼10−5 fraction of the prominent K−1 ionization channel (see ref. 24 and references therein). Many multiple ionization channels have been revealed by this technique. For triple ionization, different channels have been observed and identified. Below the 2p inner-shell ionization threshold for Ar25 and the 1s for Ne,26 and in core valence–valence triple ionization of Ne,27 a complete energy correlation between 3 electrons was obtained. For Kr and Xe, triple ionization occurs with 3d and 4d inner-shell ionization and results from the double Auger decay after Kr 3d28,29 or Xe 4d ionization30 or from a single Auger decay following core (3d, 4d) valence (4l, 5l) double ionization.31,32 These last two processes have comparable cross-sections both resulting from correlations between two or three electrons in the Kr+ (3d−1) or Xe+ (4d−1) intermediate state, allowing double Auger decay, or in the initial Kr or Xe neutral state, allowing core-valence double ionization followed by single Auger decay.The strength of the magnetic bottle spectrometer lies in its very high detection efficiency. The magnetic mirror configuration, that results from the strong inhomogeneous magnetic field of a permanent magnet (or electromagnet) that decreases rapidly with r as (L/r)3 (L is a characteristic dimension of the magnet ∼1 cm, typically: Bmax ∼1 T, (∂B/∂z) ∼ 0.1 T mm−1), collects the electrons in almost the entire 4π solid angle for energies from 0 to ∼200 eV. In a distance of a few mm–cm, the electrons produced in the strong field region become almost aligned with the B-field because B1/2/sin![[thin space (1/6-em)]](https://www.rsc.org/images/entities/char_2009.gif) Θ (Θ is the angle between the electron velocity and the B-field line) is conserved in the adiabatic approximation22 (which assumes that ∂B/∂Bz is small in one cyclotron gyration of the electron). At higher energies, the collection angle progressively decreases (∼30% at 1 keV) as the adiabatic approximation fails and fast electrons are no longer confined on their initial B-field line. Once the electrons trajectories are parallelized, the homogeneous weak magnetic field (∼1 mT) of a long solenoid (∼2 m) guides the electrons towards a microchannel plates (MCPs) assembly (Z-stack) detector.
Θ (Θ is the angle between the electron velocity and the B-field line) is conserved in the adiabatic approximation22 (which assumes that ∂B/∂Bz is small in one cyclotron gyration of the electron). At higher energies, the collection angle progressively decreases (∼30% at 1 keV) as the adiabatic approximation fails and fast electrons are no longer confined on their initial B-field line. Once the electrons trajectories are parallelized, the homogeneous weak magnetic field (∼1 mT) of a long solenoid (∼2 m) guides the electrons towards a microchannel plates (MCPs) assembly (Z-stack) detector.
The electron detection efficiency of MCPs, which is mainly determined by the open area ratio (OAR), is about 60% for standard MCPs, but can be ∼90% higher for tapered MCPs.33–35 For the detection in coincidence of 4 electrons (2 PE, 2 Auger) in the K−2 process, an overall efficiency of ∼20% was obtained.36 With a 2 m time-of-flight tube, the energy resolution ΔE/E is about 1.5–2%. This resolution is generally better than that of a reaction microscope, and the absolute energy resolution can be further improved by slowing down the electrons, but at the cost of losing low-energy electrons. The major limitation of the MB-TOF is the loss of any angular information, since it is no longer possible to reconstruct the trajectories from the detector back to a zone of highly inhomogeneous B-field where the electrons are generated. However, if 3 or more electrons are emitted, this angular information and the complete angular correlation between 3 electrons are no longer experimentally achievable (even with reaction microscopes).
2.2 Electron multi-coincidences
In order to identify and unambiguously characterize the different multiple ionization processes, the n electrons emitted during n-ionization must be detected in coincidence with good energy resolution. Since the detection efficiency, even as high as possible, is never 100%, there is a contamination of the n-ionization signal by higher order ionization processes where one or more electrons are not detected. If the dominant process is single ionization or single Auger decay after inner-shell ionization, this remains a minor problem because this contribution from the n + 1 ionization levels is about one order of magnitude lower than the signal for n ionization. However, for deep inner-shell ionization, there is a dominant cascade decay channel leading to the most likely charge state N+, which may also be contaminated by higher ionization processes (N + i)+. The dominant N+ ionization channel may also strongly contaminate the lower ionization channels (N − i)+. However, this contamination can be accurately estimated and often appears in a different energy range when the energy balance is considered. A more acute problem is due to parasitic processes37 that can cause “unexpected” false coincidence events for higher order ionization channels. One of these processes results from collisions of fast electrons on surfaces that can produce low energy electrons in a (1e → ne) process. This leads to contamination of the nth-order ionization signal by a lower mth-order signal and can be significantly high. In addition, when an excited ion encounters a surface, electrons can be emitted (as in the case of Penning ionization by He+* ions) that are time-delayed due to the drift of the ions (which prohibits time to energy conversion for these electrons) and produce a false coincidence signal at any time (resulting in a spurious signal mostly at low energy after time to energy conversion). To obtain accurate results for multiple ionization channels, the true coincidence signal should not be heavily contaminated by either random coincidences (which are only statistical) nor by false coincidences when parasitic electrons are produced. Although an estimation of “pure” random coincidences is possible (roughly, by raising to the power n the 1D signal and scaling it), it can be tedious.38–40 Subtracting these random coincidences from an n-dimension data set (n-dimension matrix with sparse events) is not straightforward and relies on an algorithm to handle (multidimensional) “images”. Often, these random coincidences appear in regions of n-dimensional space that do not overlap with the n-ionization signal due to the energy difference between the different n-ionization levels. In this case, there is no need to subtract the signal of the random coincidence. However, it becomes more difficult when a minor ionization channel produces electrons that overlap in a n-dimension energy region with a prominent process (the minor channel must be, at least, higher than the statistical fluctuations of the dominant channel). The “undesirable” false coincidences (due to secondary electron processes) may be more problematic, since they may depend nonlinearly on the signal due to threshold or saturation effects. Our goal here is not to explicitly develop a method for removing this background, since many different situations can arise, but to show that we can essentially get rid of it by detecting the specific charged ion in coincidence with the associated electrons.2.3 Electrons–ion coincidences
A very stringent method to filter out coincident events for n-ionization is to detect n-electrons in coincidence with the associated Xn+ ion. This drastically reduces the contribution of false coincidences from lower ionization levels. If we assume that the main contribution to the random coincidences at level n + 1 comes from ionization level n with one random electron or from level n − 1 plus two random electrons, we can eliminate such contributions by detecting the n charged ion in coincidence with n electrons. This also works if only n electrons among (n + 1) are detected with an X(n+1)+ ion. By selecting n electron coincidence events and detecting an Xn+ ion in coincidence, we are able to detect the true n ionization events and also accurately estimate the random coincidences where a different ion charge state is detected. This method has shown its efficiency in the past41,42 but there were some limitations that we have tentatively reduced in the present work to meet our specific requirements. In this paper, we describe the prototypical simple experimental setup that was built and validated. We show how this setup was used to reveal minor processes in the triple ionization of xenon. Below, we summarize some of the methods that have been used to detect electrons and ions in coincidence with a magnetic bottle spectrometer and compare their respective advantages and possible weakness. Only magnetic bottle experiments are discussed here and not “reaction microscopes” in which the detection of electrons and ions is the “normal” mode of operation. In the experiments of ref. 41 and 42, the magnetic bottle spectrometer uses a simple conical permanent magnet. To detect ions in coincidence with electrons, their option was to detect ions on the same detector as electrons. To do this, a high pulsed potential V ∼ 4 kV is applied to the magnet (after some delay after the ionizing light pulse or, eventually, after the detection of the faster electron) to accelerate the ions to give them enough energy to be detected by the MCPs, which are polarized for electron detection. The time of flight of ions (a few tens of μs) is much longer than that of the electrons. This method is efficient and does not result in a loss in energy resolution for the electrons. However, it is not the best option for ion resolution (a much shorter ion TOF tube with Wiley McLaren geometry provides better q/M resolution), nor for detection efficiency for fragmenting molecules,42 since ions with too high initial transverse momentum are lost. Another possible drawback is the power dissipation for the pulsed field, which varies with fV2 (f is the pulse frequency). Without a high-power, high-voltage supply, it may be difficult to pulse the extraction field at more than a few kHz. In single-bunch operation of synchrotron sources, the light pulse repetition rate is typically 1 MHz, and with the light chopper we use, it is 80 kHz.43 Extraction of ions with a pulsed field at this frequency is easier with a lower voltage (∼100 V) and is also better to limit inductive signals on the detector during the steep (∼10 ns) rising and falling edges of the HV pulse (although this parasitic signal can be vetoed). A second possibility is to extract the ion perpendicular to the MB axis through a pulsed electric field (the ions trajectories being little disturbed by the B field), with the detector located upstream of the inlet of the target gas.44 Although the geometry of the electrodes used to extract the ions might appear to be a perturbation for the electrons, this is not a major problem. However, for us, this was not an option because, for metallic vapors which we want to investigate further, a cold trap is positioned in front of the oven and it is not possible to insert the ion detector there.Another solution is to use a ring magnet and to extract the ions in the direction opposite to the electrons. This solution was first developed by Eland et al.45 and demonstrated its efficiency for ion detection at high repetition rates. The main drawback is that the magnetic field and gradient produced by such a magnet are much lower (B ∼ 0.1 T) than for a plain magnet, and the relative energy resolution for electrons is therefore strongly reduced to about 5%. In the work of ref. 46, a different magnetic field configuration was optimized that produces a strong B field and a steep gradient with a 5 mm diameter hole in the magnet to extract the ions. This system allows very good detection for the ions and high resolution for the electrons (even with a short MB-TOF). Unfortunately, the chosen geometry only allows the installation of a gas inlet needle and prohibits the close approach of an oven for metallic vapors47–49 with a water-cooled shield. For NdBFe permanent magnets, the temperature of the magnet must remain below 80 °C, while the oven can be heated up to 800 °C (∼535 °C for Li P = 10−2 torr50). With SmCo magnets, a temperature of 350 °C could be sustainable without cooled shielding. However, the dimensions of the oven are too large (see Fig. 8 in ref. 50) and prohibit approaching the magnet tip, resulting in a rapid loss of density of the metal vapor target.
Our solution to circumvent most of these difficulties was to design a first simplest magnet configuration with a drilled soft iron pole magnetized by 12 (4 × 3) cubic permanent magnets. Using the RADIA package (ESRF),51 we found that the optimal geometry is to mount the magnets in a cross shape with a conical soft iron pole (Fig. 1). The magnets magnetization vector lie in the XY plane and point toward the Z-axis, the B field is channeled through the drilled conical soft iron pole in the Z direction. Using cheap commercial (NdFeB) 12 mm cubic magnets (0.5 T at the contact), a field of 0.9 T is measured on the Z-axis at the tip of the soft iron pole piece (as calculated by RADIA simulations). The shape of the permanent magnets and the soft iron pole could certainly be further optimized (although this is not trivial) to increase the field strength52 while maintaining access to the oven and cold trap, but we have chosen the simplest prototype based on readily available, inexpensive permanent magnets that meets all of our requirements. This cross geometry with the conical pole allows the oven exit to be close enough to the magnet axis so that the density in the metal vapor target is sufficient. The hole in the soft iron pole had a diameter of 2 mm.
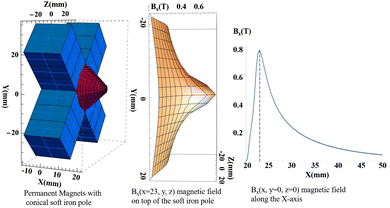 | ||
| Fig. 1 The magnetic field configuration calculated by RADIA software.51 | ||
A second version of the cross-shaped magnet assembly, using four 20 × 20 × 30 mm magnets (see Fig. 1), with a 4 mm hole in the soft iron pole was built and successfully tested. The magnetic field in the Z-axis is similar in both cases, but the 4 mm hole allows a better detection of ions. A plate with a hole covered by a Mo grid (85% transparency) is placed directly in front of the conical soft iron pole (see Fig. 2). Ion extraction is performed by applying a pulsed +200 V potential to a grid located 1 cm from the magnet parallel to the plate. The distance between the magnet tip and the photon beam is 3 mm, so the ions are accelerated to ∼60 V as they enter the drilled pole piece. The magnetic field at this distance is about 0.3 T and the B gradient remains high enough to provide good resolution for the electrons (∼2%). At this energy, the ions fly a distance of 15 mm inside the pole piece and are further accelerated to 1 kV by a few electrodes polarized with a resistive divider. Although second-order focusing conditions53 are not satisfied here, we can distinguish all possible charge states of all xenon isotopes. A 12 cm long TOF tube for ions54 was used with a flight at 1 kV before accelerating the ions at ∼2 kV on the front of the MCP detector to achieve a good detection efficiency (the MCP signal is extracted on the ground by capacitive decoupling for sake of simplicity). This acceleration voltage is probably not sufficient to ensure efficient detection of the low Xe charge states44 and might explain some loss of ions in coincidence with electrons.
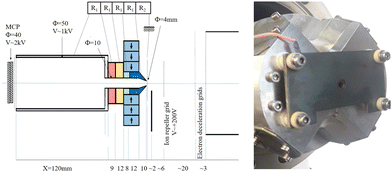 | ||
| Fig. 2 Schematic of the new magnetic bottle design and ion time-of-flight setup. (left) a photo of the cross-shaped magnet assembly with a hole diameter of 4 mm. | ||
2.4 Experimental procedure
Using the asynchronous chopper,43 the selected light pulse passing through is detected at a frequency of 80 kHz by a ceramic channeltron (Dr Sjuts KBL1010 10 × 10 mm2) inserted into the photon beam 20 cm after the interaction region. This signal triggers the pulsed field to extract the ions. The pulser is based on a BEHLKE switch (HTS 61-03 GSM), which is triggered by a TTL signal. This switch can in principle commute voltages up to 6 kV, but 100–200 V was sufficient for us to extract the ions.It is worth noting that the setup can also be operated in continuous mode (without pulsed extraction): a constant potential of 3 V is applied to the grid and accelerates electrons and ions in opposite directions and allow to perform electron(s)/ion(s) coincidences. This mode results in a broadening of the electron resolution by about 100 mV when the photon beam size is 300 μm. For pulsed mode, the typical time delay of the electronics is 300 ns and, during this time, the electrons generated by the photon pulse have already traveled several cm within the MB TOF while the ions remain in the interaction region. To avoid any disturbance of the electrons by the electric field during the pulse, a highly transparent gold mesh (95%) is placed 4 cm away from the interaction region. Regardless of whether the pulser was in operation or not, no difference was observed in the TOF spectrum of the electrons. This ensures that the shielding of the ion extraction voltage pulse by this grid is sufficient for the electrons. The 200 V pulse allows the switch to operate at a frequency of 80 kHz, and the HV power supply doesn't fail. We did not attempt to wait for the detection of a first electron to apply the extraction pulse41 since the electrons time-of-flight time of 1 to 5 μs could have been too long for the ions to remain in the interaction region. The rising edge of the voltage pulse is about 10 ns and induces transient signals by capacitive (or inductive) coupling to the different detectors. However, it was sufficient to set the thresholds of the constant fraction discriminators (CFD) for the electron, ion and photon detectors, high enough to suppress such parasitic signals, while the actual signal count rate remained almost unchanged (no veto of the signal during the pulse rise or fall was required). Fig. 1 shows the magnetic field configuration modeled with RADIA software.51 The effect of the magnetic field on the ions is not really significant because their velocity is low and their time of flight for q/m analysis is based only on the electric potentials, as confirmed by the simulation of the SIMION ion trajectories.
3 Experimental results
The upgraded HERMES experiment was installed at the SEXTANTS beamline of the synchrotron radiation facility SOLEIL. Our new setup of multi-electron–ion coincidence was used to study multi-ionization processes of xenon atoms, as a proof of principle.A photon energy of 136 eV was used, allowing to open 4d−1 single and 4d−15l−1 (l = p, s) double ionization (shake-off) thresholds. In particular, we focused on the triple ionization channel of Xe. In our previous work, we investigated the two “main pathways” of Xe3+ production.
The double Auger decay after 4d inner-shell ionization:30
| Xe + hν → Xe+(4d−1) + eph1− |
| → Xe3+(5p−3) + eA1− + eA2− |
The single Auger decay after 4d−15p−1 double ionization:48
| Xe + hν → Xe2+*(4d−15p−1) + eph1− + eph2− |
| → Xe3+(5p−3) + eA1− |
In this work we are more interested by a third ‘minor’ channel that could not be measured before:
| Xe + hν → Xe2+*(4d−15s−1) + eph1− + eph2− |
| → Xe3+ + eA1− |
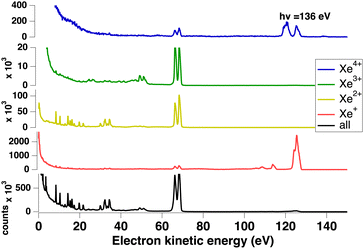
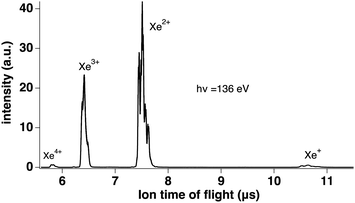
We measured Xeq+ ions in coincidence with electrons. Fig. 3 shows the electron spectra obtained from all electrons (without filtering by ion coincidence) and in coincidence with one of the Xeq+ ions (q ≤ 4). The dominant channel is double ionization due to Auger decay after 4d ionization. However, triple ionization is also important, while singly (due to valence ionization) and quadruply charged ions make a minor contribution (the Xe4+ threshold is about 105 eV55 and a possible pathway could be shake-off to highly excited doubly ionized 4d−15l−2nl states followed by double Auger decay). Ion time-of-flight Fig. 4 shows the production of Xeq+ ions (q ≤ 4) ions. Although the ion time-of-flight is not fully optimized for mass resolution,53 the different xenon isotopes (M = 124–136) are almost resolved. However, our goal is only to separate the different charge states.
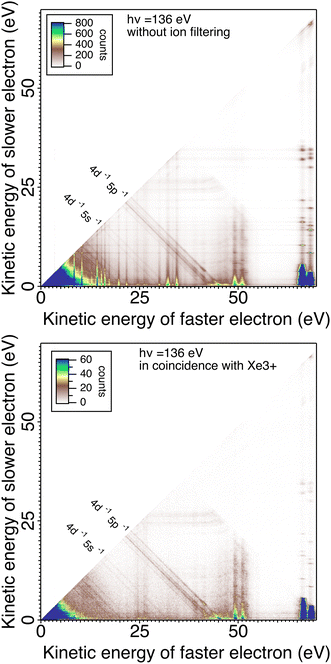
In Fig. 5 we plot the coincidences between two electrons out of three (with all possible permutations) when exactly three electrons are detected and when a triply charged Xe3+ ion is detected or not in coincidence with those 3 electrons. The fraction of electrons triplets in coincidence with an Xe3+ ion is only ∼10% of the total number of three-electron events. This ratio results in part from the efficiency of the MCPs for ion detection, but certainly also from the different source volume seen for electrons and ions. The interaction volume seen by the electron MCP detector can be derived from the magnification of the magnetic bottle  (the field in the interaction region is between 0.2 and 0.4 T and 1 mT in the solenoid). It is therefore ∼2–3 mm (with 40 mm MCP) along the photon beam crossing the effusing gas target and larger than the 2 mm hole for ion extraction. With the 4 mm hole magnet, the detection of ions was increased and the electron/ion coincidence is higher.
In Fig. 5, without ion filtering, we see vertical and horizontal stripes resulting from random coincidences with an Auger electron, which is the dominant process. We also see a large increase in random coincidences in the low energy corner. When the 3-electron signal is filtered with the triply charged ion, these false coincidences disappear and the double Auger decay of the 4d hole30 appears clearly in the low energy corner. Two vertical stripes around E1 = 25 eV remain visible, corresponding to the prominent Auger lines of the 4d−15p−1 Xe2+ decay (they are in coincidence with one of the two photoelectrons sharing ∼45 eV).
The two 4d3/2,5/2 photoelectron lines at respectively ∼66 and 68 eV are associated in this spectra to the double Auger decay that was studied in details at a photon energy of ∼110 eV.30 The double Auger spectra is exactly equivalent and shows that the electron resolution has not been altered with the hollow magnet allowing ion detection. The double Auger decay gives two Auger electrons sharing less than 5.4 eV kinetic energy. Around ∼49 and 51 eV two lines appear clearly that correspond to 4d shake-up states.56 Although there are many possible configurations for shake-up states in this region, our limited energy resolution of about 1 eV for 50 eV electrons seems to average the states and shows two main lines corresponding to 4d−15p−1 6p with the characteristic 4d3/2,5/2 fine-structure splitting of 2 eV. Two other weaker lines at ∼45 and 47 eV could also be assigned to 4d−15p−1 7p satellites. Just below this energy the shake-off process 4d−15p−1 appears as diagonal lines.48
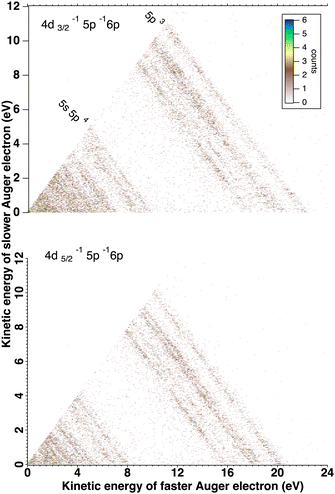
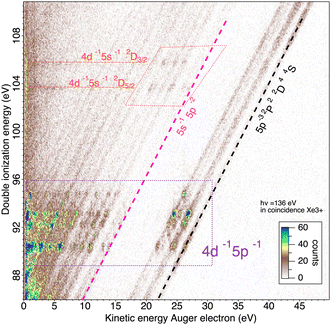
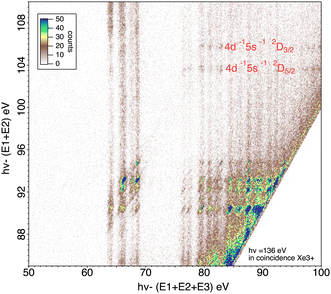
We will briefly analyze the double Auger decay associated to the main shake-up lines 4d−15p−1 6p. These photoelectrons are coincident with two Auger electron sharing less than ∼20 eV and the coincidence between these two Auger electrons appear in the low energy corner as diagonal line corresponding to E1 + E2 < 22 eV that are also more clearly seen in coincidence with Xe3+ ions. By selecting in the 3 electron/Xe3+ coincidence event, the events where an electron is a photoelectron due to 4d3/2,5/2−15p−1 6p satellite (K.E. ∼ 49 and 51 eV), we obtain the two 2D maps of Fig. 6 showing the coincidence between the two Auger electrons toward the final Xe3+ states. The double Auger decay from satellite states populates not only 5p3 state but also 5s5p2 states. Although, the energy resolution is not as good as for very low energy electrons, we can see that the cascade Auger decay is dominant. The identification of the intermediate states in the cascade is more than challenging and will not be done here. If we focus now our attention in the region 20 < E1 + E2 < 50 eV, we exclude most of the diagonal lines corresponding to double Auger decay (although double Auger decay from 4d−15s−1nl satellites could also be present). The dominant diagonal line at E1 + E2 ∼ 45 eV corresponds to 4d 5p double ionization(shake-off) previously studied,48 the weaker two line at E1 + E2 ∼ 30 eV are due to 4d 5s double ionization. To better show the binding energies of those double ionized states, we plot in Fig. 8hν − (E1 + E2) against the energy E3 of the third (Auger) electron. To facilitate the identification of the process, we compiled in Fig. 7 the relevant energy level data for Xe from literature.57 The horizontal bands between 90 and 95 eV can be attributed to the Xe2+ 4d−15p−1 states and their specific Auger decay is observed.48 The final Xe3+ states appear as diagonal lines. In these lines, direct triple ionization partially contributes in addition to the misgrouped electron pairs created by our sorting method. What can be seen now are two stripes at 104–106 eV binding energy. These two lines correspond to 4d−15s−1 2D5/2,3/2 double ionization, with the 4d5/2,3/2 2 eV spin–orbit splitting, and are now clearly observed thanks to ion filtering, whereas in our previous work they were not observed48 because they were obscured by random coincidences. This clearly demonstrates the efficiency of our new ion/electron coincidence technique for studying such low cross-section events, which would otherwise not be possible.
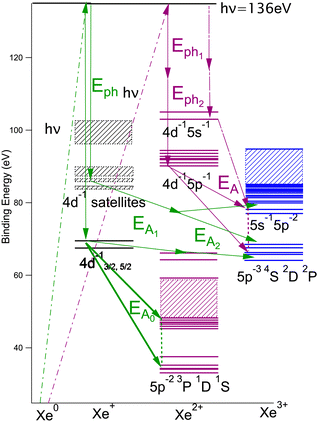 | ||
| Fig. 7 Level diagram of the energy levels relevant for the interpretation of Fig. 8. | ||
It is also possible to obtain the specific Auger decay of these two states 4d−15s−1 2D5/2,3/2. Another presentation of the data (Fig. 9) can be given by plotting the energy of the intermediate states given by hν − (E1 + E2) against the energy of the final Xe3+ states given by hν − (E1 + E2 + E3). In this figure the final states appear as vertical lines and the continuous intensity along a line is not only due to direct triple ionization with energy sharing between 3 electrons but also to the two summation (EPE1 + EA) and (EPE2 + EA) when the energy of the intermediate state is given by hν − (EPE1 + EPE2). By subtracting a background obtained in the region where no intermediate states (horizontal lines) are visible, it is possible to obtain the Auger spectra or (equivalently) the energy of the final states by a projection of an horizontal stripe on the X-axis (Fig. 10). We observe that the decay of the 4d−15s−1 states populates mainly the Xe3+ 5s 5p4 states, the 5s hole remaining spectator. The possible decay toward Xe3+ 5p3 final states is much more difficult to interpret. That would need a process involving three 5p electrons with simultaneous filling of 4d and 5s vacancies by two 5p electrons, the third 5p electron taking the energy being the Auger electron. That should be however a weak Auger process (unless a mixing of 5s5p6 and 5s2 5p5 states due to configuration interaction allows such Auger decay by a two-electron process). The peak going to the Xe3+ 5p3 state could also be an artefact coming from the 4d−15p−1 for which a combination the sum of two energies (EPE + EA) coincidences with (EPE1 + EPE2) for 4d−15s−1. There is apparently no way to exclude this process since is will be possible at any photon energy. Nor we can completely rule out the contribution of the double Auger from 4d−15s−1nl states that could populate the Xe3+ 5p3 states though cascade Auger decay with successive filling of the 4d and 5s vacancies. This process could be distinguished from double ionization followed by single Auger decay by varying the photon energy. The photon energy difference can be taken by one or two photoelectrons while the Auger energies remain constant. Unfortunately, these weak processes need high statistics to be extracted, meaning long acquisition time, that was not possible for different photon energies. If we go above ∼145 eV photon energy the 4p ionization channel opens and new Auger processes occur58 that will make the interpretation of the multi-electron coincidence even more difficult, and will lead to higher charge states.
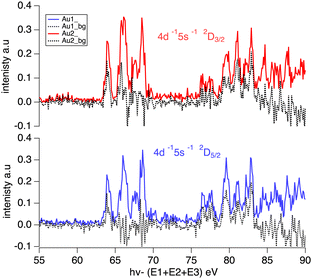 | ||
| Fig. 10 The energy of the final Xe3+ states obtained by projecting the horizontal stripes corresponding to 4d−15s−1 2D5/2,3/2 states shown in Fig. 9 onto the X axis. The black dotted lines are the same projections after suppression of the estimated background obtained in the region where there are no intermediate states (horizontal lines). | ||
The present results conclude the previously published results obtained at 120 eV photon energy48 showing clearly the double Auger decay from satellite states and 4d 5s double ionization.
4 Conclusion
We have developed a new powerful setup for electron(s)–ion coincidences. This system offers many advantages. It allows efficient detection of ions and electrons in coincidence at a high repetition rate of light pulses without compromising the energy resolution of the magnetic bottle for the electrons. In addition, the chosen geometry and magnets allow a flexible design for good access to an oven and cold trap for future experiments with metal vapors. It was also possible to use this setup to disentangle the electron spectra from gas mixtures and is was very easy to obtain the He I (21.21 eV) well-known electron spectra of O2, N2 and Ar with air. This could be also important when studying metal vapors in case of the presence of impurities (other alkali metals…).Conflicts of interest
There are no conflicts to declare.Acknowledgements
The experiment was performed at SOLEIL Synchrotron(France) at the SEXTANTS beam line (project no. 20150359). We are grateful the SOLEIL staff for stable operation. M. A. K. acknowledges the support of the Labex Plas@Par managed by the Agence Nationale de la Recherche, as part of the “Programme dInvestissements dAvenir” under Reference No. ANR-11-IDEX-0004-02.Notes and references
- H. Hertz, Ann. Phys., 1887, 267, 983–1000 CrossRef
.
- W. Hallwachs, Ann. Phys., 1888, 269, 301–312 CrossRef
.
- P. Lenard, Ann. Phys., 1902, 313, 149–198 CrossRef
.
- A. Einstein, Ann. Phys., 1905, 322, 132–148 CrossRef
.
- J. Jenkin, R. Leckey and J. Liesegang, J. Electron Spectrosc. Relat. Phenom., 1977, 12, 1–35 CrossRef CAS
.
- K. Siegbahn, C. Nordling, A. Fahlman, R. Nordberg, K. Hamrin, J. Hedman, G. Johansson, T. Bergmark, S. Karlsson, I. Lindgren and B. Lindberg, Nova Acta Reg Soc Sci Upsaliensis Ser. IV, 20 Uppsala, 1967 Search PubMed
.
- H. P. Bonzel and C. Kleint, Prog. Surf. Sci., 1995, 49, 107–153 CrossRef CAS
.
- T. Koopmans, Physica, 1934, 1, 104–113 CrossRef
.
- I. Suzuki, Y. Hikosaka, E. Shigemasa, P. Lablanquie, F. Penent, K. Soejima, M. Nakano, N. Kouchi and K. Ito, J. Phys. B: At., Mol. Opt. Phys., 2011, 44, 075003 CrossRef
.
- A. Kochur, V. Sukhorukov, A. Dudenko and P. V. Demekhin, J. Phys. B: At., Mol. Opt. Phys., 1995, 28, 387 CrossRef CAS
.
- R. Wehlitz, M.-T. Huang, B. DePaola, J. Levin, I. Sellin, T. Nagata, J. Cooper and Y. Azuma, Phys. Rev. Lett., 1998, 81, 1813 CrossRef CAS
.
- A. Huetz and J. Mazeau, Phys. Rev. Lett., 2000, 85, 530 CrossRef CAS
.
- H. Bräuning, R. Dörner, C. Cocke, M. Prior, B. Krässig, A. Kheifets, I. Bray, A. Bräuning-Demian, K. Carnes and S. Dreuil,
et al.
, J. Phys. B: At., Mol. Opt. Phys., 1998, 31, 5149 CrossRef
.
- T. Weber, A. O. Czasch, O. Jagutzki, A. Müller, V. Mergel, A. Kheifets, E. Rotenberg, G. Meigs, M. H. Prior and S. Daveau,
et al.
, Nature, 2004, 431, 437–440 CrossRef CAS PubMed
.
- F. Martn, J. Fernández, T. Havermeier, L. Foucar, T. Weber, K. Kreidi, M. Schoffler, L. Schmidt, T. Jahnke and O. Jagutzki,
et al.
, Science, 2007, 315, 629–633 CrossRef PubMed
.
- R. Dörner, V. Mergel, O. Jagutzki, L. Spielberger, J. Ullrich, R. Moshammer and H. Schmidt-Böcking, Phys. Rep., 2000, 330, 95–192 CrossRef
.
- P. Selles, L. Malegat and A. Kazansky, Phys. Rev. A: At., Mol., Opt. Phys., 2002, 65, 032711 CrossRef
.
- C. W. McCurdy, D. A. Horner, T. N. Rescigno and F. Martin, Phys. Rev. A: At., Mol., Opt. Phys., 2004, 69, 032707 CrossRef
.
- W. Vanroose, F. Martin, T. N. Rescigno and C. W. McCurdy, Science, 2005, 310, 1787–1789 CrossRef CAS PubMed
.
- J. Viefhaus, A. N. Grum-Grzhimailo, N. M. Kabachnik and U. Becker, J. Electron Spectrosc. Relat. Phenom., 2004, 141, 121–126 CrossRef CAS
.
- J. H. Eland, O. Vieuxmaire, T. Kinugawa, P. Lablanquie, R. Hall and F. Penent, Phys. Rev. Lett., 2003, 90, 053003 CrossRef CAS PubMed
.
- P. Kruit and F. Read, J. Phys. E: Sci. Instrum., 1983, 16, 313 CrossRef CAS
.
- G. Beamson, H. Porter and D. Turner, J. Phys. E: Sci. Instrum., 1980, 13, 64 CrossRef CAS
.
- P. Lablanquie, F. Penent and Y. Hikosaka, J. Phys. B: At., Mol. Opt. Phys., 2016, 49, 182002 CrossRef
.
- Y. Hikosaka, P. Lablanquie, F. Penent, T. Kaneyasu, E. Shigemasa, R. Feifel, J. Eland and K. Ito, Phys. Rev. Lett., 2009, 102, 013002 CrossRef CAS PubMed
.
- J. H. Eland, P. Linusson, L. Hedin, E. Andersson, J.-E. Rubensson and R. Feifel, Phys. Rev. A: At., Mol., Opt. Phys., 2008, 78, 063423 CrossRef
.
- Y. Hikosaka, P. Lablanquie, F. Penent, J. Palaudoux, L. Andric, K. Soejima, E. Shigemasa, I. Suzuki, M. Nakano and K. Ito, Phys. Rev. Lett., 2011, 107, 113005 CrossRef CAS
.
- J. Palaudoux, P. Lablanquie, L. Andric, K. Ito, E. Shigemasa, J. Eland, V. Jonauskas, S. Kučas, R. Karazija and F. Penent, Phys. Rev. A: At., Mol., Opt. Phys., 2010, 82, 043419 CrossRef
.
- E. Andersson, S. Fritzsche, P. Linusson, L. Hedin, J. H. Eland, J.-E. Rubensson, L. Karlsson and R. Feifel, Phys. Rev. A: At., Mol., Opt. Phys., 2010, 82, 043418 CrossRef
.
- F. Penent, J. Palaudoux, P. Lablanquie, L. Andric, R. Feifel and J. Eland, Phys. Rev. Lett., 2005, 95, 083002 CrossRef CAS PubMed
.
- E. Andersson, P. Linusson, S. Fritzsche, L. Hedin, J. H. Eland, L. Karlsson, J.-E. Rubensson and R. Feifel, Phys. Rev. A: At., Mol., Opt. Phys., 2012, 85, 032502 CrossRef
.
- M. Khalal, P. Lablanquie, L. Andric, J. Palaudoux, F. Penent, K. Bučar, M. Žitnik, R. Püttner, K. Jänkälä and D. Cubaynes,
et al.
, Phys. Rev. A, 2017, 96, 013412 CrossRef
.
- S. Matoba, R. Takahashi, C. Io, T. Koizumi and H. Shiromaru, Jpn. J. Appl. Phys., 2011, 50, 112201 CrossRef
.
- S. Matoba, G. Ishikawa, S. Moriya, K. Takahashi, T. Koizumi and H. Shiromaru, Rev. Sci. Instrum., 2014, 85, 086105 CrossRef CAS PubMed
.
- K. Fehre, D. Trojanowskaja, J. Gatzke, M. Kunitski, F. Trinter, S. Zeller, L. P. H. Schmidt, J. Stohner, R. Berger and A. Czasch,
et al.
, Rev. Sci. Instrum., 2018, 89, 045112 CrossRef CAS PubMed
.
- F. Penent, M. Nakano, M. Tashiro, T. Grozdanov, M. Žitnik, K. Bučar, S. Carniato, P. Selles, L. Andric and P. Lablanquie,
et al.
, J. Electron Spectrosc. Relat. Phenom., 2015, 204, 303–312 CrossRef CAS
.
- A. H. Roos, J. Eland, J. Andersson, S. Zagorodskikh, R. Singh, R. Squibb and R. Feifel, Phys.
Chem. Chem. Phys., 2016, 18, 25705–25710 RSC
.
- L. Frasinski, M. Stankiewicz, P. Hatherly and K. Codling, Meas. Sci. Technol., 1992, 3, 1188 CrossRef
.
- A. E. Slattery, T. A. Field, M. Ahmad, R. I. Hall, P. Lablanquie and F. Penent, Meas. Sci. Technol., 2002, 13, 2007 CrossRef CAS
.
- A. Hans, C. Ozga, P. Schmidt, G. Hartmann, A. Nehls, P. Wenzel, C. Richter, C. Lant, X. Holzapfel and J. Viehmann,
et al.
, Rev. Sci. Instrum., 2019, 90, 093104 CrossRef CAS PubMed
.
- A. Matsuda, M. Fushitani, C.-M. Tseng, Y. Hikosaka, J. H. Eland and A. Hishikawa, Rev. Sci. Instrum., 2011, 82, 103105 CrossRef PubMed
.
- J. H. Eland, P. Linusson, M. Mucke and R. Feifel, Chem. Phys. Lett., 2012, 548, 90–94 CrossRef CAS
.
- K. Ito, F. Penent, Y. Hikosaka, E. Shigemasa, I. H. Suzuki, J. H. Eland and P. Lablanquie, Rev. Sci. Instrum., 2009, 80, 123101 CrossRef PubMed
.
- J. Eland, C. Slater, S. Zagorodskikh, R. Singh, J. Andersson, A. Hult-Roos, A. Lauer, R. Squibb and R. Feifel, J. Phys. B: At., Mol. Opt. Phys., 2015, 48, 205001 CrossRef
.
- J. H. Eland and R. Feifel, Chem. Phys., 2006, 327, 85–90 CrossRef CAS
.
-
S. Deinert, Aufbau eines hocheffizienten Photoelektronen-Photoion-Koinzidenzexperiments/ Setup of a Highly Efficient Photoelectron-Photoion-Coincidence-Experiment, PhD thesis, Fachbereich Physik der Universität Hamburg, 2013 Search PubMed
.
- J. Palaudoux, S. Sheinerman, J. Soronen, S.-M. Huttula, M. Huttula, K. Jänkälä, L. Andric, K. Ito, P. Lablanquie and F. Penent,
et al.
, Phys. Rev. A: At., Mol., Opt. Phys., 2015, 92, 012510 CrossRef
.
- M. Khalal, J. Soronen, K. Jänkälä, S. Huttula, M. Huttula, J. Bizau, D. Cubaynes, S. Guilbaud, K. Ito and L. Andric,
et al.
, J. Phys. B: At., Mol. Opt. Phys., 2017, 50, 225003 CrossRef
.
- J. Keskinen, P. Lablanquie, F. Penent, J. Palaudoux, L. Andric, D. Cubaynes, J.-M. Bizau, M. Huttula and K. Jänkälä, Phys. Rev. A, 2017, 95, 043402 CrossRef
.
- K. Ross and B. Sonntag, Rev. Sci. Instrum., 1995, 66, 4409–4433 CrossRef CAS
.
- O. Chubar, P. Elleaume and J. Chavanne, RADIA package (ESRF), https://www.esrf.fr/Accelerators/Groups/InsertionDevices/Software/Radia.
- F. Bloch, O. Cugat, G. Meunier and J. Toussaint, IEEE Trans. Magn., 1998, 34, 2465–2468 CrossRef CAS
.
- J. Eland, Meas. Sci. Technol., 1993, 4, 1522 CrossRef CAS
.
- F. Penent, R. Hall, R. Panajotović, J. Eland, G. Chaplier and P. Lablanquie, Phys. Rev. Lett., 1998, 81, 3619 CrossRef CAS
.
- E. B. Saloman, J. Phys. Chem. Ref. Data, 2004, 33, 765–921 CrossRef CAS
.
- A. Ausmees, S. Osborne, S. Svensson, A. N. de Brito, O.-P. Sairanen, A. Kivimäki, E. Nõmmiste, H. Aksela and S. Aksela, Phys. Rev. A: At., Mol., Opt. Phys., 1995, 52, 2943 CrossRef CAS PubMed
.
- A. Kramida, Yu Ralchenko, J. Reader and NIST ASD Team, NIST Atomic Spectra Database (ver. 5.9), National Institute of Standards and Technology, Gaithersburg, MD, 2021, [Online]. Available: https://physics.nist.gov/asd [2022, June 20].
- Y. Hikosaka, P. Lablanquie, F. Penent, T. Kaneyasu, E. Shigemasa, J. Eland, T. Aoto and K. Ito, Phys. Rev. Lett., 2007, 98, 183002 CrossRef CAS PubMed
.
| This journal is © the Owner Societies 2022 |

