 Open Access Article
The importance of water content on the conductivity of biomaterials and bioelectronic devices
A. Bernardus
Mostert

Department of Physics, Swansea University, Singleton Park, SA2, 8PP, Wales, UK. E-mail: a.b.mostert@swansea.ac.uk
First published on 23rd June 2022
Abstract
Conductive biocompatible-, bioinspired- and biomaterials are increasing in importance, especially in bioelectronic applications where these materials are used in a variety of devices. Given the intended purpose of many of these devices is to interface with the human body, a pertinent issue is the effect of water from the environment on the electrical properties of the materials and devices. A researcher on biomaterials may currently not be aware, but the conductivity of these materials and device performances can be significantly altered with the presence of hydration in the environment. Examples will be given to highlight the problem that the conductivity of biomaterials can change by orders of magnitude depending on water content. Furthermore, case studies will be discussed in which control of the water content was key to understanding the underlying charge transport mechanism of conductive biomaterials. Examples of various devices and their response to hydration content will also be covered. Finally, this perspective will also mention the various methods of hydration control (including contrast studies) that can be used to perform careful work on conductive biomaterials and devices. Overall, water content should be considered an environmental variable as important as temperature to control for sound scientific investigation and to yield understanding of conductive biomaterials and bioelectronic devices.
Dr Bernard Mostert is a materials researcher working on conductive biomaterials and bioelectronic devices. He received his PhD at the University of Queensland. He has had postdoctoral research associated positions at Lancaster University and the University of Queensland. Recently, he has finished a prestigious Marie Skłodowska-Curie fellowship at Swansea University. His specialty is understanding the charge transport mechanisms of biomaterials and devices as they are affected by water content. He has over a decade of experience in pioneering hydration control measurements in areas including electrical measurements, neutron and muon scattering measurements as well as magnetic resonance measurements. |
Introduction
Conductive biomaterials, bio-inspired or biocompatible materials are expected to address major societal challenges. These challenges include medical sensing & treatment, the ubiquitous sensing network and the expected concomitant rise in electronic waste (e-waste).The medical sensing and treatment challenge is foremost on the mind of governmental bodies, for example, the United States National Academy of Engineering has elucidated the need for ‘‘advanced health informatics’’ among its 14 grand challenges for engineering in the 21st century.1 Another example would be the United Kingdom: its Strategic Prospectus for Building the UKRI Strategy outlines several challenges including Clean Growth, Ageing Society and AI & Data Economy, which leads to the recognised need for medical devices to service an aging population.2 This interest by governments is shared by the pharmaceutical industry, which has coined the term “electroceuticals”, a medical field focused on using electrical signals to affect a medical outcome.3,4
Consequently from the above, rapid growth in research is being experienced in the field of bioelectronics, a field at the intersection of the physical, chemical and life sciences.5,6 There is a constant search to investigate new materials and to implement them into new devices for medical interventions, biosensors, monitoring devices etc. with the aim to directly read or write biological signals utilising conventional semiconductor-based electronics.6
Parallel to the aforementioned medical challenge and related to the theme of devices, is the concept of the ubiquitous sensor network. The goal of this vision is to have an environment that is seeded with low end sensing devices to monitor variables such as pressure, temperature, humidity et cetera.7 Such an endeavour promises greater understanding and control over a local environment, but it will contribute to the formation of additional e-waste. This latter problem is already significant due to the sheer volume of waste (45 megatons per year) but also that the waste can be hazardous to the environment.8 Indeed, there is a growing need to develop “green electronics”, i.e. to make device materials more eco-friendly and make devices with a lower energy input.9
A key solution to the above challenges will be the investigation, development and implementation of conductive biomaterials and their cognates.6,9,10 Biomaterials and their cognates show great promise, since nature herself offers an almost unlimited set of examples for inspiration.10 Medical devices, for example, based upon such materials should be easy to interface with the human body due to a built in biocompatibility. Other sensing devices based upon conductive biomaterials will have lower input energy costs associated with them as well as an inherent advantage of easy disposal to the environment due to their natural origin.
Given the origin or inspiration of conductive biomaterials and related materials (i.e. nature), it should be anticipated that their properties may be heavily affected by the presence of water in the environment. This includes the conductive properties of materials specifically pertaining to bioelectronic systems. Using a purely synthetic system, such as the proton ionomer Nafion as an example, a linear increase in water content can yield orders of magnitude change in the conductivity (∼2–4 orders depending on Nafion variation material).11–13 If this can be the case for a synthetic system, then water content should be an even more pertinent environmental variable for conductive biomaterial systems.
Here it is important to make a clarification. There are multiple variables that can influence the conductivity of a biomaterial. For example, using conductive fillers can enhance the conductivity of a biomaterial by orders of magnitude.14,15 However, such an approach is a synthetic/fabrication approach to modifying the baseline conductivity of the material, akin to doping within semiconductor materials. Discussed herein though is the effect of the environment on a conductive biomaterial. The most common variable to control for, is of course temperature. The purpose of this perspective is to argue for the importance of water content (derived from the environment) on conductive biomaterials, related systems as well as bioelectronic devices. Essentially, how does the native environment (i.e. wet) impact the conduction of a biomaterial, either neat or modified (e.g. conductively filled), and how can it inform the researcher on the underlying charge transport mechanism?
This article will attempt to show to the reader the importance of proper control of water content to enable accurate scientific investigation. By properly controlling the water content, the charge transport mechanism within biomaterials can be carefully elucidated.
To highlight this important issue of hydration control, this perspective will first discuss a number of materials systems in which water content significantly impacts the conductivity, in order to show that such effects can be fairly common. A section is then devoted to demonstrating how water control can give insight into the charge transport mechanism of a material. Hydration dependent performance of devices will also be discussed, which is then followed by a short introduction into how to perform hydration control for experiments.
Overall, the aim of this perspective is to convince the reader that water content derived from the environment of conductive biomaterials is a 1st order environmental variable similar to temperature, and therefore requires control.
Hydration dependent conductive biomaterial examples
This section is dedicated to demonstrate that a wide range of biomaterials can have their conductivity significantly modified by water content, which should demonstrate that these effects can be quite common.Knowledge of hydration effects on the conductivity of biomaterials has a long history, with reports dating back to the 1960's and 70's. Take, for example, the case of haemoglobin: when in crystalline form and dried, this material produced a temperature dependent activation energy of 2.3 eV, making it an insulator.16,17 However, when hydrated fully (∼7.5 weight percent) the activation energy decreased to 1.23–1.45 eV.16,17 This is a conductivity change of 9 orders of magnitude at room temperature (∼10−16–10−7 S cm−1), which was confirmed by hydration dependent current measurements.16,17 It should be noted that this is equivalent to a 250 degree Kelvin change for the dry system, which is a large change. The case of crystalline haemoglobin is instructive and it will be discussed further later on.
A biomaterial of interest in bioelectronic systems is maleic chitosan, a polysaccharide. This material was utilised by Zhong et al. in creating the first ever proton field effect transistor (FET).18 From their work, the conductivity (proton in origin) can be estimated to be changing from ∼3 × 10⁻⁶ S cm−1 at 55% Relative Humidity (RH) to ∼1 × 10⁻⁴ S cm−1 at 75% RH, a 2 orders of magnitude change over a narrow range of hydration. Earlier work by Wan et al. showed that from dry to 95% RH conductivity changed from ∼10−9 S cm−1 to between ∼10−5–10−4 S cm−1 depending on molecular weight.19
Collagen has also been shown to have large changes in its conductivity due to hydration. From 8% to 40% water content yields 6 orders of magnitude change, with the activation energy decreasing from 1.15 eV to 0.58 eV.20 If one uses an average activation energy of ∼0.86 eV for the 8% to 40% range, it would require an equivalent temperature change of 200 K to achieve similar results. An additional change from 40% to 126% water content leads to 2 more orders of conductivity increase with an activation energy change of 0.58 eV to 0.28 eV.20 By using hydration dependent conductivity methods, it was suggested that the initial changes were due to proton conductivity, whereas changes at high water contents are due to mobile small ions present in collagen. Similar changes in the current as a function of hydration has been observed by Powell & Rosenberg.21
Lysozyme has been shown to have a conductivity change of 8 orders of magnitude (∼10−16–10−8 S cm−1) in a hydration range of 10% RH to 75% RH,22 with the changes probably being driven by proton mobility changes as shown by percolation behaviour.22–24
Another material of interest in making bioelectronic devices is the polymer reflectin, a cephalopod structural protein that has been used in proton conducting transistors.25,26 Reports show that there is a change in the current of thin films from dry to wet (90% RH) of ∼4 orders of magnitude, with the conductivity in the wet state being 1.0(±0.5) × 10−4 S cm−1.
Another pigment that is of interest to bioelectronics is melanin,6 better known as the human skin pigment. Melanin has a long history of being studied in various geometries, methods and morphologies using different hydration setups. Reported conductivities range ∼10−13 S cm−1 to 10−3 S cm−1 from dry to 100% RH, though these ranges can vary between 3 to 10 orders depending on the approach and morphology.21,27–32
Bovine serum albumin (BSA) is another material of interest. Recent work by Agam et al. has found that with the right fabrication process, BSA can have its conductivity change 4 orders of magnitude in a range of 60–90% RH,33 with the conductivity at 90% being ∼0.1 mS cm−1.
One of the original works on the hydration dependence of biomaterials was done by Murphy on cellulose, where, over a hydration range of 0–100% RH, the conductivity changed from 10−15 S cm−1 to ∼10−4 S cm−1 depending on the electrolyte content.34
A phospholipid such as egg lecithin also demonstrated current changes of ∼4 order of magnitude over a water content of ∼5% to 35%, with resultant conductivities being similar to haemoglobin.17
Cytochrome C and its hydration dependent current have also been documented, showing a change of 8 orders of magnitude change from 0 – 40% water content, yielding conductivity values an order of magnitude greater than for haemoglobin when full hydrated.21
Another important class of biomaterials are conductive hydrogels. An example of a biocompatible (though synthetic) conductive hydrogel is based upon (poly(3,4-ethylenedioxythiophene) polystyrene sulfonate (PEDOT:PSS)).35 Lu et al. showed that the conductivity for the dry state was ∼500 S cm−1 and when turned into the hydrogel state became <50 S cm−1, an order of magnitude decrease.35 However, it is not clear what the corresponding relative humidity state was and the aim of the study was more on demonstrating that the material was a conductive hydrogel, so no mechanistic insights were explored. However, it does highlight the key thrust of this article, that water content of a biomaterial/biocompatible systems can have large effects on the conductivity, even though other effects were being explored.
The representative above examples should convince the reader that the charge transport properties of conductive biomaterials and biocompatible systems can substantially change by changing their water content. Indeed, the effects can be so large that it can rival temperature as an environmental variable. In essence, water content should be considered a 1st order environmental variable for the experimentalist to control.
Hydration control and mechanistic insights
As has been demonstrated, a bio-material's water content (derived from the environment) can have a large impact on its conductivity. However, using and controlling hydration as a variable can be key in understanding the underlying conduction mechanism. As hydration control is not common at all, comprehensive hydration control studies on select materials are few. Therefore, we will limit ourselves in this section to two case studies to demonstrate the usefulness of hydration control. The two cases will cover an electronic conductor (crystalline haemoglobin), and an ionic conductor (melanin) to show that water content control can be applied to either kind of conducting bio-materials system.Haemoglobin – electronic conductor
Haemoglobin was a material system investigated quite widely in the 1960's, but particularly in-depth by Rosenberg and co-workers. The context for the work is fascinating, since it built upon the original ideas by Evans and Gergely36 that proteins can have a systematic structure, enabling a system to become semiconducting as per the band theory of conductive systems.10 However, even though temperature dependence of some proteins showed semiconductive behaviour and photoconductivity was observed, it could not be determined whether proteins (e.g. haemoglobin) were electronic or ionic.37 This was especially a problem in light of observed hydration dependent conductivity, which could mean proton/ionic conductivity or a modification of electronic states.37 Rosenberg utilised the hydration dependent conductivity to his advantage to answer the question of the potential charge carrier. His experiment utilised ionically blocking contacts to measure the current as a function of time at a fixed voltage.37 Using the hydration dependent conductivity, he then derived a theoretical curve for the current in time for if the current was purely ionic, and compared it to the theoretical case if the current was purely electronic (Fig. 1). The reasoning went that if the current was purely ionic, one would electrochemically split water and evolve hydrogen and oxygen, leading to a loss of water and therefore, overall current. In contrast, if purely electronic the current should not change. The experimental results in Fig. 1 clearly show that the sample was electronic in nature.37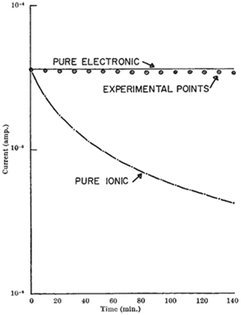 | ||
| Fig. 1 The time dependence of the current through wetted (7.5% by weight) crystalline haemoglobin. The solid lines are the theoretical curves for pure ionic and pure electronic currents (labelled). Circles indicate measured data points. Reprinted by permission from Springer Nature Customer Service Central GmbH: Nature, Nature, 193, 364–365, “Electrical Conductivity of Proteins”, B. Rosenberg, COPYRIGHT (1962).37 | ||
Once Rosenberg established the nature of the charge carrier in the wet state, the question was how to explain the hydration dependent conductivity. In the dry state, the temperature dependent activation energy was determined be 2.3 eV using the conductivity equation:16
| σ(T) = σ0exp(−E/2kT) | (1) |
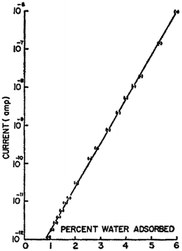 | ||
| Fig. 2 Conductivity/current of crystalline bovine haemoglobin as a function of water content at room temperature. Reprinted from B. Rosenberg, J. Chem. Phys., 1962, 36, 816–823, with the permission of AIP Publishing.16 | ||
Further investigation demonstrated that the pre-exponential factor σ0 was hydration independent. Instead, consistent with the exponential behaviour of the hydration dependent conductivity, it was the activation energy itself that was changing with hydration (e.g.Fig. 3)16,17 and could be described by:
| Ew = ED − γm | (2) |
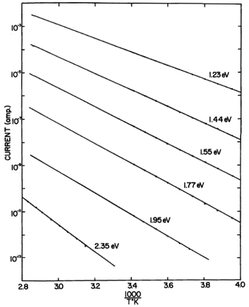 | ||
| Fig. 3 Current vs. 1/T plots for crystalline haemoglobin for variously hydrated samples. Dry sample is the bottom curve. Copyright (1969) Wiley. Used with permission from B. Rosenberg and E. Postow, Ann. N. Y. Acad. Sci., 1969, 158, 161–190.17 © 1969 John Wiley & Sons, Inc. | ||
In essence, the water dependent studies showed that the charge concentration was being modified by the water affecting the energy level of the band gap. Rosenberg developed a model to describe the underlying mechanism utilising also other literature data, which involved work employing various solvents and also an observation of a saturation effect on the conductivity at high water contents. The model constructed is encapsulated by the following equation:
 | (3) |
A note of caution is required. Even though there were temperature dependent studies and care was taken to keep water loss to a minimum as the sample is heated, water loss still occurred. This implies a skewed result and highlights a problem: one cannot heat biomaterial samples too much and expect to maintain the same amount of water content. Instead, cooling a sample may be a better option, since liquid water may remain within a sample even below freezing point. This can be verified using heat capacity measurements as Motovilov et al. did on comparison with dry and hydrated melanins.40 Furthermore, it should be noted that in order to properly distinguish between an exponential and a power law, one needs data with three orders of magnitude range.41 Rosenberg did not achieve this and hence there should be some caution given to the interpretations as well as highlight an experimental challenge for the prospective researcher.
In conclusion the above example should have highlighted to the reader that hydration dependent work can be a powerful approach in elucidating the underlying charge transport mechanism of a material, even if the material is an electronic charge carrier.
Melanin – mixed ionic/electronic conductor
The melanins are a class of pigments, of diverse structure and origin derived by the oxidation and polymerization of tyrosine in animals or phenolic compounds in lower organisms.42 The most well-known of these compounds and the one being discussed is called eumelanin, which is usually associated with the term melanin. It is an insoluble black-brown pigment, derived at least in part from the oxidative polymerization of L-dopa via 5,6-dihydroxyindole intermediates.42 For a materials scientist, the physical and chemical properties of melanin are unique to the material and drives continued interest for material and device applications.43 These include a featureless, decaying exponential UV-visible absorbance spectrum (Fig. 4);39 a peaked fluorescence spectra dependent on energy of excitation and quantum yield <0.1%;44 a stable free radical signal that can be detected by electron paramagnetic resonance (EPR);29,45–52 it is hygroscopic with a water capacity of up to 20% in its own weight;21,46,53–55 temperature and hydration dependent conductivity;21,27–32,40,46,56–59 electrical switching behaviour (Fig. 5);60–63 photo conductivity with an associated negative baseline current after illumination;28,64,65 supercapacitor capabilities;66 metal ion chelation of transition metal ions in large quantities31,67–69 and electrochemical activity.70–73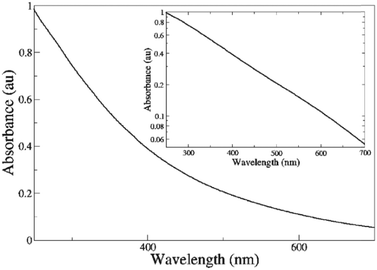 | ||
| Fig. 4 A UV-Vis spectrum of melanin. Inset shows a log linear plot of the data, indicating the exponential nature of the spectrum. Reproduced from ref. 39 with permission from the Royal Society of Chemistry.39 | ||
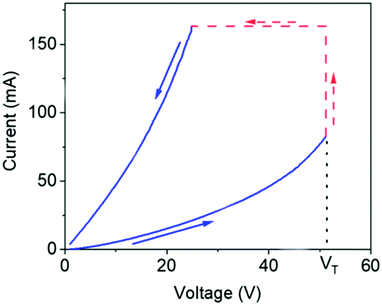 | ||
| Fig. 5 Electrical switching behaviour of melanin. As the voltage is increased, the current increases until a threshold voltage (VT) is reached, after which the material is in a lower resistive regime, leading to higher current. Reprinted with permission from M. A. Reali et al. ACS Appl. Bio Mater., 2020, 3, 5244–5252. Copyright 2020 American Chemical Society.63 | ||
Since the 1970's many of these properties have been used to model melanin's charge transport to an amorphous semiconductor model, first introduced by McGinnes et al. (see Fig. 6).60,61,70 For example, melanin's broad band optical absorbance profile was believed to indicate a tail of localized states in an amorphous semiconductor band gap.74 The presence and behaviour of the aforementioned free radical signal suggested a large density of localised electronic states at the Fermi level.62 The temperature dependent behaviour of the conductivity was that of a semiconductor27,40,56–58,75,76 and the drop in current after a photocurrent measurement indicated potential trapped (localised) states in the band gap.28,64 Finally and critically, the ability of melanin to demonstrate bi-stable switching behaviour (i.e. charge carrier promotion to the mobility edge) after an application of a high enough voltage all contributed to the popularity of the amorphous semiconductor model.60–63
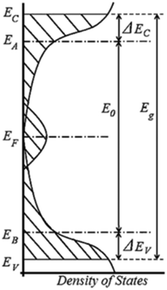 | ||
| Fig. 6 The density of states for an amorphous semiconductor, which was used to model melanin charge transport. There are several energy levels defined as: EV (EC) the valence (conduction) mobility edge, EB (EA) is the valence (conduction) level, EF is the Fermi energy, E0 is the optical gap, ΔEV (EC) is the energy gap between the valence (conduction) level and mobility edges, and Eg is the mobility gap. Meredith et al. “Electronic and optoelectronic materials and devices inspired by nature”, Rep. Prog. Phys., 76, 034501, 14 February 2013; https://doi.org/10.1088/0034-4885/76/3/034501; © IOP Publishing. Reproduced with permission. All rights reserved.10 | ||
However, a confounding observation was the aforementioned hydration dependent conductivity (e.g.Fig. 7a). Indeed, the switching behaviour of melanin could not be induced in the dry state,28 though recent work has reopened the possibility that it may (Fig. 5).63 The need for hydration in obtaining switching behaviour originally led to a model where water is required to increase the dielectric constant of the material (i.e.eqn (3)). This would narrow the energy gap between the semiconductor valence and conduction mobility edges.28,29,60
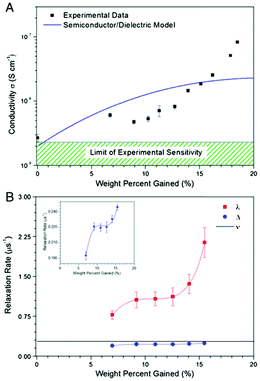 | ||
| Fig. 7 (A) Conductivity of melanin as a function of water content. The line shows the best fit to the modified dielectric theory as per McGinnes et al. (eqn (3)). (B) Paramagnetic and diamagnetic μSR relaxation rates for melanin as a function of water content. The muon hopping rate, ν, was found to be constant. However, the μSR relaxation rates had the same behaviour as the conductivity. These results shows that proton mobility does not change in the same way as conductivity, but carrier concentration does. A. B. Mostert et al. Proc. Natl. Acad. Sci. U. S. A., 2012, 109, 8943–8947.29 | ||
It is at this point where it became clear to Mostert et al. that the amorphous semiconductor model for melanin can be tested,28,29 not by the usual temperature dependent studies, but by controlling the water content. They found that McGinness et al.'s model could not explain the hydration dependent conductivity (Fig. 7a).28,29
Furthermore, hydration controlled photoconductivity experiments of melanin also showed that the apparent negative conductivity after light exposure had a hydration dependence.28 This suggested that water evaporation was a driving factor, rather than the original explanation of trapped electronic states. Additional hydration controlled work utilising muon spin resonance (μSR) exhibited a strong correlation between magnetic resonance relaxation parameters and the hydration dependent conductivity (Fig. 7b).29 As such, Mostert et al. proposed an alternative charge transport mechanism, in which the conductivity is regulated by a redox reaction (Fig. 8), where the addition of water generates new charges, both radicals and protons.29
 | ||
| Fig. 8 The proposed redox reaction within melanin. A comproportionation reaction in which catechols and quinones react with water to produce protons and negatively charged radicals for charge transport. A. B. Mostert et al. Proc. Natl. Acad. Sci. U. S. A., 2012, 109, 8943–8947.29 | ||
If the reaction in Fig. 8 is the origin of the conductivity changes in melanin, then the use of D2O should lead to an increase in charge concentration and thus increased conductivity relative to H2O. This was confirmed by Rienecker et al. and will be discussed a little more later on.46
More work was done by Motovilov et al. who did a temperature dependent study on the melanins, but with variously hydrated samples.40 Water content of the samples was kept constant by insulating them appropriately for dielectric spectroscopy experiments and cooling the samples instead of heating. These authors identified key features in the spectra that followed a temperature activated energy for the conductivity of ∼0.5 eV, which is close to the expected value predicted for the reaction in Fig. 8.73
In addition, recent hydration dependent, mid infrared spectroscopy work by Bedran et al.77 demonstrated the evolution of the semiquinone as a function of hydration as suggested by the Fig. 8. Though this latter work suggested that the carboxylic acids within melanin may also be a contributor to charge transport and opened an additional research pathway to explore. In relation to the charge transport, the free radical signal has also been investigated, since it may be a marker for the charge transport mechanism. The signal though, is much more complex than that of a single radical.45–47,49,78,79 But with the appropriate methodology the relevant radical signal can be isolated and it can be shown that the photo generation of the radical correlates with the photoconductivity as a function of hydration,47 demonstrating the comproportionation reaction model of Fig. 8.
Finally, the “proof of the pudding” so to speak was in an application of melanin. Melanin was incorporated into an organic electrochemical transistor (OECT) as an active (Fig. 16), solid state ionomer by Sheliakina et al.80 The key to such functioning devices is the presence of ions to enable the change of state of the device. They managed to show that these melanin based OECT devices do not function when dry, but become properly function devices once the melanin is wetted, i.e. when protons are generated.80
Another specific prediction that has been made is that the reaction model implies modification via metal ion binding. By binding metal ions to the indole quinone, the overall reaction can be further perturbed to generate even more protons for conductivity. This was explored by Mostert et al. and they found that binding with Cu2+ leads to greater conductivity changes and associated OECTs outperformed non-metal doped OECT devices, confirming again the model of Fig. 8.31
At this point there are questions about what the relative contributions are between protons and electronic charges, with some suggesting that melanin is a proton dominant system e.g. (ref. 30) and others ascribing a greater role for electrons (e.g. ref. 63).
Overall, the case of melanin shows that even though many properties fit one charge transport model (an amorphous semiconductor view), by testing and controlling the hydration content of the material, an alternative model was developed that has even greater explanatory power.
The two cases of haemoglobin and melanin should be indicative of what can potentially be achieved and understood in the area of conductive biomaterials and their cognates when utilising water content as a controlling parameter.
Mechanistic insight, H2O vs. D2O
Coupled with the use of hydration dependent studies, one can utilise kinetic isotope effect studies contrasting between H2O and D2O to gain further insight into the charge conduction mechanism. One reason this is so useful, especially for direct current (DC) measurements, is that both H2O and D2O have similar static dielectric constants.One example in which the contrast approach was used was by Behi et al. who investigated lysozyme powders.22 These authors first determined the adsorption isotherm curves of their samples as a function of D2O and H2O. In other words, they quantified the amount of water in the sample, heavy or light, as a function of the relative pressure. This allowed them to then do a hydration dependent DC conductivity curve as a function of actual water content, not just relative pressure (Fig. 9). Their results suggested that proton conductivity via changes in its mobility with hydration was the main cause for the changes in the conductivity. Additional support came from the fact that for the same number of water molecules, the conductivity under D2O hydration was consistently lower than for the H2O hydrated sample, even accounting for differences in solvation of any labile protons.
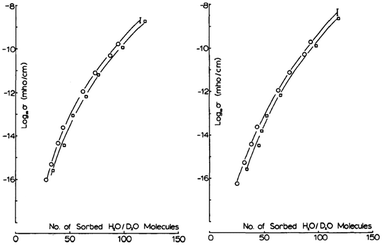 | ||
| Fig. 9 (Left) Conductivity at 293 K for lysozyme, soaked in H2O before and (Right) soaked in D2O. Open Circles are for H2O hydration data and open squares for D2O data. Used with permission from J. Behi et al. Int. J. Quantum Chem., 1982, 22, 367–374. © 1982 John Wiley & Sons, Inc.22 | ||
Ordinario et al. characterised reflectin films using impedance spectroscopy.25 They hydrated their films using H2O and D2O and got a significantly different result, as shown in their Nyquist plots, Fig. 10. Essentially, their complex semicircle expanded and their diffusion tail (low frequency/high resistance straight line data) extended, indicating increased resistance, or a decrease in the conductivity of about 40%. These observations, coupled with a lack of redox active peaks over a wide range of voltages and the use of hydrogenated palladium contacts, which insured transparency to protons, suggested that the material is dominated by proton conductivity.25
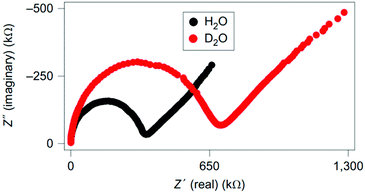 | ||
| Fig. 10 Nyquist plots for reflectin films hydrated with H2O vs. D2O (labelled). Reprinted by permission from Springer Nature Customer Service Central GmbH: Nature, Nat. Chem., 6, 596–602, “Bulk protonic conductivity in a cephalopod structural protein”, D. Ordinario et al. Copyright (2014).25 | ||
D2O vs. H2O work will not always yield a result indicating potential changes due to mobility of protons. The vapours instead can be used to determine changes in solid state equilibrium chemistry. This was the approach of Rienecker et al. who investigated melanin as mentioned previously.46 Like Behi et al. they obtained adsorption isotherms in order to normalise their conductivity data, which they then subsequently measured (Fig. 11). As part of the working model that Mostert et al. initially proposed for melanin's conductivity (i.e.Fig. 8), Rienecker et al. predicted that the apparent upturn in the conductivity should shift with lower water content due to preferential solvation of the deuterium. As such, the change in the conductivity from the upturn point should lead to larger changes for the conductivity for when a sample is exposed to D2O vis-à-vis a sample exposed to H2O. As can be seen in Fig. 11, this is precisely what happened, with a decrease in the upturn point being half that for the D2O vs. H2O data sets. Essentially, the D2O was used to artificially force a change in the redox equilibrium and produce more conductive charges for conductivity.
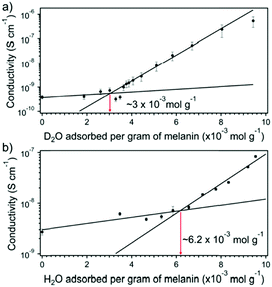 | ||
| Fig. 11 (A) Conductivity of melanin with D2O content. (B) Conductivity of melanin with H2O content. Red arrows (with values) indicate the upturn in the conductivity at a critical amount of water content. Reprinted with permission from S. B. Rienecker et al. J. Phys. Chem. B, 2015, 119, 14994–15000. Copyright 2015 American Chemical Society.46 | ||
However, if a researcher wants to engage in kinetic isotope contrast studies, there are a couple of issues to keep in mind. The first is that the saturation vapour pressures for D2O and H2O are different: for example, at room temperature, they differ by ∼20%.46,55 As such their relative pressures, or relative humidities are different for the same pressure values. In turn, it leads to their corresponding adsorption isotherms being different. Hence, there is a serious consideration as to the appropriate normalisation/comparison axis between the two vapours. In other words, whether one should use the relative humidities (i.e. activities) or the water content of the sample as the independent axis. This will depend on the exact question asked. Further guidance will be given below.
Another issue to consider is that the kinetic isotope effect can be quite subtle. To fully exploit it, a large amount of material is required. This is exemplified in comparing two different studies, the Ordinario et al. work on reflectin and Sheliakina et al.'s alternating current (AC) study on melanin thin films. Ordinario et al. clearly saw a difference using D2O vis-à-vis H2O (Fig. 10)25 as where Sheliakina et al. did not.30 This latter discrepancy is most likely due to the small amount of material Sheliakina et al. employed.30 As such, care should be given to the choosing of the sample size to successfully execute a contrast experiment.
Examples of devices and the role of water
The conductive properties of biomaterials have device implications, and water content can be used to enhance the performance of a device. In this section, a selection of various devices is given to show the power of water content control in device studies.The first study to be inspected is on a nanowire/polymer transistor system reported by the Micolich group (Fig. 12). Both p-type (GaAs) and n-type (InAs) nanowire transistor systems were fabricated, such that the top gate was coated with polyethylene oxide (PEO), a biocompatible polymer, which acted as a solid state gate.81 The Micolich group decided to investigate devices that had both LiCl doping and no doping. What these authors noted was that the device performance of their transistors could be enhanced by changing the hydration state of the PEO (Fig. 13), e.g. the transfer characteristic hysteresis could be reduced with hydration, particularly for the n-type devices. Significantly, due to their hydration dependent work, they demonstrated that there was no significant difference in behaviour between LiCl doped PEO systems and the undoped system. This eliminated Li+ ion migration as a major contributor to device performance.
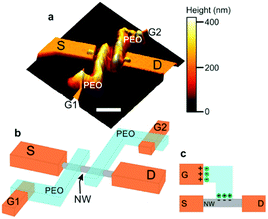 | ||
| Fig. 12 Device architecture for the nanowire/PEO transistors of Carrad et al. where (a) is an AFM image, (b) a schematic of the double gated device and (c) a demonstration of the offset gate architecture and how ion migration enables the gate voltage be transmitted. Essentially, ions move to the opposite polarity terminal, where an electric double layer forms to drop the voltage. Reprinted with permission from D. J. Carrad et al. Nano Lett., 2017, 17, 827–833. Copyright 2017 American Chemical Society.81 | ||
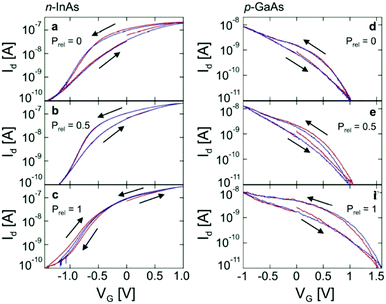 | ||
| Fig. 13 The transfer characteristics for transistors based upon semiconductor nanowires and a PEO top gate (wire type indicated). Prel indicates the relative water vapour pressure (i.e. relative humidity). Reprinted with permission from D. J. Carrad et al. Nano Lett., 2017, 17, 827–833. Copyright 2017 American Chemical Society.81 | ||
As a final insight, the conductivity values for the PEO polymer top gate were determined (Fig. 14). The data indicates that between LiCl doped and undoped systems, the conductivities were very similar. Indeed, another significant finding was that the hydration dependent PEO results had a conductivity orders of magnitude higher than previously reported measurements on undoped PEO. Their data indicated that the most likely result is due to the high surface volume ratio of the polymer, enabling it to fully utilise its proton conductivity. This aspect of exposed surface area will be returned to later.
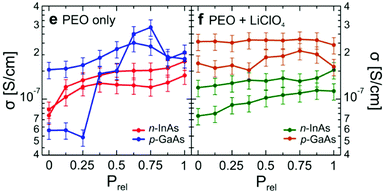 | ||
| Fig. 14 Conductivity of the PEO top gate as a function of relative pressure (relative humidity) using the nanowire transistors in Fig. 12 and 13. Doping with/without LiCl is indicated. D. J. Carrad et al. Nano Lett., 2017, 17, 827–833. Copyright 2017 American Chemical Society.81 | ||
The Micolich group followed up their PEO nanowire transistor work by investigating an alternative polymer for the topgate: Nafion.82 However, they devised a new method of fabrication in which the Nafion was used as a negative electron beam resist that could be pinned to the surface of the nanowires. Again, the authors used hydration control to investigate the devices. They found that, for the transistor transfer characteristics, for both n-and p-type transistors, the hydration dependence was even more pronounced compared to previous PEO based devices (Fig. 15 for n-type example). Optimal behaviour occurred at 100% RH, with maximum on/off ratios and minimal hysteresis.
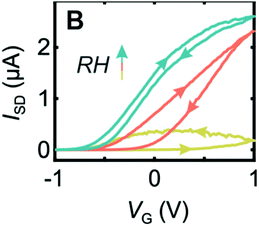 | ||
| Fig. 15 Transfer characteristic for an n-type transistor based upon InAs nanowire and electron beamed Nafion top gate. Yellow curve is for 50% RH, orange 70% RH and blue is 90% RH. Reproduced from ref. 82 with permission from the Royal Society of Chemistry.82 | ||
Discussing a different system, as stated previously, Sheliakina et al. reported the first ever solid state organic electrochemical transistor (OECT) based upon a biomaterial, specifically melanin (Fig. 16).80 These authors did a systematic hydration dependent study of their devices to demonstrate the underlying mechanism. The important concept to understand is that an OECT only acts as a transistor if mobile cations are available to move into the conductive channel (PEDOT:PSS) to dedope it via a redox reaction. What Sheliakina et al. demonstrated was that when their solid state OECT was dry, no transistor action was possible (i.e. no transfer characteristic with just a straight line, Fig. 17a). However, as the device was systematically wetted, the devise started to act like a transistor, with definite on/off regions, with the wettest version of the device showing the largest on/off ratios and greatest sensitivity (i.e. highest transconductance, Fig. 17b). These measurements demonstrated that the melanin top gate was producing mobile protons for conduction upon being wetted.
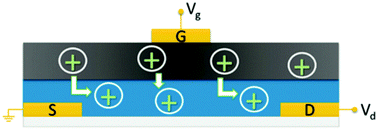 | ||
| Fig. 16 Schematic of the solid state OECT of Sheliakina et al. in which blue corresponds to the conductive polymer channel (poly(3,4-ethylenedioxythiophene) polystyrene sulfonate (PEDOT:PSS)), dark grey to the melanin top gate and S, D and G are the metal source, drain and gate electrodes respectively. Proton injection from the melanin top gate (under positive bias) de-dopes the PEDOT:PSS channel reducing the source–drain current and leading to transistor action. Reproduced from ref. 80 with permission from the Royal Society of Chemistry.80 | ||
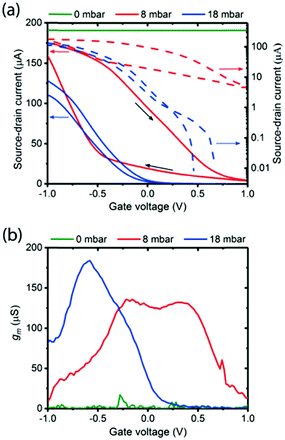 | ||
| Fig. 17 (a) Hydration dependent transfer characteristics of a melanin-based OECT at 0 mbar water vapour pressure (green line), 8 mbar (red line) and 18 mbar (blue line). On/off ratio is approximately 220 at 8 mbar and approximately 104 at 18 mbar pressure. The corresponding transconductances (i.e. derivative of the transfer curve). Reproduced from ref. 80 with permission from the Royal Society of Chemistry.80 | ||
Other authors investigating bioelectronic OECTs have also recognised the importance of hydration in OECT devices, such as Savva et al. These authors found that for the liquid based OECTs, water actually had a detrimental effect on performance, with reduced transconductances and switching speeds.83 Essentially, the water uptake interferes with the dynamics of proton mobility within the conductive polymer channel.
Methodology
If at this point the reader has been convinced that control of the water content of a conductive biomaterial is key, the purpose of this perspective has been achieved. However, it may be that the prospective researcher is not aware of the relevant methodologies for hydration. As such, this section is devoted to giving a brief introduction on key approaches.Hydrating methods
There are various approaches to controlling a humidified atmosphere, each with their own benefits and handicaps. The first way to control a humidified atmosphere is via the use of saturated salt solutions. In this approach a salt is dissolved in water with excess salt still left over. This solution placed within an enclosed environment will lead to a relative humidity dependent on the salt used (see for example the following references).25,40,54,77 This approach is both conceptually and experimentally easy to execute. It has the advantage of placing the sample within a thermodynamically well-defined system. The equipment needed is minimal and the process is straightforward. Additional advantages are that a sample mounted within such an enclosure will be at ambient conditions (e.g. accounting for O2). Furthermore, a sample can be hydrated within such an enclosure, but then transferred to another system in which a temperature dependent experiment can be performed (see example references).40,54 Finally, another advantage is that this approach may be more amenable to delicate samples. From personal experience, when utilising pressed powder samples for conductivity measurements, they were easier to handle within such a setup when compared to a vacuum system (see below). Pressed powder samples tended to crack upon the application of vacuum as well as lead to additional electrical decontacting upon hydration within a vacuum system.However, there are drawbacks to using saturation salt solutions. For example, salt can be deposited onto a sample, which can affect electrical measurements. An enclosed area is needed. Normally this is straightforward, e.g. using a large beaker, but if one needs to handle the sample within such an atmosphere, a glovebox would be more useful, which can be a significant hurdle. This approach can be expensive in consumables, since if one wishes to map out the behaviour across the entire humidity range, numerous salts would be needed to do so. Naturally, some of the more exotic salts can be quite expensive. This leads to an additional consideration, which is some of these salt solutions can be poisonous and hence disposal and handling will have to be carefully investigated. Finally, the last drawback is that one cannot with certainty perform a proper contrast or comparison experiment, i.e. H2O vs. D2O, since the relative humidities generated by salts do not necessarily lead to the same values for the two water systems, and data on D2O relative humidities are difficult to obtain. Though, this has not stopped some researchers from using such an approach to get a rough qualitative insight to the system under investigation.25 With all the above considerations, if a researcher is considering whether or not hydration is a key parameter, the saturated salt solution approach may indeed be the quickest and cheapest option to explore the effects of water before any major long term investments are made on other hydrating systems.
An alternative hydrated system that is quite widely used is a sparging system (see example references).18,59 The essential setup of the sparging system is that one has a stream of a carrier gas (e.g. air, nitrogen, argon) being bubbled through a solvent (i.e. water), where this hydrated carrier gas is then sent into an enclosure where the sample is held. An internal hygrometer in the enclosure then measures the local relative humidity. This popular approach has multiple advantages. The first is that once in place, the running costs are much reduced, essentially limited to having a cylinder of the carrier gas on hand, or in-house gas supply. Furthermore, the running of the equipment tends to be quite straightforward, especially if automated. The samples being investigated with this kind of system are also tested at ambient conditions, though there can be more flexibility in that, instead of an air stream being used, a nitrogen stream (or another carrier gas) can be used to exclude the effects of O2 interference. Finally, a sparging system is quite amenable to a D2O vs. H2O contrast study, but then care needs to be taken that the hygrometer employed is compatible and calibrated to D2O.
However, the drawbacks to such a system are significant. The first is that the flowing gas is leaving an experiment at a kinetic equilibrium and not necessarily a true thermodynamic equilibrium. It requires capital investment, since glassware, vacuum parts and measuring kit will be needed. Furthermore, this will also require significant risk assessment attention due to the potential of over pressure from the gas source. Another issue is that such a system tends to be inflexible, in that, once constructed, it is localised to a particular laboratory, limiting the scope of the potential hydration dependent experiments that can be done. Finally, this system cannot be used to test the effect of temperature on a sample while keeping the hydration content stable. Cooling off the air will condense moisture onto the sample and heating the sample locally would put it into a thermodynamic state not commensurate with the overall relative humidity.
A third way to achieve hydration of an atmosphere is to use a vacuum system. The idea is to have a sample holder or chamber connected to a vacuum line (see example references).28–32,45–48,53,80 The vacuum line itself is connected to a vacuum pump, a vacuum gauge that is capable of reading pressure of a gas such as water, and a vial of water that has been purged. Hydration is achieved by pumping out the atmosphere, isolating the vacuum pump from the line and then letting in water vapour to a desired pressure as indicated by the gauge. The first major advantage is, like the salt solution approach, one is able to define the thermodynamic state of the system very well. Furthermore, it gives precise control, since one is dialling in the actual pressure values of the water vapour. The relative humidity can then either be easily determined by noting the temperature and calculating the associated saturation pressure or by measuring the saturation vapour pressure directly. As a consequence, H2O vs. D2O studies are easy to execute since one is not relying on a hygrometer that can introduce systematic errors, but by measuring the pressure directly. Once assembled, the system is cheap to run and there are no associated risks for over pressure. Given the nature of the system, contamination from the environment is of far less concern than for the other methods. Furthermore, this method has the great advantage of flexibility: able to be adapted to any piece of kit as long as the sample holder is appropriate for the experiment. Indeed, from personal experience this basic system has been adapted to at least 7 different experimental systems internationally (neutron, magnetic resonance, electrical etc.) as long as a vacuum pump is available and the sample holder is appropriately designed. This allows for a multidisciplinary approach to investigation.
However, this approach does have drawbacks. Like the sparging system, there is an upfront capital cost, but given the flexibility, one will be able to get more out of it. Furthermore, given that it is a vacuum setup, potential pressure effects and potential effects due to O2 cannot be readily investigated. And finally, like the sparging system, one cannot perform temperature dependent studies for the same reasons.
Adsorption isotherms
A question to ask is what the appropriate normalisation axis should be for investigating the hydration dependent electrical behaviour of a sample. An overwhelming number of studies tend to use relative humidity as a proxy for indicating the level of hydration for a sample. However, such an approach should ideally only be used as an initial foray into investigating a new material. One other exception is whether it would be more conducive to discuss a particular material mechanism in terms of activity, i.e. relative humidity. The reason for this author's reluctance in using relative humidity is that, generally speaking, the water content of a material is rarely linearly proportional to the surrounding relative humidity. As an example, Fig. 18 shows adsorption isotherms for melanin exposed to both D2O and H2O vapour. As can be seen, at low relative pressures (i.e. low relative humidities), there is a large increase in the water content of a melanin sample. The increase in water content then levels off, but still increases with relative humidity. Fig. 18 also shows another key feature, which is that, if one wishes to perform kinetic isotope studies using D2O vs. H2O, one cannot assume that both vapours will have the same adsorption isotherm for a given material. Indeed, for melanin specifically, the important changes in the conductivity as a function of D2O (Fig. 11) occur within the steep climb of the 0–10% relative humidity range of the adsorption isotherm in Fig. 18, a change that is significant vs. the H2O isotherm. As such, it is of great importance to normalise hydration dependent data appropriately.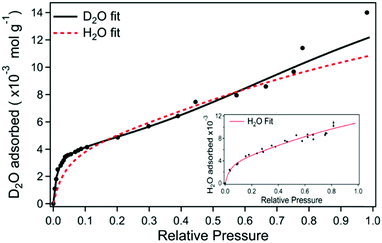 | ||
| Fig. 18 Heavy water adsorption isotherm for melanin where the solid black line is the fit to the data. The red dashed line is the equivalent fit for the H2O isotherm (corresponding H2O data depicted in the inset). S. B. Rienecker et al. J. Phys. Chem. B, 2015, 119, 14994–15000. Copyright 2015 American Chemical Society.46 | ||
The method of normalisation is to use the aforementioned adsorption isotherms. The basic approach would be to measure the isotherm. Then, when electrical measurements are measured within a system that measures the pressure or relative humidity, the isotherm can then be employed to convert to water content.
Obtaining an adsorption isotherm can be done in several ways. There are gravimetric methods (e.g. ref. 21, 31, 33, 41, 46 and 53) neutron reflectometry methods (e.g. ref. 55) and using quartz crystal microbalances. However, with the last approach, one has to be careful of potential visco-elastic effects voiding the Sauerby assumption when analysing results. Each approach has its strengths and weaknesses, but the most robust and easiest, from experience, would be a gravimetric approach. A question to ask is how hydration can be achieved. As for hydrating methods, one can employ the methods discussed previously. The key question in obtaining a good adsorption isotherm though, is ensuring that one can obtain a sample that is dry, to which the rest of the isotherm data can be compared. Given that many of these materials are hydrophilic, drying them may require heat (making thermogravimetric analysis an option), or long periods of drying under vacuum or both.
Equilibrium
As was mentioned in a previous discussion on devices, specifically Carrad et al.'s PEO/nanowire devices, contact geometry is of great importance to ensure that the water content of a sample is in equilibrium with the environment. In the case of Carrad et al., an open geometry allowed water to fully penetrate the polymer, which resulted in an enhanced conductivity compared to previously reported works.81A similar observation was made by Mostert et al. who used an open contact geometry to fully map out melanin's hydration dependent conductivity (Fig. 19).28 Indeed, they compared a standard “sandwich” or more closed contact geometry to a more open one and found that the results can be very different, which can mislead researchers.
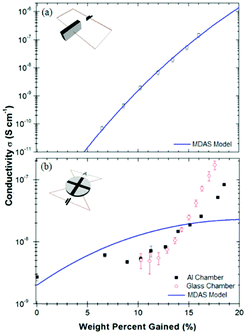 | ||
| Fig. 19 Hydration dependent conductivity of melanin, utilising (a) a “sandwich” geometry and (b) an open geometry. For (b), note that the bottom of the sample is open to the environment. As can be seen, increasing the surface area of the sample leads to a qualitative different result, which had a large impact on the interpretation of the underlying mechanism. Solid lines are lines of best fit to eqn (3). Essentially, if the wrong geometry is employed, one may mistake the underlying mechanism via a faulty theoretical fit. Reprinted from A. B. Mostert et al. Appl. Phys. Lett., 2012, 100, 093701, with the permission of AIP Publishing.28 | ||
Another example of ensuring equilibrium with the environment, was the aforementioned work by Sheliakina et al. on the melanin based OECTS. In order to obtain the hydration dependent data, they developed a temporary liquid metal contact for the top gate utilising a eutectic alloy of Gallium and Indium.84 This allowed them to decontact the solid state polymer from the liquid metal and expose the polymer to the environment, and then recontacted the polymer once equilibrium had been achieved.
However, this above approach of using liquid metal contacts does not always impart a good contact with the device or polymer, and may in fact not always be necessary. Sheliankina et al. elsewhere did a hydration dependent AC study on thin films of melanin, where one of the experiments they conducted was to compare a full sandwich contacted sample with a temporary liquid metal contact. They found that the hydration dependent results were very similar between the two approaches, but with better definition of the data from the standard contacting method.30 As such, it is recommended that different materials and morphologies should be investigated individually to ensure clear results.
Conclusions
Biocompatible-, bioinspired- and biomaterials and their associated devices are emerging as important systems for research to help address societal challenges of ubiquitous devices, waste and medical applications. Understanding and exploiting these systems requires careful scientific investigation. This perspective discussed the fact that these particular systems’ electrical behaviour is sensitive to water content (as derived from the environment), where the conductivity can change by orders of magnitude. Discussed further were numerous methods of investigation using hydration control, their utility and their importance for understanding charge transport.Overall, hydration control is paramount in conductive biocompatible-, bioinspired- and biomaterials and should be considered a 1st order environmental effect alongside temperature.
Author contributions
Manuscript written by A. B. Mostert.Conflicts of interest
There are no conflicts to declare.Acknowledgements
Results incorporated in this work are supported by the Welsh Government through the European Union's Horizon 2020 research and innovation program under the Marie Skłodowska-Curie grant agreement No 663830.Notes and references
-
National Academy of Engineering and Steve Olson, Grand Challenges for Engineering: Imperatives, Prospects, and Priorities, National Academy of Engineering of the United States, National Academies Press, Washington, 2016, DOI:10.17226/23440
.
-
Strategic Prospectus: Building the UKRI Strategy, UK Research and Innovation, United Kingdom, 2018 Search PubMed
.
-
G. Ling and C. E. Lathan, Electrocueticals, Scientific American Magazine, Scientific American, 2018 Search PubMed
.
- K. Famm, B. Litt, K. J. Tracey, E. S. Boyden and M. Slaoui, Nature, 2013, 496, 159–161 CrossRef CAS PubMed
.
- J. Rivnay, R. M. Owens and G. G. Malliaras, Chem. Mater., 2014, 26, 679–685 CrossRef CAS
.
- N. Amdursky, E. D. Glowacki and P. Meredith, Adv. Mater., 2019, 31, 1802221 CrossRef PubMed
.
- D. Puccinelli and M. Haenggi, IEEE Circuits Systems Magazine, 2005, 5, 19–31 Search PubMed
.
- C. Baldé, V. Forti, V. Gray, R. Kuehr and P. Stegmann, The Global E-waste Monitor 2017: Quantities, Flows, and Resources, 2017.
- M. Irimia-Vladu, Chem. Soc. Rev., 2014, 43, 588–610 RSC
.
- P. Meredith, C. J. Bettinger, M. Irimia-Vladu, A. B. Mostert and P. E. Schwenn, Rep. Prog. Phys., 2013, 76, 034501 CrossRef CAS
.
- Y. Sone, P. Ekdunge and D. Simonsson, J. Electrochem. Soc., 1996, 143, 1254–1259 CrossRef CAS
.
- J. J. Sumner, S. E. Creager, J. J. Ma and D. D. DesMarteau, J. Electrochem. Soc., 1998, 145, 107–110 CrossRef CAS
.
- K. A. Mauritz and R. B. Moore, Chem. Rev., 2004, 104, 4535–4585 CrossRef CAS PubMed
.
- J. Xu, Y.-L. Tsai and S.-H. Hsu, Molecules, 2020, 25, 5296 CrossRef CAS PubMed
.
- S. S. Athukorala, T. S. Tran, R. Balu, V. K. Truong, J. Chapman, N. K. Dutta and N. Roy Choudhury, Polymers, 2021, 13, 474 CrossRef CAS PubMed
.
- B. Rosenberg, J. Chem. Phys., 1962, 36, 816–823 CrossRef CAS
.
- B. Rosenberg and E. Postow, Ann. N. Y. Acad. Sci., 1969, 158, 161–190 CrossRef CAS PubMed
.
- C. Zhong, Y. Deng, A. F. Roudsari, A. Kapetanovic, M. P. Anantram and M. Rolandi, Nat. Commun., 2011, 2, 476 CrossRef PubMed
.
- Y. Wan, K. A. M. Creber, B. Peppley and V. T. Bui, Polymer, 2003, 44, 1057–1065 CrossRef CAS
.
- G. H. Bardelmeyer, Biopolymers, 1973, 12, 2289–2302 CrossRef CAS PubMed
.
- M. R. Powell and B. Rosenberg, Bioenergetics, 1970, 1, 493–509 CrossRef CAS
.
- J. Behi, S. Bone, H. Morgan and R. Pethig, Int. J. Quantum Chem., 1982, 22, 367–374 CrossRef
.
- G. Careri, A. Giansanti and J. Rupley, Proc. Natl. Acad. Sci. U. S. A., 1986, 83, 6810–6814 CrossRef CAS PubMed
.
- G. Careri, M. Geraci, A. Giansanti and J. A. Rupley, Proc. Natl. Acad. Sci. U. S. A., 1985, 82, 5342–5346 CrossRef CAS PubMed
.
- D. D. Ordinario, L. Phan, W. G. Walkup IV, J.-M. Jocson, E. Karshalev, N. Husken and A. A. Gorodetsky, Nat. Chem., 2014, 6, 596–602 CrossRef CAS PubMed
.
- D. D. Ordinario, L. Phan, J.-M. Jocson, T. Nguyen and A. A. Gorodetsky, APL Mater., 2015, 3, 014907 CrossRef
.
- M. Jastrzebska, H. Isotalo, J. Paloheimo and H. Stubb, J. Biomater. Sci., Polym. Ed., 1995, 7, 577–586 CrossRef CAS PubMed
.
- A. B. Mostert, B. J. Powell, I. R. Gentle and P. Meredith, Appl. Phys. Lett., 2012, 100, 093701 CrossRef
.
- A. B. Mostert, B. J. Powell, F. L. Pratt, G. R. Hanson, T. Sarna, I. R. Gentle and P. Meredith, Proc. Natl. Acad. Sci.U. S. A., 2012, 109, 8943–8947 CrossRef CAS
.
- M. Sheliakina, A. B. Mostert and P. Meredith, Adv. Funct. Mater., 2018, 28, 1805514 CrossRef
.
- A. B. Mostert, S. Rienecker, M. Sheliakina, P. Zierep, G. R. Hanson, J. R. Harmer, G. Schenk and P. Meredith, J. Mater. Chem. B, 2020, 8, 8050–8060 RSC
.
- J. V. Paulin, A. P. Coleone, A. Batagin-Neto, G. Burwell, P. Meredith, C. F. O. Graeff and A. B. Mostert, J. Mater. Chem. C, 2021, 9, 8345–8358 RSC
.
- Y. Agam, R. Nandi, T. Bulava and N. Amdursky, Mater. Adv., 2021, 2, 1739–1746 RSC
.
- E. J. Murphy, J. Phys. Chem. Solids, 1960, 16, 115–122 CrossRef CAS
.
- B. Lu, H. Yuk, S. Lin, N. Jian, K. Qu, J. Xu and X. Zhao, Nat. Commun., 2019, 10, 1043 CrossRef PubMed
.
- M. G. Evans and J. Gergely, Biochem. Biophys. Acta, 1949, 3, 188–197 CAS
.
- B. Rosenberg, Nature, 1962, 193, 364–365 CrossRef CAS PubMed
.
-
N. W. Ashcroft and N. D. Mermin, Solid State Physics, Brooks/Cole, 1976 Search PubMed
.
- P. Meredith, B. J. Powell, J. Riesz, S. P. Nighswander-Rempel, M. R. Pederson and E. G. Moore, Soft Matter, 2006, 2, 37–44 RSC
.
- K. A. Motovilov, V. Grinenko, M. Savinov, Z. V. Gagkaeva, L. S. Kadyrov, A. A. Pronin, Z. V. Bedran, E. S. Zhukova, A. B. Mostert and B. P. Gorshunov, RSC Adv., 2019, 9, 3857–3867 RSC
.
- N. Amdursky, X. Wang, P. Meredith, D. D. C. Bradley and M. M. Stevens, Adv. Mater., 2016, 28, 2692–2698 CrossRef CAS PubMed
.
- M. d'Ischia, K. Wakamatsu, A. Napolitano, S. Briganti, J. C. Garcia-Borron, D. Kovacs, P. Meredith, A. Pezzella, M. Picardo, T. Sarna, J. D. Simon and S. Ito, Pigm. Cell Res., 2013, 26, 616–633 Search PubMed
.
- A. B. Mostert, Polymers, 2021, 13, 1670 CrossRef CAS PubMed
.
- P. Meredith and J. Riesz, Photochem. Photobiol., 2004, 79, 211–216 CrossRef CAS
.
- A. B. Mostert, G. R. Hanson, T. Sarna, I. R. Gentle, B. J. Powell and P. Meredith, J. Phys. Chem. B, 2013, 117, 4965–4972 CrossRef CAS PubMed
.
- S. B. Rienecker, A. B. Mostert, G. Schenk, G. R. Hanson and P. Meredith, J. Phys. Chem. B, 2015, 119, 14994–15000 CrossRef CAS PubMed
.
- A. B. Mostert, S. B. Rienecker, C. Noble, G. R. Hanson and P. Meredith, Sci. Adv., 2018, 4, eaaq1293 CrossRef PubMed
.
- J. V. Paulin, A. Batagin-Neto, P. Meredith, C. F. O. Graeff and A. B. Mostert, J. Phys. Chem. B, 2020, 124, 10365–10373 CrossRef CAS PubMed
.
- A. Batagin-Neto, E. S. Bronze-Uhle and C. F. O. Graeff, Phys. Chem. Chem. Phys., 2015, 17, 7264–7274 RSC
.
- C. C. Felix, J. S. Hyde, T. Sarna and R. C. Sealy, J. Am. Chem. Soc., 1978, 100, 3922–3926 CrossRef CAS
.
- S. Chio, J. S. Hyde and R. C. Sealy, Arch. Biochem. Biophys., 1980, 199, 133–139 CrossRef CAS
.
- S. Chio, J. S. Hyde and R. C. Sealy, Arch. Biochem. Biophys., 1982, 215, 100–106 CrossRef CAS
.
- A. B. Mostert, K. J. P. Davy, J. L. Ruggles, B. J. Powell, I. R. Gentle and P. Meredith, Langmuir, 2010, 26, 412–416 CrossRef CAS PubMed
.
- J. A. Martinez-Gonzalez, H. Cavaye, J. D. McGettrick, P. Meredith, K. A. Motovilov and A. B. Mostert, Soft Matter, 2021, 17, 7940–7952 RSC
.
- A. J. Clulow, A. B. Mostert, M. Sheliakina, A. Nelson, N. Booth, P. L. Burn, I. R. Gentle and P. Meredith, Soft Matter, 2017, 13, 3954–3965 RSC
.
- M. Abbas, F. D'Amico, L. Morresi, N. Pinto, M. Ficcadenti, R. Natali, L. Ottaviano, M. Passacantando, M. Cuccioloni, M. Angeletti and R. Gunnella, Eur. Phys. J. E: Soft Matter Biol. Phys., 2009, 28, 285–291 CrossRef CAS
.
- T. Strzelecka, Physiol. Chem. Phys., 1982, 14, 219–222 CAS
.
- T. Strzelecka, Physiol. Chem. Phys., 1982, 14, 223–231 CAS
.
- J. Wünsche, Y. Deng, P. Kumar, E. Di Mauro, E. Josberger, J. Sayago, A. Pezzella, F. Soavi, F. Cicoira, M. Rolandi and C. Santanto, Chem. Mater., 2015, 27, 436–442 CrossRef
.
- J. McGinness, P. Corry and P. Proctor, Science, 1974, 183, 853–855 CrossRef CAS
.
- C. H. Culp, D. E. Eckels and P. H. Sidles, J. Appl. Phys., 1975, 46, 3658–3660 CrossRef CAS
.
- J. Filatovs, J. E. McGinness and P. H. Proctor, Biopolymers, 1976, 15, 2309–2312 CrossRef CAS PubMed
.
- M. Reali, A. Gouda, J. Bellemare, D. Ménard, J.-M. Nunzi, F. Soavi and C. Santato, ACS Appl. Bio Mater., 2020, 3, 5244–5252 CrossRef CAS
.
- P. R. Crippa, V. Cristofoletti and N. Romeo, Biochem. Biophys. Acta, 1978, 538, 164–170 CAS
.
- M. M. Jastrzebska, A. Kocot and L. Tajber, J. Photochem. Photobiol., B, 2002, 66, 201–206 CrossRef CAS
.
- P. Kumar, E. Di Mauro, S. Zhang, A. Pezzella, F. Soavi, C. Santato and F. Cicoira, J. Mater. Chem. C, 2016, 4, 9516–9525 RSC
.
- J. D. Hong and J. D. Simon, Photochem. Photobiol., 2006, 82, 1265–1269 CrossRef PubMed
.
- Y. Liu, L. Hong, V. R. Kempf, K. Wakamatsu, S. Ito and J. D. Simon, Pigm. Cell Res., 2004, 17, 262–269 CrossRef CAS
.
- L. Hong and J. D. Simon, J. Phys. Chem. B, 2007, 111, 7938–7947 CrossRef CAS PubMed
.
- P. Meredith and T. Sarna, Pigm. Cell Res., 2006, 19, 572–594 CrossRef CAS PubMed
.
- C. L. Serpentini, C. Gauchet, D. de Montauzon, M. Comtat, J. Ginestar and N. Paillous, Electrochim. Acta, 2000, 45, 1663–1668 CrossRef CAS
.
- M. P. da Silva, J. C. Fernandes, N. B. de Figueredo, M. Mulato and C. F. O. Graeff, AIP Adv., 2014, 4, 037120 CrossRef
.
- A. B. Mostert, Chem. Phys., 2021, 546, 111158 CrossRef CAS
.
- J. McGinness, Science, 1972, 177, 896–897 CrossRef CAS PubMed
.
- P. J. Gonçalves, O. B. Filho and C. F. O. Graeff, J. Appl. Phys., 2006, 99, 104701 CrossRef
.
- W. Osak, K. Tkacz, H. Czternastek and J. Slawinski, Biopolymers, 1989, 28, 1885–1890 CrossRef CAS
.
- Z. V. Bedran, S. S. Zhukov, P. A. Abramov, I. O. Tyurenkov, B. P. Gorshunov, A. B. Mostert and K. A. Motovilov, Polymers, 2021, 13, 4403 CrossRef CAS PubMed
.
- J. V. Paulin, A. Batagin-Neto and C. F. O. Graeff, J. Phys. Chem. B, 2019, 123, 1248–1255 CrossRef CAS PubMed
.
- J. V. Paulin, A. Batagin-Neto, B. Naydenov, K. Lips and C. F. O. Graeff, Mater. Adv., 2021, 2, 6297–6305 RSC
.
- M. Sheliakina, A. B. Mostert and P. Meredith, Mater. Horiz., 2018, 5, 256–263 RSC
.
- D. J. Carrad, A. B. Mostert, A. R. Ullah, A. M. Burke, H. J. Joyce, H. H. Tan, C. Jagadish, P. Krogstrup, J. Nygard, P. Meredith and A. P. Micolich, Nano Lett., 2017, 17, 827–833 CrossRef CAS PubMed
.
- J. G. Gluschke, J. Seidl, R. W. Lyttleton, K. Nguyen, M. Lagier, F. Meyer, P. Krogstrup, J. Nygård, S. Lehmann, A. B. Mostert, P. Meredith and A. P. Micolich, Mater. Horiz., 2021, 8, 224–233 RSC
.
- A. Savva, C. Cendra, A. Giugni, B. Torre, J. Surgailis, D. Ohayon, A. Giovannitti, I. McCulloch, E. Di Fabrizio, A. Salleo, J. Rivnay and S. Inal, Chem. Mater., 2019, 31, 927–937 CrossRef CAS
.
- M. D. Dickey, ACS Appl. Mater. Interfaces, 2014, 6, 18369–18379 CrossRef CAS PubMed
.
| This journal is © The Royal Society of Chemistry 2022 |
