 Open Access Article
Monitoring of phosphorus discharge in a sewage treatment plant with a phosphate automated analyzer
Adrian
Cabo
 a,
Susana
Gouveia
 a,
Claudio
Cameselle
 *a and
Keun-Heon
Lee
b
aUniversity of Vigo, Department of Chemical Engineering, BiotecnIA Group, Rua Maxwell s/n. Edificio Fundicion, 36310 Vigo, Spain. E-mail: acabo@uvigo.es; gouveia@uvigo.es; claudio@uvigo.es; Web: https://www.uvigo.gal/universidade/administracion-persoal/pdi/claudio-cameselle-fernandez Tel: +34 986 812 318
bHumas Co. Ltd., 26-77 Gajeongbuk-ro, Jang-dong, Yuseong-gu, Daejeon, South Korea. E-mail: humas1@humas.co.kr
First published on 1st August 2022
Abstract
The removal of phosphorus in the sewage treatment plant is commonly done with precipitation with ferric iron in the form of ferric chloride. Ferric iron is added to the sludge recycling stream to assure a good mixing with the wastewater in the biological reactor. The precipitated phosphate is removed in the secondary settling tanks with the excess of biological sludge. This study installed and optimized the operation of a phosphate automated analyzer in the wastewater treatment plant with the objective to use the phosphate concentrations to adjust the dosing of ferric chloride and minimize its consumption. The study tested three sampling points for the phosphate automated analyzer: the sludge recycling stream to the biological reactors, the outlet of the biological reactor and the final discharge effluent. The objective is to identify the most stable sampling point to determine the necessary amount of ferric chloride to comply with the phosphorus legal limit in the outlet stream discharge into the sea. This study concluded that the phosphate analysis in the final discharge effluent is the best location for a stable and reliable phosphate determination. Furthermore, the phosphate concentration in the final discharge effluent is proportional (97–98%) to the total phosphorus concentration, so the phosphate analyzer can be used for the monitoring of phosphorus assuring the compliance with the legal discharge limit.
Environmental significanceThis study determines the capability of a phosphate automated analyzer as an appropriate solution to comply with the legal phosphorus limit imposed by the regulations, minimizing the consumption of phosphate precipitating reagents. |
1. Introduction
Phosphorus is the second most important nutrient for agriculture, although it is also commonly used in food and beverages industry and detergents.1 The intense use of phosphorus, mainly as phosphate salts, resulted in the increasing of this element in wastewater and waterbodies such as lakes, seas and groundwater.2 The main effect of the increasing nutrient load in water is the eutrophication of the waterbodies with the subsequent loss of biodiversity an environmental quality.3 Furthermore, the presence of algae and bacteria in eutrophic water often results in toxic metabolites that affect the survival of birds and mammals and may threat human health.4The protection of the environment by the European Union regulations has accelerated the implementation of processes and technologies for the effective removal of contaminants from water and wastewater, including phosphorus.5 Several projects and studies have focused on the recovery of phosphorus from wastes and wastewater. Various reactive materials have been developed and tested to retain the soluble phosphorus from wastewater.6 Other studies focused in the recovery of phosphorus from the sludge stream in the sewage treatment plants. The sludge contains higher concentration of phosphorus compared with the wastewater in the treatment plant. That is why many studies developed solutions for the recovery of phosphorus with the reutilization of the sludge, mainly in agriculture.7
In wastewater treatment plants (WWTP), the presence of phosphorus in the water and its removal is still a problem considering the low discharge limits allowed for the present regulations. The conventional biological treatment processes are not effective in the removal of phosphorus because of the low phosphorus requirements for the biomass. Thus, improved biological or chemical processes are needed to remove the excess of phosphorus from wastewater to comply the legal discharge limit. The use of specific treatments based on algal biomass may help in the removal of phosphorus from water.8 However, the removal of phosphorus in sewage treatment plants usually relies in chemical precipitation with lime, iron and aluminum salts.9 The precipitation agents are added to the wastewater in the outlet stream of the biological reactor to induce the precipitation of phosphate salts in the secondary settling tanks. Phosphorus is finally removed with the excess of the biological sludge. This process usually requires an excess of chemical reagent to assure the removal of phosphate and the comply with the legal discharge limit.
The aim of this study is to monitor the concentration of phosphate in a sewage treatment plant with an automated analyzer. The automated analyzer provides the concentration of phosphate in real time, and this information can be used to adjust the dose of ferric iron (the precipitating agent for phosphate) to the actual phosphate concentration. So, we expect to reduce the consumption of ferric iron while assure the comply of the legal limit for phosphorus in the discharge effluent. This study focused in the stability and performance of the automated analyzer to determine the reliability of the phosphate readings. Then, we studied the most appropriate sampling point for phosphate measurement so we can have a reliable reading useful to adjust the dose of ferric iron while meeting the legal phosphorus limit in the sewage treatment discharge.
2. Materials and methods
2.1. Sewage treatment plant
The phosphate analysis and monitoring in the sewage treatment plant was carried out in the town of Nigrán, in the NW of Spain. This town has a population of about 18![[thin space (1/6-em)]](https://www.rsc.org/images/entities/char_2009.gif) 000 people as per the 2020 census,10 but the actual population increases by a factor of three in summertime due tourism, with the subsequent influence in wastewater flow and contaminant concentration, including phosphorus. The frequent rains in winter dilute the sewage water and, therefore, the phosphorus concentration is lower than in summer. The sewage treatment plant discharges the final effluent into the sea in a sensitive area due to the touristic interest and the aquiculture activities. The regional government had limited the phosphorus concentration in the final water discharge at 2 mg L−1 of total phosphorus (TP). These are the reasons to carry out a detailed study of the phosphorus concentration in the sewage water in Nigrán.
000 people as per the 2020 census,10 but the actual population increases by a factor of three in summertime due tourism, with the subsequent influence in wastewater flow and contaminant concentration, including phosphorus. The frequent rains in winter dilute the sewage water and, therefore, the phosphorus concentration is lower than in summer. The sewage treatment plant discharges the final effluent into the sea in a sensitive area due to the touristic interest and the aquiculture activities. The regional government had limited the phosphorus concentration in the final water discharge at 2 mg L−1 of total phosphorus (TP). These are the reasons to carry out a detailed study of the phosphorus concentration in the sewage water in Nigrán.
The wastewater treatment plant (WWTP) in Nigrán was designed for 70![[thin space (1/6-em)]](https://www.rsc.org/images/entities/char_2009.gif) 000 PE (population equivalent) with an average inlet flow of 817 m3 h−1, and a peak flow of 1469 m3 h−1. The plant includes in the pretreatment the screening and grit removal (Fig. 1). The primary settling tanks are used nowadays as storm tanks to accumulate the excess of water as a previous step to feed the two bioreactors. The secondary treatment is composed of two parallel activated sludge bioreactors and two clarifiers (secondary settling tanks). The operation of the biological reactors was designed to favor the nitrification–denitrification with an anoxic zone in the first part of the bioreactors. The sludge separated in the clarifiers is recycled to the bioreactor inlet stream. The excess of sludge is concentrated and partially stabilized before external management and disposal. The clarified water is disinfected by UV radiation and discharged into the sea through a marine outfall. The removal of phosphorus is carried out by chemical precipitation with FeCl3 (eqn (1)). Ferric iron is added in the recycled stream because the higher phosphorus concentration in this stream and to assure the complete mixing with the water in the biological reactor. The precipitate of ferric phosphate is removed in the secondary settling tanks with the excess of the biological sludge. Periodically, every 2–3 days, TP concentration is measured in the final discharge effluent and the ferric chloride dosing pump is adjusted manually to keep the TP concentration below the legal limit (2 mg L−1 total P).
000 PE (population equivalent) with an average inlet flow of 817 m3 h−1, and a peak flow of 1469 m3 h−1. The plant includes in the pretreatment the screening and grit removal (Fig. 1). The primary settling tanks are used nowadays as storm tanks to accumulate the excess of water as a previous step to feed the two bioreactors. The secondary treatment is composed of two parallel activated sludge bioreactors and two clarifiers (secondary settling tanks). The operation of the biological reactors was designed to favor the nitrification–denitrification with an anoxic zone in the first part of the bioreactors. The sludge separated in the clarifiers is recycled to the bioreactor inlet stream. The excess of sludge is concentrated and partially stabilized before external management and disposal. The clarified water is disinfected by UV radiation and discharged into the sea through a marine outfall. The removal of phosphorus is carried out by chemical precipitation with FeCl3 (eqn (1)). Ferric iron is added in the recycled stream because the higher phosphorus concentration in this stream and to assure the complete mixing with the water in the biological reactor. The precipitate of ferric phosphate is removed in the secondary settling tanks with the excess of the biological sludge. Periodically, every 2–3 days, TP concentration is measured in the final discharge effluent and the ferric chloride dosing pump is adjusted manually to keep the TP concentration below the legal limit (2 mg L−1 total P).
| Fe3+ + PO43− → ↓FePO4(s), KPS = 9.91 × 10⁻¹⁶ | (1) |
2.2. Phosphate automated analyzer
The automated phosphate analyzer model PHOSPO-H 4200, from Humas Co. Ltd. (Republic of Korea) was installed in the sewage treatment plant in Nigrán for the continuous measurement of the phosphate concentration in the line of water (Fig. 2). The automated analyzer was connected to three sampling points during this study, from July 2019 to October 2020: (a) the outlet stream of the biological reactor, (b) the recycle stream and (c) the final discharge effluent after disinfection (Fig. 1). The filtration unit model SR 4000 (from Humas Co. Ltd., Republic of Korea) was used as a pretreatment of the water sample to the PHOSPO-H 4200. The filtration unit SR 4000 remove the suspended solids in the water sample to avoid interferences and bad functioning of the phosphate automated analyzer (Fig. 2). PHOSPO-H 4200 is an automatic phosphate analyzer designed for the continuous measurement of phosphate concentration in water samples using the colorimetric method based on the vanadomolybdophosphoric acid.11 The PHOSPO-H 4200 is able to determine the concentration of phosphate in a sample of water in the range 0–5 mg L−1 of P, in less than 10 min.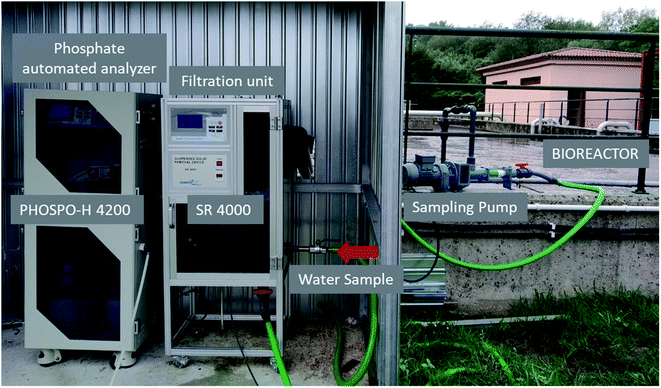 | ||
| Fig. 2 Filtration unit SR 4000 and phosphate automated analyzer PHOSPO-H 4200 in the WWTP of Nigrán. | ||
2.3. Analytical methods
The same water samples from the WWTP analyzed by the PHOSPO-H 4200 automated analyzer were sent to the University of Vigo for analysis to supervise the functioning of the automated analyzer. Four different analytical methods were used to determine the concentration of phosphate or TP in water samples. (a) Vanadate–molybdate colorimetric method for the determination of phosphate as described in the Standard Methods for the Analysis of Water and Wastewater.11 (b) Ascorbic acid method, it is a colorimetric method for the determination of phosphate, as described in the Standard Methods for the Analysis of Water and Wastewater.11 (c) ICP-AES, inductively coupled plasma atomic emission spectroscopy is a method to determine the total phosphorous. The analyses were carried out at the analysis center of the Univ. of Vigo with a piece of equipment PerkinElmer, model Optima 4300 DV. (d) Ionic chromatography, the determination of the phosphate ion in water samples were carried out with a segmented flow analyzer, model AutoAnalyzer AA3, from Bran+Luebbe (Germany).3. Results and discussion
3.1. Calibration of the PHOSPO-H 4200 automated analyzer
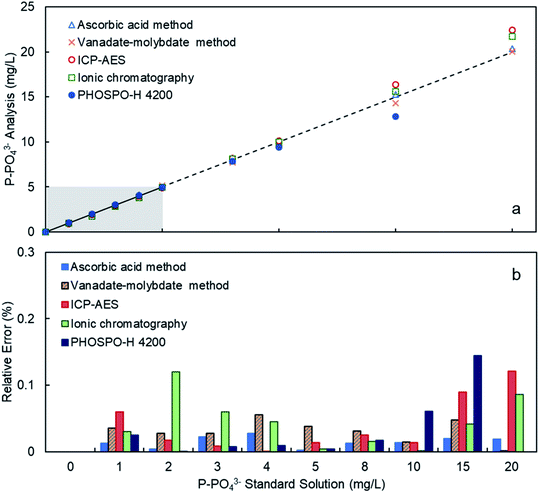
The PHOSPO-H 4200 automated analyzer was calibrated in the range 0–5 mg L−1 of P using phosphate standard solutions prepared with KH2PO4 in deionized water. Fig. 3 and Table 1 shows the response of the PHOSPO-H 4200 to the standard solutions after the calibration. The average relative error in the range 0–5 mg L−1 was as low as 0.57%. In the range 5–10 mg L−1 of P, over the calibration range, the PHOSPO-H 4200 also showed a reliable response with an error below 6%. Fig. 3 and Table 1 compare the response of the automated analyzer with four analytical methods at the University of Vigo. The PHOSPO-H 4200 showed the lowest error in the calibration range (0–5 mg L−1 of P) among the five analytical methods, confirming the precision and accuracy of the automated analyzer.| P-PO43− (mg L−1) | Ascorbic acid method | Vanadate–molybdate method | Ionic chromatography | ICP-AES | PHOSPO-H 4200 | ||||||||||
|---|---|---|---|---|---|---|---|---|---|---|---|---|---|---|---|
| Mean | Absolute error | Relative error | Mean | Absolute error | Relative error | Mean | Absolute error | Relative error | Mean | Absolute error | Relative error | Mean | Absolute error | Relative error | |
| 0 | 0.00 | 0.00 | 0 | 0.00 | 0.00 | 0.00% | 0.00 | 0.00 | 0.00% | 0.00 | 0.00 | 0.00% | 0.00 | 0.00 | 0.00% |
| 1 | 1.01 | 0.01 | 1.24% | 1.04 | 0.04 | 3.53% | 0.97 | −0.03 | 3.00% | 0.94 | −0.06 | 6.00% | 1.03 | 0.03 | 2.52% |
| 2 | 1.99 | 0.00 | 0.40% | 1.94 | −0.06 | 2.79% | 1.76 | −0.24 | 12.00% | 1.97 | −0.03 | 1.75% | 2.00 | 0.00 | 0.07% |
| 3 | 2.93 | −0.03 | 2.27% | 2.92 | −0.08 | 2.75% | 2.82 | −0.18 | 6.00% | 2.98 | −0.02 | 0.83% | 3.02 | 0.02 | 0.72% |
| 4 | 4.11 | 0.02 | 2.75% | 3.78 | −0.22 | 5.51% | 3.82 | −0.18 | 4.50% | 4.00 | 0.00 | 0.05% | 4.04 | 0.04 | 0.89% |
| 5 | 4.99 | 0.00 | 0.20% | 5.19 | 0.19 | 3.82% | 4.98 | −0.02 | 0.40% | 4.93 | −0.07 | 1.36% | 4.98 | 0.02 | 0.38% |
3.2. Stability of the calibration
The stability of the calibration of the PHOSPO-H 4200 was determined with periodic measurements of phosphate standard solutions (blue dots in Fig. 4). The red vertical lines represent the date when the calibration was done. The first calibration was done on July 4, 2019; and it was stable for 46 days of continuous operation, until August 19, when the deviation of the 5 mg L−1 of P standard solution was only 1%. The calibration was done periodically or when significant deviation in the response of the analyzer to the standard solutions was observed. Overall, it can be concluded that the calibration of the automated analyzer was stable for about a month, although it was decided to check the calibration and renew the reagent solutions every 2–3 weeks to assure the optimum performance of the analyzer.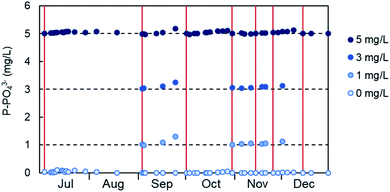 | ||
| Fig. 4 Stability of the calibration of the PHOSPO-H 4200 automated analyzer in the range 0–5 mg L−1 of P from July to December, 2019. | ||
3.3. Precision of the analysis
The precision of the analysis with PHOSPO-H 4200 was verified by repeating analysis of 2 different samples from the WWTP with different phosphate concentration in the range 1.5–3.0 mg L−1 of phosphate. As shown in Fig. 5, the relative standard deviation is 2.2–2.4%. Overall, it can be concluded that the PHOSPO-H 4200 is very precise for the monitoring of the phosphate concentration in the WWTP.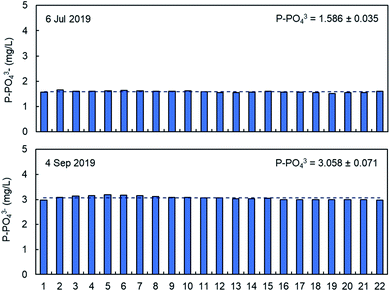 | ||
| Fig. 5 Repeated analysis of phosphate in two samples from the WWTP with the PHOSPO-H 4200 automated analyzer. | ||
3.4. Monitoring of phosphate concentration in the WWTP
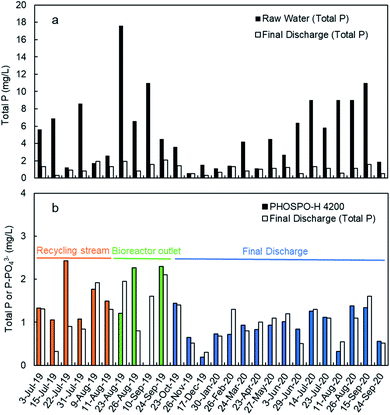
The monitoring of the phosphate concentration was done in three sampling points in the line of water: in the recycle stream, in the outlet of the biological reactor, and in the final discharge effluent (Fig. 6) from July 2019 to October 2020. The three sampling points can be used for the regulation of the ferric iron dosing pump. The main limitation of the analyses in the recycle stream and bioreactor outlet is the large content in suspended solids. The filtration unit SR 4000 was used to obtain a clear water sample before analysis in the PHOSPO-H 4200. The solid content is the final discharge effluent is negligible. This is one of the reasons to move the sampling point to the final discharge effluent in October 2019. But the main reason for selecting the final discharge effluent as sampling point was to assure that the phosphate concentration complies with the legal limit. Besides, the phosphate concentration in the final discharge effluent showed lower fluctuations than that in the other two sampling points, making the control of the Fe3+ dosing pump more stable.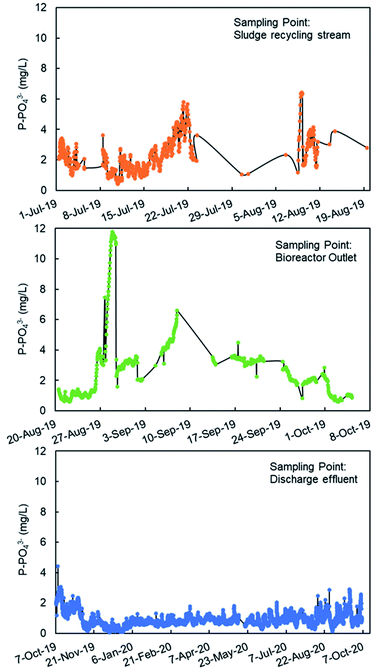 | ||
| Fig. 6 Phosphate analysis with PHOSPO-H 4200 in three sampling points in the WWTP of Nigrán from July 2019 to October 2020. | ||
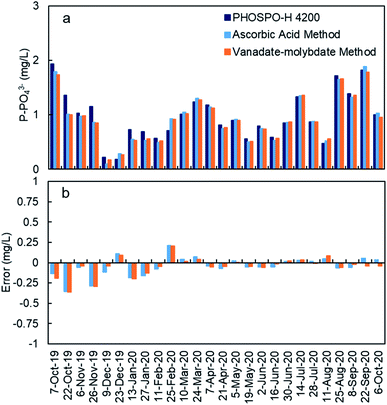
The response of the PHOSPO-H 4200 automated analyzer was supervised with periodic counter analyses at the University of Vigo using two analytical methods (vanadate–molybdate method and ascorbic acid method). As shown in Fig. 7, the absolute error is below ±0.35 mg L−1 but the error in the measurements was much lower from February 2020 (absolute error ≤ ±0.05 mg L−1) due to the renovation of reagents and recalibration every 2–3 weeks.
3.5. The removal of phosphate in the WWTP
Fig. 8a shows the TP concentration in the raw water and the final discharge effluent from July 2019 to September 2020. These analyses were done with composed samples of 24 hours taken with an automated sampler. As it can be seen, TP in the raw water is much higher in summer than in winter as it was explained before. Moreover, there was also a significant variation in the TP concentration along the day, with lower concentrations during the night coinciding with the lowest contaminant concentration (data not shown). In the final discharge effluent, TP is below 2 mg L−1 due to the treatment with ferric chloride. The TP concentration in the final discharge effluent are compared in Fig. 8b with the phosphate concentration with the automated analyzer. The results shown in Fig. 8b are the average values of phosphate in 24 samples per day (1 sample per hour) to be comparable with the 24 h-composed samples. It is evident from Fig. 8b that the final discharge effluent is the best sampling point to control the dosing of ferric chloride to remove the phosphate from water.In this point, an important question arises: “is it phosphate the right parameter to measure when the legal limit is expressed as TP?” To answer this question, it is necessary to make a study about the concentrations of phosphate and TP in the WWTP.
3.6. Total phosphorus versus phosphate in the WWTP
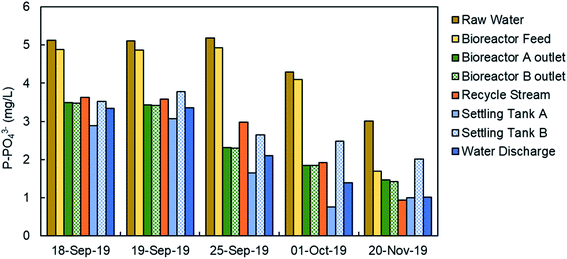
Fig. 9 shows the concentration of phosphate in the water line in the WWTP in five specific days from September to November, 2019. The analyses were done in filtered samples, so the results corresponded to the soluble phosphate (no TP). As it was expected, the higher phosphate concentration corresponded to the raw water in the inlet stream to the WWTP, mainly in September, and then decreases due to the lower actual population after the summer season and the dilution due to autumn rains. The feed stream to the bioreactors showed a similar concentration of phosphate because there is no primary treatment (settling tanks are used as storm tanks). The secondary treatment includes biological reactors, settling tanks and the phosphate precipitation system. There was a significant reduction in the phosphate concentration in water in the secondary treatment mainly due to the precipitation with ferric chloride, although the biological treatment may have some influence in the reduction of the phosphate concentration due to biological assimilation. The final discharge effluent showed a phosphate concentration in the range 1.5–3 mg L−1 of P-PO43− in the 5 samples. A detailed study about the TP and the phosphate concentration was done on November 21 and the results are presented in Table 2. We have analyzed the TP and phosphate in the water samples and in the filtered samples. The trend of TP and phosphate concentration is similar to that in Fig. 9. But the most important result is the ratio between the TP and the phosphate (last column in Table 2). In the bioreactor TP and phosphate concentrations are very different because most of the phosphorus is part of biomass. In the final discharge effluent, soluble phosphate is 96% of the TP. This result confirm that the analysis of phosphate can be used to monitor the TP. The study of the ratio between TP a phosphate in the final discharge effluent was extended from October 2019 to September 2020, as presented in Fig. 10. There is a clear straight correlation between the TP and the phosphate in the final discharge and the ratio is about 98%. As a conclusion, we can state that the phosphate concentration can be used to monitor the TP in the discharge of the WWTP.| Total phosphorus (mg L−1) | Total phosphorus (filtered sample) (mg L−1) | Phosphate (soluble) (mg L−1) | PO43−/TP (%) | |
|---|---|---|---|---|
| Raw water | 4.08 ± 0.11 | 3.66 ± 0.05 | 3.01 ± 0.10 | 74% |
| Bioreactor feed | 2.16 ± 0.05 | 2.00 ± 0.00 | 1.69 ± 0.06 | 78% |
| Recycle stream | 59.76 ± 0.22 | 2.36 ± 0.05 | 2.01 ± 0.02 | 3% |
| Bioreactor A outlet | 58.40 ± 0.40 | 1.82 ± 0.08 | 1.47 ± 0.09 | 3% |
| Bioreactor B outlet | 32.32 ± 0.18 | 1.88 ± 0.04 | 1.42 ± 0.01 | 4% |
| Settling tank A | 1.06 ± 0.05 | 1.06 ± 0.05 | 1.00 ± 0.03 | 94% |
| Settling tank B | 1.08 ± 0.04 | 1.10 ± 0.00 | 1.02 ± 0.11 | 94% |
| Water discharge | 0.98 ± 0.04 | 0.96 ± 0.05 | 0.94 ± 0.04 | 96% |
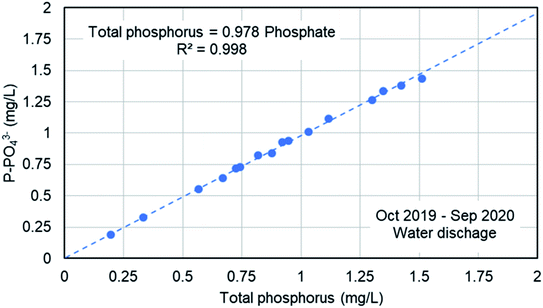 | ||
| Fig. 10 Correlation between the TP and the phosphate concentration in the final discharge effluent in the WWTP of Nigrán. | ||
4. Discussion
The aim of this study is to monitor the discharge of phosphorus in the WWTP in Nigrán, with the objective to comply with the legal limit: 2 mg L−1 of TP. We have selected and installed an automated phosphate analyzer. The analysis of phosphate is much simpler than the TP because the digestion at high temperature is not necessary. Besides, the phosphate automated analyzer is technically simpler, it consumes less chemicals and energy, and it requires less maintenance than the TP analyzer. Furthermore, the TP analysis takes more than 1 h to complete, whereas the phosphate analysis takes less than 10 min, including the washing cycle, to be ready for a new analysis. We tested the phosphate analyzer for more than a year (July 2019–October 2020) and proved that the readings are stable and reliable.In the WWTP, the removal of phosphate is carried out by precipitation with the addition of ferric chloride in the sludge recycling stream (Fig. 1). Thus, the precipitating reagent is complete mixed with the wastewater in the biological reactor reducing the consumption of reagent. The precipitate of ferric phosphate is formed in the biological reactor and then, it is separated in the secondary settling tanks and removed with the excess of biological sludge. The effluent from the secondary settling tanks flows to the UV disinfection tank and then it is discharged through a marine outfall. Considering the structure of the plant, the phosphate sampling point can be done before (recycle stream) or after (bioreactor outlet) the addition of the ferric iron. The analysis in the recycled stream and in the bioreactor outlet was more complex due to the high concentration of suspended solids that interfere in the phosphate colorimetric method. The solids are removed by the filtration unit SR 4000 (Humas Co. Ltd., South Korea). Alternatively, the sampling point can be set in the final discharge effluent. This point for analysis may be the most adequate to ensure the compliance with the legal phosphorus discharge limit. The results proved that the best sampling point is the water discharge for the following reasons: (a) negligible solid content, and therefore the filtration unit (SR 4000) is not necessary, (b) more stable phosphate concentrations with low fluctuations and (c) the phosphate concentration can be correlated with the actual TP content in the discharge effluent. This is an important point because the legal limit is defined for the final discharge. We have proved with one year of analysis that the phosphate in the final discharge effluent is about 97–98% of the TP. Thus, we can assure the comply of the legal P limit fixing our target concentration to 1.9 mg L−1 of phosphate, which is equivalent to 2 mg L−1 of TP.
5. Conclusions
The PHOSPO-H 4200 is an automated analyzer for phosphate in water that was tested for phosphate monitoring in the WWTP of Nigrán (NW Spain). The equipment showed very accurate and precise phosphate concentrations as it was proved after the continuous supervision of the piece of equipment for a year. The automated analyzer was calibrated in the range from 0 to 5 mg L−1 of P-PO43−. The calibration was stable for about a month although it was decided to the recalibration and the renewal of the reagent every 2–3 weeks to assure the optimum performance. The analysis of phosphate can be done directly in the final discharge effluent and the phosphate concentration represent about 97–98% of the total phosphorus. So, the phosphate analyzer can be used to monitor the phosphorus discharge in the plant and the comply with the legal limit. The phosphate analyzer does not substitute the periodic total phosphorus analysis in an external laboratory as per regulations. The automated phosphate analyzer can be used to adjust the dosing of ferric chloride to ensure the compliance of the phosphorus legal limit in the discharge effluent.Author contributions
Adrián Cabo: investigation, methodology, data curation. Susana Gouveia: investigation, methodology, data curation. Claudio Cameselle: conceptualization, supervision, formal analysis, writing. Keun-Heon Lee: conceptualization, funding acquisition.Conflicts of interest
There are no conflicts to declare.Acknowledgements
This Research was supported by R&D Center for Green Patrol Technologies through the R&D for Global Top Environmental Technologies funded by Ministry of Environment (MOE), Republic of Korea, NTIS No. 1485016089.References
- M. Chen and T. E. Graedel, A half-century of global phosphorus flows, stocks, production, consumption, recycling, and environmental impacts, Global Environ. Change, 2016, 36, 139–152 CrossRef
.
- N. X. Li, J. F. Xu, W. Yin, Q. Z. Chen, J. Wang and Z. H. Shi, Effect of local watershed landscapes on the nitrogen and phosphorus concentrations in the waterbodies of reservoir bays, Sci. Total Environ., 2020, 716, 137132 CrossRef CAS PubMed
.
- M. El Wali, S. R. Golroudbary and A. Kraslawski, Circular economy for phosphorus supply chain and its impact on social sustainable development goals, Sci. Total Environ., 2021, 777, 146060 CrossRef CAS PubMed
.
-
R. Nieder, D. K. Benbi and F. X. Reichl, Reactive Water-Soluble Forms of Nitrogen and Phosphorus and Their Impacts on Environment and Human Health, in Soil Components and Human Health, Springer, Dordrecht, 2018, pp. 223–255, DOI:10.1007/978-94-024-1222-2_5
.
- M. Smol, C. Adam and M. Preisner, Circular economy model framework in the European water and wastewater sector, J. Mater. Cycles Waste Manage., 2020, 22(3), 682–697 CrossRef
.
- M. K. Perera, J. D. Englehardt and A. C. Dvorak, Technologies for Recovering Nutrients from Wastewater: A Critical Review, Environ. Eng. Sci., 2019, 36(5), 511–529 CrossRef CAS
.
- W. Kwapinski, I. Kolinovic and J. J. Leahy, Sewage Sludge Thermal Treatment Technologies with a Focus on Phosphorus Recovery: A Review, Waste and Biomass Valorization, 2021, 12(11), 5837–5852 CrossRef CAS
.
- I. S. A. Abeysiriwardana-Arachchige, S. P. Munasinghe-Arachchige, H. M. K. Delanka-Pedige and N. Nirmalakhandan, Removal and recovery of nutrients from municipal sewage: Algal vs. conventional approaches, Water Res., 2020, 175, 115709 CrossRef CAS PubMed
.
- C. Jowett, C. James, I. Solntseva, S. Glasauer and L. Wu, Removal of sewage phosphorus by adsorption and mineral precipitation, with recovery as a fertilizing soil amendment, Water Sci. Technol., 2018, 77(8), 1967–1978 CrossRef CAS PubMed
.
- INE, Cifras de población. Últimos datos, National Institute of Statistics, available at: https://www.ine.es/dyngs/INEbase/es/operacion.htm?c=Estadistica_C%26cid=1254736176951%26menu=ultiDatos%26idp=1254735572981, accessed on April 2, 2021 Search PubMed.
-
R. B. Baird, C. E. W. Rice and A. D. Eaton, Standard Methods for the Examination of Water and Wastewater, Water Environment Federation, American Public Health Association, American Water Works Association, Washington (US), 23rd edn, 2017, ISBN: 9780875532875 Search PubMed
.
| This journal is © The Royal Society of Chemistry 2022 |


