Chemical conjugation to differentiate monosaccharides by Raman and surface enhanced Raman spectroscopy†
Hannah C.
Schorr
and
Zachary D.
Schultz
 *
*
Department of Chemistry and Biochemistry, The Ohio State University, Columbus, OH 43210, USA. E-mail: Schultz.133@osu.edu
First published on 21st March 2023
Abstract
Sugars play important roles in numerous biological processes, from providing energy to modifying proteins to alter their function. Glycosylation, the attachment of a sugar residue to a protein, is the most common post translational modification. Identifying the glycans on a protein is a useful tool both for pharmaceutical development as well as probing the proteome and glycome further. Sugars, however, are difficult analytes to probe due to their isomeric nature. In this work, Raman spectroscopy and surface enhanced Raman spectroscopy (SERS) are used to identify different monosaccharide species based on the vibrational modes of these isomeric analytes. The weak scattering of the sugars was overcome through conjugation with phenylboronic acid to provide a larger Raman scattering cross section and induce slight changes in the observed spectra associated with the structure of the monosaccharides. Spontaneous Raman, SERS in flow, and static SERS detection were performed in order to discriminate between arabinose, fructose, galactose, glucose, mannose, and ribose, as well as provide a method for identification and quantification for these sugar conjugates.
Introduction
Sugars play an important role in regulating diverse properties and activities in biological systems. Glucose metabolism is associated with energy production. The identification and conversion of different monosaccharides is key in different biochemical pathways.1 One example is glycosylation, the attachment of a sugar residue (or glycan) to alter protein function. Glycosylation is the most common post translational modification (PTM) and can occur at any point in a protein's life cycle.2 While the genome is only composed of about 20 K to 25 K genes, the proteome consists of over 1 million proteins due to PTMs.3 Glycosylation in particular is known to affect protein folding, function, stability, and distribution, and often plays a role in cancer,4 inherited disease, and immune recognition. Because of this, glycoproteins have also become commonly used as therapeutic drugs.5 Glycoproteins are being used to treat diseases such as multiple sclerosis, anemia, rheumatoid arthritis,6 and there is even some research into using glycoproteins to treat Covid-19.7 The individual glycans on the surface of these glycoproteins can determine how a particular protein is going to interact with other cellular components and what functions it will carry out. The interactions of sugars with proteins and in other metabolic processes have important consequences in determining biological activity. For these reasons, a rapid, accurate method for analyzing sugars is of intense interest.Carbohydrate analysis is complex due to the isomeric nature of mono- and oligosaccharides. In mammals, glycans consist of 10 monosaccharide units that work as the building blocks for oligosaccharides. Typically, when investigating the glycome, multiple methods must be used in tandem to get a better look at the whole picture, and even then, only a fraction of the glycoproteome is able to be identified at a time. HPLC is used as a separation and detection technique with UV-Vis absorption as a detector, but coeluting glycans may be combined into one peak in the chromatogram, making the results difficult to interpret.8 Because many glycans are isomers, and many have similar polarities, traditional reverse phase chromatography is not ideal for separating complex mixtures of various glycans and glycoproteins. More specialized separation techniques with affinity for specific subsets of the glycome must be used instead. Current methods for separating glycans include lectin affinity chromatography, which can target either N-linked or O-linked glycans, but not at the same time.9 Hydrophilic interaction liquid chromatography (HILIC) offers increased separation and retention for analytes that are hard to retain on reverse phase chromatography columns, but can involve harsh solvent conditions and can produce difficult to reproduce results.10–13 While HILIC is becoming increasingly used for glycan analysis,14,15 detection still remains an issue. High performance anion-exchange chromatography (HPEAC) is also a powerful technique for separating polar compounds, but the high salt content of the mobile phase often causes trouble with detector coupling, especially to mass spectrometry.16
A common detection method used for the analysis of sugars is mass spectrometry. Due to many monomeric sugars being structural isomers and therefore having identical masses, it can be difficult to determine glycan structures and the monomeric components of oligomers.17 While techniques in mass spectrometry have been advancing rapidly, this remains a difficult area to study, and often requires tandem mass spectrometry or ion mobility mass spectrometry and careful data review to distinguish between structural isomers.18 Sugars can also be detected using refractive index detection, however refractive index detectors do not give chemically specific information, so any coeluting species may not be distinguished, and typically require sample sizes that are a mL or more in volume.19
Other detection methods can provide complementary analysis for the identification of biomolecules and other isomeric analytes.20,21 Vibrational spectroscopy, and Raman in particular, has the ability to distinguish between structural isomers due to the unique combination of features in their spectra. Spontaneous Raman measurements have frequently been used to differentiate between cis and trans isomers of various organic molecules.22,23 While Raman is a useful tool for probing molecules, Raman scattering is a low probability phenomenon. For this reason, surface enhanced Raman spectroscopy is employed. Surface enhanced Raman scattering (SERS) can provide increased sensitivity arising from the interaction of a molecule with a plasmonic nanoparticle. In SERS, excitation of a localized surface plasmon resonance provides a locally enhanced electric field that can increase the Raman signal from molecules within this field to the point where single molecules can be detected.24–26 While not all molecules experience this level of enhancement, the increased signals can be used to increase the sensitivity, lower the limit of detection, and distinguish between isomers in Raman experiments.20,27 Additionally, the SERS enhancement significantly varies with distance from the surface which can alter the spectrum based on how molecules absorb and orient with respect to the metal nanoparticle surface. In a previous report, the Schultz lab was able to discriminate between phosphorylated carbohydrates and other structural isomers using SERS,20,27 Similarly, entacapone isomers were able to be quantitatively detected using SERS and partial least squares regression techniques.28–30 In an experiment with riboflavin, band intensity changes were noticed when the orientation of the molecule to the surface was altered electrochemically,31 and a similar effect has been shown with 2,2′-bipyridine.32 Since SERS probes the vibrational modes of a molecule to produce a unique Raman spectrum, it is possible to differentiate between isomers33 as well as many other analytes.34
It is important to be able to identify the sugars that can be found on protein structures and in metabolic pathways. Monosaccharides such as glucose remain difficult to analyze using SERS due to their low Raman scattering cross section,35,36 as well as their low affinity for adsorption to metals.37,38 The concentration of carbohydrates in a biological sample is typically in the micromolar to millimolar range,39 so finding a way to lower detection limits while still providing molecularly specific information is necessary for efficient analysis of this class of molecules.
The difference between spectra can be subtle, which requires chemometric techniques such as principal component analysis (PCA) and hierarchical cluster analysis (HCA) to highlight distinct differences in the spectra for each sugar.40,41 PCA aims to reduce multivariate data to as few spectral components as possible while preserving the majority of the variance. Each sample is also assigned a score which correlates to how much the sample's variance resembles a particular component.42 HCA produces nested clusters based on how the algorithm being employed dictates a proximity matrix.43 Clusters can then be formed based on a number of different selection methods. One example, K-nearest neighbors, uses proximity to other data points to determine similarity based on the assumption that similar points will be found near each other.44
In this work, the conjugation between phenylboronic acids and cis-diols is utilized to increase the polarizability and enable differentiation of a number of monosaccharide. Many of the common monosaccharides contain a cis-diol in their structure. By conjugating the monosaccharides to phenylboronic acid,45–47 it creates a molecule that has a higher affinity for metal adsorption as well as a larger Raman scattering cross section. This allows the sugars to be detected at lower concentrations, and still preserves the molecular specificity that allows for differentiation. To improve differentiation, we employ multivariate analysis methods such as PCA and HCA to show distinct clustering and differentiation of simple monosaccharides.
Materials and methods
Materials and reagents
L-(+)-Arabinose (≥99%), D-(−)-fructose, (≥99%), D-(+)-galactose (≥99%), D-(+)-glucose (≥99.5%, GC graded), D-(+)-mannose (≥99%), D-(−)-ribose (≥99%), phenylboronic acid (95%), 4-mercaptophenylboronic acid (90%), and sodium hydroxide pellets (≥97.0%, ACS reagent) were purchased from Sigma Aldrich (St Louis, MO). Ethanol (200 proof) was purchased from Decon Labs Inc. (King of Prussia, PA). Nanopure water (18.2 MΩ) was obtained from a Thermo Scientific Genpure system. Bare fused silica capillary with 75 μm inner diameter and 150 μm outer diameter was purchased from Polymicro Technologies (Pheonix, AZ).Phenylboronic acid–sugar conjugation
Phenylboronic acid (PBA)/mercaptophenylboronic acid (mPBA) were conjugated to the sugars by mixing 1![[thin space (1/6-em)]](https://www.rsc.org/images/entities/char_2009.gif) :
:![[thin space (1/6-em)]](https://www.rsc.org/images/entities/char_2009.gif) 1 molar ratios of the monosaccharide and PBA/mPBA in aqueous solution as previously reported.46,48,49 The PBA forms a boronate ring with cis-diols, common to many sugars. All reactions occur on the benchtop at room temperature. Reactions occur readily, though all samples were given at least half an hour to sit before measurement. pH adjustments were achieved by adding the necessary amounts of 0.1 M HCl or 0.1 M NaOH and verifying the pH with a pH meter.
1 molar ratios of the monosaccharide and PBA/mPBA in aqueous solution as previously reported.46,48,49 The PBA forms a boronate ring with cis-diols, common to many sugars. All reactions occur on the benchtop at room temperature. Reactions occur readily, though all samples were given at least half an hour to sit before measurement. pH adjustments were achieved by adding the necessary amounts of 0.1 M HCl or 0.1 M NaOH and verifying the pH with a pH meter.
SERS substrate preparation
SERS substrates were prepared by thermal evaporation as previously reported.50 Briefly, silver pellets (Kurt J. Lesker Company, Jefferson Hills, PA) were evaporated onto an anodized aluminum oxide (AAO) filter with 0.2 μm pores (Global Life Sciences, Buckinghamshire, UK). The substrate was then soaked in 0.1 M sodium hydroxide for 4 hours to remove the AAO filter from the silver to reveal a nanostructured surface of heterogeneous Ag structures. The substrates are stored under vacuum following Ag deposition until used, where upon the AAO filter is dissolved in the sodium hydroxide solution. Substrates stored in this manner are observed to be stable over 3 months of storage. For substrates where the mPBA–sugar conjugate was detected, the substrate was soaked in a 10 mM ethanolic solution of the thiolated sugars for 24 hours prior to soaking in sodium hydroxide to remove the filter. Prior to experiments, the substrates were affixed onto glass slides. The linear surface area of the SERS substrate is 530 mm2.Raman detection
Spontaneous Raman measurements of solutions were obtained using a Snowy Range Instruments IM-52 benchtop Raman Spectrometer equipped with a 638 nm laser. Acquisitions were made with 31.7 mW laser power for 5 seconds each. Samples were contained in 1 mL glass vials, and 750 μL of sample was used for each measurement.SERS spectra were obtained using a Renishaw inVia Qontor confocal Raman microscope with a CCD camera. A continuous wave laser at 632.8 nm, a 1200 grooves per mm grating, a 50×, NA = 0.50 objective, 0.38 mW laser power, and 1 s acquisition times were used for static mapping measurements.
For in flow measurements, a homebuilt Raman spectrometer was used. A 632.8 HeNe laser at 1 mW was focused onto a substrate in a flow cell previously described by the Schultz lab.51,52 Briefly, a fluorinated ethylene propylene (FEP) base plate has been fitted with inlet and outlet ports to accommodate sheath flow. A silicone gasket is placed atop the base plate, and a glass slide drilled with holes to fit the sheath flow ports is next. A substrate is placed on the slide, a 75 μm inner diameter capillary is laid across the top of the substrate, and a flow channel is defined using a 500 μm silicone gasket. A cover slip is placed on the gasket, and a stainless-steel top plate is screwed down to create a seal and keep everything in place. A 40×, NA = 0.8 water immersion objective was used for focusing the laser and collecting Raman scattering. The Raman scattered light was directed to an Andor Shamrock 303i spectrograph and an Andor iDus 401 CCD. Raman spectra (500 spectra per sample) were recorded in series with 250 ms acquisition times. For the flow measurements, the flow rate of the sample was 1 μL min−1, and the flow rate of the sheath fluid was 30 μL min−1. The sample volume used for the flow experiments was approximately less than 100 μL. Spectra were collected from flowing solutions.
To account for potential changes arising from the different sensitivities of the three Raman instruments, we generated calibration curves for ethanolic solutions on all three instruments and determined the limit of detection for each, Table S1 and Fig. S1.† The limits of detection and sensitivity for all three instruments were observed to be comparable, with some small changes in the observed noise which may arise from the obtainable powers from each instrument for spontaneous Raman. The equivalent sensitivities indicate the instruments are comparable and do not impact the results significantly.
UV-vis spectroscopy
UV-vis measurements were obtained using a VWR UV-1600PC spectrometer. Samples were prepared in aqueous solution and measured in 1 cm quartz cuvettes. Spectra were acquired over the wavelength range of 200 to 400 nm with a spectral resolution of 1 nm.Data analysis
All spectral data was processed by Matlab 2020a (Mathworks). Peak fitting was performed using the code Peakfit.m available for matlab.53 Spectral peaks were fit with to a Gaussian line shape using the Matlab script. The spectra were normalized prior to analysis but no other preprocessing was performed. PCA and HCA, using K-nearest neighbor applied to the PCA output, were performed using PLS toolbox (Eigenvector Research, Inc.) operating in Matlab.Results and discussion
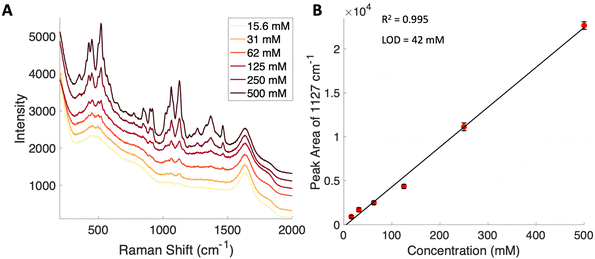
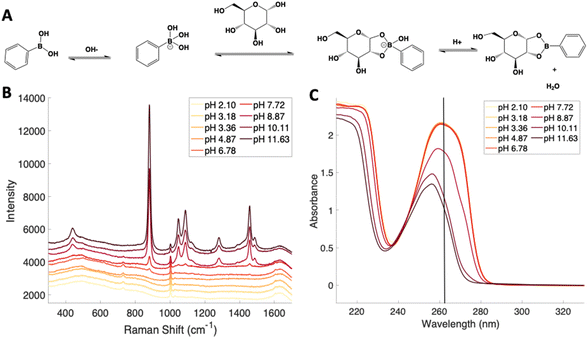
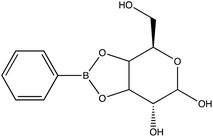
Given the importance of identifying the sugar residues related to protein glycosylation, we performed experiments to assess the sensitivity of Raman scattering toward the detection of individual glycans in solution. To assess the sensitivity, we used glucose as a model glycan. A calibration curve for aqueous glucose was constructed from the Raman spectra obtained from varying concentration solutions as shown in Fig. 1. The spontaneous Raman spectroscopy limit of detection for glucose was determined using 3 times the standard error of y divided by the slope and found to be 42 mM. Using the SARS-CoV-2 spike protein as a model protein, and assuming that all 30 glycosylation sites54 are filled by a singular glucose molecule cleaved off with 100% efficiency, to reach this 42 mM detection limit in a 1 mL sample, 210 mg of the spike protein would be required. This would mean that a 1 mM sample of the protein would need to be obtained. Except for serum albumin, most proteins are found at significantly lower concentrations. Additionally, there is expected variation in the attached glycans, which would require even higher concentration samples.Previous reports have noted challenges detecting glucose by Raman and SERS.20,55 To lower this detection limit and make the monosaccharide more amenable for SERS detection, glucose was reacted with phenylboronate (PBA), the conjugate base of phenylboronic acid, resulting in a conjugation between the boronate moiety and the cis-diol of the sugar. This conjugation forms a boronate ring and will only occur under basic conditions.46,48,49 The reaction scheme is shown in Fig. 2A. This conjugation is expected to increase the polarizability of the sugar adduct to facilitate detection. To ensure that the reaction was occurring, glucose and phenylboronic acid were combined and the pH was adjusted to various levels. At each pH, the spontaneous Raman spectrum was acquired as shown in Fig. 2B. In more acidic conditions, only the peaks attributable to phenylboronic acid were evident, predominantly the peak at 1003 cm−1 which corresponds to the stretching of the phenyl ring.56 In basic conditions, however, the peaks corresponding to glucose at 880 cm−1 (ν(CC)), 1047 and 1090 cm−1 (ν(CC), ν(CO), β(COH)), 1284 cm−1 (τ(CH2)), and 1458 (δ(CH2)) became apparent.57 It should be noted that in this experiment, the concentration of glucose (10 mM) used was below the spontaneous limit of detection of glucose determined on the Snowy Ranger Raman spectrometer before dilution with acid or base, so these glucose peaks are only arising due to the conjugation reaction. The appearance of these bands indicates increased polarizability in the sugar–boronic acid product. Fig. 2C shows UV-vis spectra at various pH values that exhibit a shift in the absorbance peak from 265 nm to 255 nm. PBA is known to show decreased intensity at 266 nm, indicated by the vertical line in Fig. 2C, with increased pH,58 The drop in intensity observed in Fig. 2 arises in part from dilution and change in pH during the titration with base. The shift in peak position is attributed to the PBA–sugar conjugate and is used to indicate the reaction has occurred. The pH was adjusted by adding 0.1 M NaOH or 0.1 M HCl and measuring the resulting solution pH. Once a pH sufficient for conjugation is reached, the peak position and width does not change, but the intensity continues to decrease proportional to the diluted concentration as the solution is made further basic. Samples with a pH of 10 were used in the analysis. The PBA–sugar conjugate is observed to be stable at basic pH.
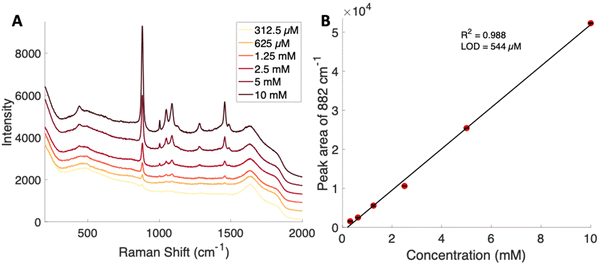
Concentration dependent Raman spectra were obtained by serial dilution of a glucose–PBA conjugate using a Snowy Range spectrometer. A calibration curve was generated using the peak area of the band at 882 cm−1 for each concentration. The spontaneous Raman limit of detection for this glucose–PBA conjugate was determined to be 544 μM from the calibration curve shown in Fig. 3. The limit of detection is two orders of magnitude lower, relative to glucose, and is consistent with the appearance of peaks with pH in Fig. 2B.
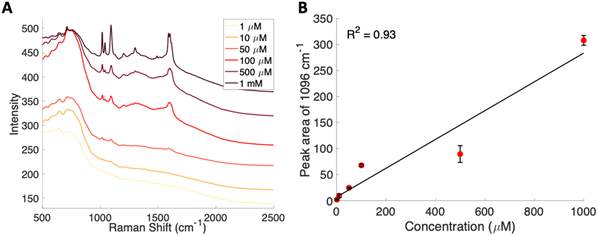
To further lower the limit of detection, SERS was used to analyze the glucose–PBA conjugate. Solutions of this glucose–PBA conjugate solution were flowed over a nanostructured silver substrate in a sheath flow cell using a syringe pump to determine a detection limit in flow. Analysis in flow would provide a path to incorporation with chemical separations and minimize sample pretreatement.51,59 The spectra for each concentration are shown in Fig. 4A, and a calibration curve created using the peak area of the band at 1096 cm−1 associated with ν(CC), ν(CO), β(COH)57 is shown in Fig. 4B. A linear fit to all concentrations used indicates a SERS limit of detection of 377 μM for glucose–PBA in flow; however, the data shows a nonlinear response above 100 μM suggesting saturation of the surface. Looking at the spectra and using the data points in the low concentration regime (below 100 μM) we obtain a limit of detection closer to 30 μM, which is consistent with our data.
The observed limit of detection is about an order of magnitude larger than what has been observed in previous studies.20 It has been shown that interaction with the SERS substrate is key for detection.60 The added phenyl-boronate functional groups appear to increase the polarizability of the analyte; however, there does not appear to be significant interaction with the SERS substrate. This limited interaction may explain the relatively high limit of detection for a SERS experiment. Future studies with modified SERS substrates20,61,62 may further decrease the limit of the detection for these glycan–PBA conjugates.
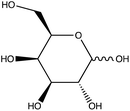
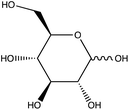
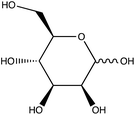
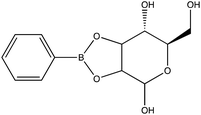
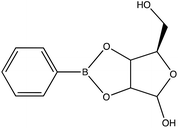
To assess the ability to discriminate between different glycans, we repeated the conjugation reaction with phenylboronic acid using arabinose, fructose, galactose, mannose, and ribose, all of which are monosaccharides that have cis-diols. The structures of these monosaccharides as well as their structures post conjugation are shown in Table 1. 10 mM samples of the conjugated sugars were flowed over a nanostructured silver substrate in a sheath flow cell using a syringe pump and spectra were collected. The substrate and flow cell were rinsed with water in between each sample. These spectra are shown in Fig. 5A. The observed spectra all contain similar peaks, but the relative peak intensities at 988 cm−1, 1033 cm−1, and 1073 cm−1 (β(CCC))56 differ for each sugar. The spectrum of PBA flowing over a surface can be found in Fig. S3.† PCA (Fig. 5B) as well as K-nearest neighbor hierarchal cluster analysis (HCA) (Fig. 6) were used to distinguish between the observed SERS spectrum of each type of sugar, with distinct clusters arising for each monosaccharide. PCA was able to reduce the data to 2 components that account for 99.9% of the spectral variance, and HCA shows each monosaccharide clustering into its own unique branch. The component spectra of the PCA can be found in Fig. S2.† This ability to distinguish between sugars in flow further supports possible future applications in conjunction with liquid chromatography for separation and detection of glycans in more complex samples.20
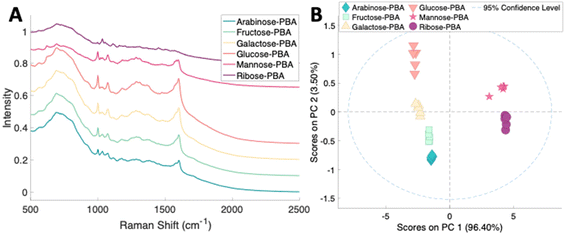 | ||
| Fig. 5 (A) Normalized SERS spectra of 10 mM sugars conjugated to PBA flowing over a substrate. The spectra are offset for clarity. (B) 2 component PCA scores plot of sugars conjugated with PBA. | ||
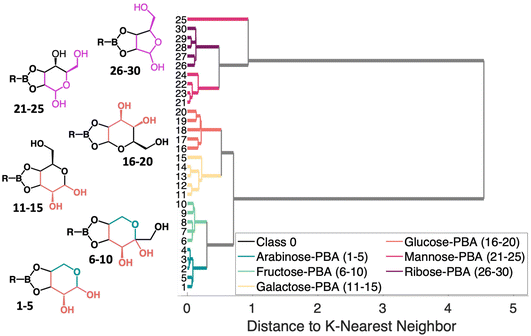
The HCA dendrogram for the PCA–sugar conjugates, shown in Fig. 6 shows patterns regarding structural moieties and the nature of the clusters formed. Two distinct branches first arise that correlate with the location of OH groups in relation to the boronate ring. When there are two hydroxyls next to the boronate ring, the molecules fall into one cluster. This is indicated by the orange coloring (samples 1–20) in the molecules shown. That cluster then branches into two, seemingly dependent upon the location of the oxygen in the sugar's ring. This difference is shown in arabinose and fructose and is indicated by the teal coloring (samples 1–10) in the molecule. The second cluster that arises has, when moving counter-clockwise from the boronate ring, a hydroxyl, the ring embedded oxygen, and then the hydroxymethyl. Though the rings have different numbers of carbon atoms, the moiety shown in pink in the figure (samples 21–30), is retained. The changes in structure provide a rational explanation for clustering of the SERS spectra.
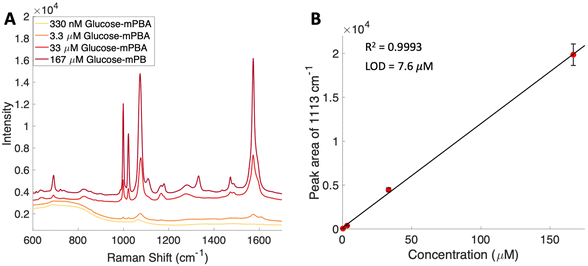
To attempt to lower detection limits further, glucose was then conjugated to a different molecule, 4-mercaptophenylboronic acid (mPBA). mPBA has a sulfhydryl group para to the boronic acid substituent that allows the sugar conjugate to bind to the silver substrate in a self-assembled monolayer instead of transiently adsorbing to the surface. While this method produces stronger interactions to the surface, it does require each sample to be prepared on a fresh substrate. The substrates were functionalized with various concentrations of the glucose–mPBA conjugate and dried before they were mapped using a Renishaw Raman microscope. Average spectra from 4 Raman maps, 400 total spectra, are shown in Fig. 7A, and a calibration curve created using the peak area of 1113 cm−1 (β(CH2))45 shown in Fig. 7B. The SERS limit of detection for glucose–mPBA bound to a substrate was found to be 7.6 μM. This limit of detection is closer to prior reports of phosphorylated sugars detected in flow over a functionalized substrate,20 which further implicates the importance of an interaction with the surface for trace SERS detection. Using the sugar residues on the spike protein as a model again, to reach this detection limit in a 1 mL sample, only 21 μg of the spike protein would be needed. This means that approximately a 150 nM solution of protein would need to be obtained. This is also approaching the physiological concentration of the SARS-CoV-2 spike protein, which is in the picomolar range.63
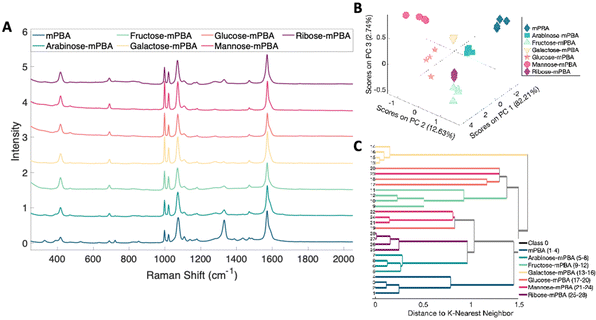
The ability to discriminate between glycan–mPBA constructs was further assessed by applying the same sample preparation to conjugate mPBA to arabinose, fructose, galactose, mannose, and ribose. 10 mM samples of each were used to create self-assembled monolayers on silver nanostructured substrates and Raman mapped. While the resulting spectra, shown in Fig. 8A, again look quite similar to one another, there are noticeable relative peak intensity changes at 690 cm−1 (β(CC)), 997 cm−1 (β(CCC)), 1020 cm−1 (β(CH)), 1070 cm−1 (β(CCC) + ν(CS)), and 1329 cm−1 (ν(BO)).45 The spectral variance was reduced to three components that accounted for 97.5% of the variance in the data. Plotting the data from each construct in a PCA scores plot (Fig. 8B) showed the subtle spectral changes still produced unique clusters for each sugar. PCA loadings can be found in Fig. S4.† Using K-nearest neighbor HCA (Fig. 8C), again each monosaccharide separates into its own unique branch. Using these methods it is possible to tell the difference between the spectrum of each sugar structure despite the isomeric similarities.
The results show that arabinose, fructose, glucose, galactose, mannose, and ribose can all be detected and distinguished using SERS and chemometric analysis. The same peaks appear to arise for each of the conjugates, but each sugar orients itself differently onto the PBA or mPBA due to the location of the cis-diol. The differences in the relative intensities of the peaks are likely due to the different orientation of the sugars on the more Raman active portion of the molecule – the phenyl ring and the orientation of the sugars relative to the substrate surface. The small differences in bond vibrations and distance from the bond to the substrate can lead to changes in the SERS enhancement, and thus the characteristic spectrum. The similarity in the peaks may complicate the analysis of sugar mixtures using our PBA–sugar conjugation strategy. It may be difficult to characterize real samples consisting of an ensemble mixture of the components at once, and a chemical separation step is likely needed to first ensure that each monosaccharide would be identified individually through comparison of the SERS data with previously established multivariate models.
Conclusion
Monosaccharides conjugated to boronic acids have been studied using SERS and chemometric methods. The Raman limit of detection for monosaccharides has been decreased using SERS and conjugation to phenylboronic acid and 4-mercaptophenylboronic acid. It is shown that sugars conjugated to phenylboronic acid can be distinguished in flow by SERS with a limit of detection of 30 μM. Sugars conjugated to 4-mercaptophenylboronic acid can also be distinguished in static Raman mapping experiments with a limit of detection of 7.6 μM. These results give rise to a new method that can be used to probe the glycome with minimal sample prep, rapid detection, and simple data treatment. This method also has the possibility to pair well with liquid chromatography for separation and SERS detection of glycans in flow from more complex matrices.Conflicts of interest
There are no conflicts to declare.Acknowledgements
The authors acknowledge support from an award by the National Institutes of Health, National Institute of General Medical Sciences, R21-GM140382.References
- M. Dashty, Clin. Biochem., 2013, 46, 1339–1352 CrossRef CAS PubMed.
- G. Duan and D. Walther, PLoS Comput. Biol., 2015, 11, e1004049–e1004049 CrossRef PubMed.
- E. A. Ponomarenko, E. V. Poverennaya, E. V. Ilgisonis, M. A. Pyatnitskiy, A. T. Kopylov, V. G. Zgoda, A. V. Lisitsa and A. I. Archakov, Int. J. Anal. Chem., 2016, 2016, 7436849–7436849 Search PubMed.
- S. Nie, A. Lo, J. Wu, J. Zhu, Z. Tan, D. M. Simeone, M. A. Anderson, K. A. Shedden, M. T. Ruffin and D. M. Lubman, J. Proteome Res., 2014, 13, 1873–1884 CrossRef CAS PubMed.
- K. Chandler and R. Goldman, Mol. Cell. Proteomics, 2013, 12, 836–845 CrossRef CAS PubMed.
- R. B. M. Landewé, J. G. A. Houbiers, F. Van den Bosch, J. t. Hout, P. C. P. M. Verschueren, J. H. Meijerink, F. H. J. van den Hoogen, B. A. Masek, G. A. W. Bruyn, J. M. G. W. Wouters, A. E. Voskuyl, J. M. van Laar, J. J. W. Bijlsma, D. M. F. M. van der Heijde, F. C. Breedveld, L. B. A. van de Putte, A. M. M. Miltenburg and F. de Keyser, Ann. Rheum. Dis., 2010, 69, 1655 CrossRef PubMed.
- P. C. Taylor, A. C. Adams, M. M. Hufford, I. de la Torre, K. Winthrop and R. L. Gottlieb, Nat. Rev. Immunol., 2021, 21, 382–393 CrossRef CAS PubMed.
- M. P. Campbell, L. Royle, C. M. Radcliffe, R. A. Dwek and P. M. Rudd, Bioinformatics, 2008, 24, 1214–1216 CrossRef CAS PubMed.
- T. M. Block, M. A. Comunale, M. Lowman, L. F. Steel, P. R. Romano, C. Fimmel, B. C. Tennant, W. T. London, A. A. Evans, B. S. Blumberg, R. A. Dwek, T. S. Mattu and A. S. Mehta, Proc. Natl. Acad. Sci. U. S. A., 2005, 102, 779–784 CrossRef CAS PubMed.
- Y. Wada, M. Tajiri and S. Yoshida, Anal. Chem., 2004, 76, 6560–6565 CrossRef CAS PubMed.
- S. C. Churms, J. Chromatogr. A, 1996, 720, 75–91 CrossRef CAS.
- C. Antonio, T. Larson, A. Gilday, I. Graham, E. Bergström and J. Thomas-Oates, Rapid Commun. Mass Spectrom., 2008, 22, 1399–1407 CrossRef CAS PubMed.
- C. D. Calvano, C. G. Zambonin and O. N. Jensen, J. Proteomics, 2008, 71, 304–317 CrossRef CAS PubMed.
- A. Planinc, J. Bones, B. Dejaegher, P. Van Antwerpen and C. Delporte, Anal. Chim. Acta, 2016, 921, 13–27 CrossRef CAS PubMed.
- B. L. Duivelshof, S. Denorme, K. Sandra, X. Liu, A. Beck, M. A. Lauber, D. Guillarme and V. D'Atri, Pharmaceutics, 2021, 13, 1744 CrossRef CAS PubMed.
- R. R. Townsend, M. R. Hardy and Y. C. Lee, Methods Enzymol., 1989, 179, 65–76 CAS.
- J. Zaia, Chem. Biol., 2008, 15, 881–892 CrossRef CAS PubMed.
- Q. Wu, J.-Y. Wang, D.-Q. Han and Z.-P. Yao, TrAC, Trends Anal. Chem., 2020, 124, 115801 CrossRef CAS.
- D. J. Xu, Q. Xia, J. J. Wang and P. P. Wang, Molecules, 2008, 13, 2408–2415 CrossRef CAS PubMed.
- A. H. Nguyen, J. M. Deutsch, L. Xiao and Z. D. Schultz, Anal. Chem., 2018, 90, 11062–11069 CrossRef CAS PubMed.
- L. Xiao, C. Wang, C. Dai, L. E. Littlepage, J. Li and Z. D. Schultz, Angew. Chem., Int. Ed., 2020, 59, 3439–3443 CrossRef CAS PubMed.
- N. C. Craig and D. A. Evans, J. Am. Chem. Soc., 1965, 87, 4223–4230 CrossRef CAS.
- J. Evans and H. Bernstein, Can. J. Chem., 1955, 33, 1171–1182 CrossRef CAS.
- K. Kneipp, Y. Wang, H. Kneipp, L. T. Perelman, I. Itzkan, R. R. Dasari and M. S. Feld, Phys. Rev. Lett., 1997, 78, 1667–1670 CrossRef CAS.
- S. Nie and S. R. Emory, Science, 1997, 275, 1102–1106 CrossRef CAS PubMed.
- J. A. Dieringer, K. L. Wustholz, D. J. Masiello, J. P. Camden, S. L. Kleinman, G. C. Schatz and R. P. Van Duyne, J. Am. Chem. Soc., 2009, 131, 849–854 CrossRef CAS PubMed.
- P. Negri, R. J. Flaherty, O. O. Dada and Z. D. Schultz, Chem. Commun., 2014, 50, 2707–2710 RSC.
- M. Ratkaj, T. Biljan and S. Miljanić, Appl. Spectrosc., 2012, 66, 1468–1474 CrossRef CAS PubMed.
- A. R. L. Marshall, J. Stokes, F. N. Viscomi, J. E. Proctor, J. Gierschner, J.-S. G. Bouillard and A. M. Adawi, Nanoscale, 2017, 9, 17415–17421 RSC.
- Q. Yu and G. Golden, Langmuir, 2007, 23, 8659–8662 CrossRef CAS PubMed.
- M. Dendisová-Vyškovská, A. Kokaislová, M. Ončák and P. Matějka, J. Mol. Struct., 2013, 1038, 19–28 CrossRef.
- A. G. Brolo, Z. Jiang and D. E. Irish, J. Electroanal. Chem., 2003, 547, 163–172 CrossRef CAS.
- A. Rupérez and J. J. Laserna, Anal. Chim. Acta, 1996, 335, 87–94 CrossRef.
- A. H. Nguyen, E. A. Peters and Z. D. Schultz, Rev. Anal. Chem., 2017, 36(4), 20160037 CAS.
- U. S. Dinish, F. C. Yaw, A. Agarwal and M. Olivo, Biosens. Bioelectron., 2011, 26, 1987–1992 CrossRef CAS PubMed.
- P. H. Arboleda and G. R. Loppnow, Anal. Chem., 2000, 72, 2093–2098 CrossRef CAS PubMed.
- K. E. Shafer-Peltier, C. L. Haynes, M. R. Glucksberg and R. P. Van Duyne, J. Am. Chem. Soc., 2003, 125, 588–593 CrossRef CAS PubMed.
- O. Lyandres, J. M. Yuen, N. C. Shah, R. P. VanDuyne, J. T. Walsh and M. R. Glucksberg, Diabetes Technol. Ther., 2008, 10, 257–265 CrossRef CAS PubMed.
- L. Krishnamoorthy and L. K. Mahal, ACS Chem. Biol., 2009, 4, 715–732 CrossRef CAS PubMed.
- E. Witkowska, D. Korsak, A. Kowalska, M. Księżopolska-Gocalska, J. Niedziółka-Jönsson, E. Roźniecka, W. Michałowicz, P. Albrycht, M. Podrażka, R. Hołyst, J. Waluk and A. Kamińska, Anal. Bioanal. Chem., 2017, 409, 1555–1567 CrossRef CAS PubMed.
- G. Das, F. Gentile, M. L. Coluccio, A. M. Perri, A. Nicastri, F. Mecarini, G. Cojoc, P. Candeloro, C. Liberale, F. De Angelis and E. Di Fabrizio, J. Mol. Struct., 2011, 993, 500–505 CrossRef CAS.
- R. Goodacre, D. Graham and K. Faulds, TrAC, Trends Anal. Chem., 2018, 102, 359–368 CrossRef CAS.
- A. K. Jain and R. C. Dubes, Algorithms for clustering data, Prentice-Hall, Inc., 1988 Search PubMed.
- S. D. Kügler, K. Polsterer and M. Hoecker, Astronomy & Astrophysics, 2015, 576, A132 Search PubMed.
- S. Li, Q. Zhou, W. Chu, W. Zhao and J. Zheng, Phys. Chem. Chem. Phys., 2015, 17, 17638–17645 RSC.
- C. Bromba, P. Carrie, J. K. W. Chui and T. M. Fyles, Supramol. Chem., 2009, 21, 81–88 CrossRef CAS.
- M. Elsherif, M. U. Hassan, A. K. Yetisen and H. Butt, ACS Nano, 2018, 12, 2283–2291 CrossRef CAS PubMed.
- J. P. Lorand and J. O. Edwards, J. Org. Chem., 1959, 24, 769–774 CrossRef CAS.
- G. Springsteen and B. Wang, Tetrahedron, 2002, 58, 5291–5300 CrossRef CAS.
- S. M. Asiala and Z. D. Schultz, Analyst, 2011, 136, 4472–4479 RSC.
- A. Nguyen and Z. D. Schultz, Analyst, 2016, 141, 3630–3635 RSC.
- P. Negri, K. T. Jacobs, O. O. Dada and Z. D. Schultz, Anal. Chem., 2013, 85, 10159–10166 CrossRef CAS PubMed.
- T. O’Haver, peakfit.m (Version 9.0.0.0), MATLAB Central File Exchange, 2018 Search PubMed.
- M. Sanda, L. Morrison and R. Goldman, Anal. Chem., 2021, 93, 2003–2009 CrossRef CAS PubMed.
- X. Gu, H. Wang, Z. D. Schultz and J. P. Camden, Anal. Chem., 2016, 88, 7191–7197 CrossRef CAS PubMed.
- N. Piergies, E. Proniewicz, Y. Ozaki, Y. Kim and L. M. Proniewicz, J. Phys. Chem. A, 2013, 117, 5693–5705 CrossRef CAS PubMed.
- M. Mathlouthi and D. Vinh Luu, Carbohydr. Res., 1980, 81, 203–212 CrossRef CAS.
- K. Kur-Kowalska, M. Przybyt and E. Miller, Biotechnol. Food Sci., 2014, 78(2), 101–110 Search PubMed.
- A. Subaihi, D. K. Trivedi, K. A. Hollywood, J. Bluett, Y. Xu, H. Muhamadali, D. I. Ellis and R. Goodacre, Anal. Chem., 2017, 89, 6702–6709 CrossRef CAS PubMed.
- S. M. Asiala and Z. D. Schultz, Anal. Chem., 2014, 86, 2625–2632 CrossRef CAS PubMed.
- V. M. Szlag, M. J. Styles, L. R. Madison, A. R. Campos, B. Wagh, D. Sprouse, G. C. Schatz, T. M. Reineke and C. L. Haynes, ACS Sens., 2016, 1, 842–846 CrossRef CAS.
- T. D. Payne, S. J. Klawa, T. Jian, S. H. Kim, M. J. Papanikolas, R. Freeman and Z. D. Schultz, ACS Sens., 2021, 6, 3436–3444 CrossRef CAS PubMed.
- F. Pistollato, M. Petrillo, L. A. Clerbaux, G. Leoni, J. Ponti, A. Bogni, C. Brogna, S. Cristoni, R. Sanges, E. Mendoza-de Gyves, M. Fabbri, M. Querci, H. Soares, A. Munoz, M. Whelan and G. Van de Eede, Reprod. Toxicol., 2022, 111, 34–48 CrossRef PubMed.
Footnote |
| † Electronic supplementary information (ESI) available: Fig. S1–S4 and Table S1 showing additional details related to results reported are available online. See DOI: https://doi.org/10.1039/d2an01762h |
| This journal is © The Royal Society of Chemistry 2023 |

