Quantitative fat analysis of milk using a line-illumination spatially offset Raman probe through carton packaging†
Si Won
Song
,
Ye Chan
Jeong
,
Chan Ryang
Park
and
Hyung Min
Kim
 *
*
Department of Chemistry, Kookmin University, 77 Jeongneung-ro, Seongbuk-gu, Seoul 02707, Republic of Korea. E-mail: hyungkim@kookmin.ac.kr
First published on 21st June 2023
Abstract
Milk is a popular dairy product that provides various nutrients, but consuming too much saturated fat from milk can increase the risk of diseases and obesity. Adulterated milk containing toxic substances can be harmful to human health, and toxic substances can enter the milk at any stage of production. Thus, analytical technologies for detecting various nutrients and harmful substances inside the package are a key requisite for the assessment of dairy products on the market. In this study, we developed a Raman spectroscopic method as a quantitative tool for assessing the milk fat composition and detecting toxic chemicals in packaged milk. Using a line-illumination deep Raman system based on both conventional optics and novel optical fibers, we could quantitatively discriminate the Raman signals of milk fat from those of the packaging materials. Finally, the present system allowed the detection of melamine in adulterated milk (employed as a toxicity model) using a multiple-depth fiber probe.
Milk is consumed as a major source of energy and nutrients in many countries, and is mainly composed of carbohydrates, proteins, fats, vitamins, and minerals.1 It has been reported that the excessive intake of fats from milk causes diseases such as hypertension, diabetes, obesity/overweight, cardiovascular diseases, and hyperlipidemia.2–4 Moreover, the consumption of saturated fatty acids and industrial trans fats potentially increases the risk of cardiovascular diseases.5 To prevent cardiovascular diseases, the World Health Organization and the governments of individual countries across the globe recommend reducing the saturated fat intake to less than 10% of the total energy intake.6–8 Therefore, the fat content in off-the-shelf milk products is an important parameter for both producers and consumers, and a rapid and non-destructive method is required to ensure the quality of milk products in the market. Additionally, noninvasive methods ensure that drinks are free from toxic chemicals that might have been added intentionally or unintentionally during the production steps. For instance, a dairy company in China adulterated milk with melamine to artificially increase the nitrogen content in formulas or other dairy products, resulting in the death of eight children and the hospitalization of 300
![[thin space (1/6-em)]](https://www.rsc.org/images/entities/char_2009.gif) 000.9
000.9
Typical methods for fat analysis in dairy products include gas and liquid chromatography combined with mass spectrometry; these methods can accurately measure the fat composition of samples down to the lowest limit of detection (approximately 0.5 μg ml−1),10 but they are not suitable for noninvasive detection or in situ measurements because of the time-consuming sample preparation procedure and the limited portability of the instruments. Near- or mid-infrared absorption spectroscopy has been developed for analyzing non-packaged milk, providing a fast, simple, highly specific, and high-sensitivity detection;11,12 however, this approach suffers from limitations due to the interfering absorption of water in milk.13 Raman spectroscopy emerged as an effective analytical technique because it is free from water interference and requires no sample preparation. This technique has been employed in the dairy industry for the quantification of constituents of milk powder,14 the characterization of bovine milk fat globules,15 and the determination of unsaturated fat levels in milk.16 In addition, Raman spectroscopy has promising potential for the detection of other additives in milk because it enables qualitative analysis in the spectral fingerprint region.
Commercial milk products are packaged in cartons or glass/plastic bottles for delaying natural deterioration caused by environmental factors (oxygen, light, moisture, etc.), preserving taste and flavor, and facilitating storage and transportation.17 Previously, glass was the main packaging material used for milk; however, cartons and plastic bottles have been increasingly employed to block ambient light that would pass through common glass.18 The carton, consisting of extruded paperboard, is thinly coated with polyethylene (PE) on both sides, typically in the form of PE/paperboard/PE layers. From the viewpoint of Raman scattering, the Raman background signals from the coated carton are the main obstacle to overcome in the noninvasive analysis of milk compositions; this is because the PE coating layer produces strong background signals, extensively overlapping with those of milk fat. Therefore, a novel method is required to reduce spectroscopic interferences from the carton containing the milk solution.
Although the detection capability of conventional Raman spectroscopy for food analysis has been demonstrated, the optical opacity and strong Raman background of milk cartons hinder the in situ analysis of dairy products on the market, taking into account the weak Raman signals from food nutrients subjected to quantitative analysis. Spatially Offset Raman Spectroscopy (SORS) is a noninvasive method that suppresses Raman interferences from the surface layer by adjusting the distance (offset) between the excitation laser and the detection position.19 The SORS technique has been reported to be effective for identifying chemicals and pharmaceutical drugs in packaged form,20 and also for the noninvasive monitoring of other dairy products such as margarine in butter.21 In the case of milk contained in cartons, the weak intensity of milk fats present in low concentrations hinders their in situ monitoring, and the system performance should be improved. The key to enabling high-sensitivity detection of milk fats is to increase the total power while maintaining the power density, as well as to develop a flexible system for in situ monitoring.
In this study, we developed a highly efficient Raman system for the simultaneous detection of milk fats and toxic chemicals in cartons. To enhance the detection sensitivity and minimize potential photodamage or denaturation of dairy products, we utilized a line-shaped Raman excitation signal collection system. This approach allowed us to acquire sufficient Raman signals within a short period. Additionally, in order to facilitate field applications, we developed a multiline optical probe in addition to the table-top system. The novel probe incorporated multiple linear bundles, enabling the acquisition of Raman spectra at four discrete depths in a single measurement. This design significantly enhanced the portability and flexibility of our system. Our analytical system was evaluated on different types of cartons, and the results showed that the relative composition of milk fat could be determined at distant offsets.
Experimental section
Microscopic Raman system
A conventional micro-Raman system was built using a 785 nm diode laser (LML-785.0, PL-LD, USA), an upright microscope (BX53, Olympus, Japan), a spectrograph (SH-303i, Andor, UK), and a charge-coupled device (CCD, iDus 420, Andor, UK). The laser beam was directly guided to the sample surface by optical mirrors, and the Raman scattering radiation was collected through a 10× objective lens, using a long-pass filter (LP02-785RE-25, Semrock, USA) to remove Rayleigh scattering. Each spectrum was obtained with 3 s exposure, and a total of 10 spectra were averaged to improve the signal-to-noise ratio. The baseline of the Raman spectra was subtracted using the asymmetric least squares (AsLS) algorithm.Line illumination SORS system
The present Raman system for noninvasive monitoring with sub-centimeter linear sampling has been reported elsewhere.22 A line-illumination Raman system was developed for the in situ analysis of milk fat composition, taking advantage of bulk sampling to improve the Raman collection efficiency. In our system, a high-power 785 nm laser irradiated the sample surface at an incidence angle of 45°, forming a line shape via a cylindrical lens. The laser illumination area was ∼3.7 × 0.57 mm, as determined using a beam profiler (LBP02-VIS, Newport, USA, Fig. S1†). During the experiments, the laser power at the surface of milk cartons was maintained at 800 mW. The line-shaped outgoing Raman scattering was collected and then focused on a spectrograph (Acton SP2300, Prince-ton Instruments, USA) via a couple of lenses (Φ = 2 in.) and a long-pass filter (LP02-785RU-50, Semrock, USA). The one-dimensional hyperspectral Raman image was projected onto a CCD detector (PIXIS 400BR, Princeton Instruments, USA), and the full spectrum was binned along the vertical direction of the sensor. A motorized actuator (Z825B, Thorlabs, USA) was used to adjust the laser position with respect to the optical axis of the Raman collection through lab-programmed software (LabView, National Instruments, USA). Each Raman spectrum was obtained with an exposure time of 3 or 10 s and accumulated 10 times for averaging; the baseline of the SORS spectra was corrected using the AsLS algorithm.Multiple-depth line-mapping probe
A multiline array fiber probe designed by us and manufactured by a fiber optic company (FiberTech Optica, Canada) was used for the collection of Raman photons resurfacing in line-shape at multiple depths in a single measurement. The probe, a Y-branched bundle of fibers, possessed three adapting blocks made of brass, which were designated as the Raman probing, laser, and signal ends. The probing end included five linear arrays of seven fiber cores in a rectangular volume. The left-most array was used for laser excitation, configured to be separated from the others, and arranged in a centered circular array at the opposite end of the cylindrical rod (the laser end). The other four linear bundles were arranged in a row at the probing end, at intervals of 1, 3, 5, and 7 mm, corresponding to the spatial offsets or multiple depths. All the fiber cores of four bundles were separated from the excitation branch and finally arranged in line at the opposite end (collection side) to transfer the collected Raman photons to the spectrograph. The diameter of all cores assembled in the probe was 200 μm. Additionally, a laser line and a long-pass filter were attached to the excitation and collection arrays, respectively, on the probing side. The laser power irradiating the surface of the probing side was maintained at 300 mW. The Raman photons originating from multiple depths were transmitted to the spectrograph in a linear array of 28 cores, projected onto a CCD detector, and reconstructed into a multiple-depth image with four sets of spectra separated at 1, 3, 5, and 7 mm offsets; additional details are provided in Fig. S2.†Dairy products and melamine
Commercial milk products such as fat-free (∼0% fat) and whole (3.4% fat) milk were purchased from Maeil Dairies Co., Ltd (Republic of Korea). Table 1 shows the nutrient compositions of the fat-free and whole milk samples used in the analysis. As the milk products could be purchased in 0 and 3.4% concentrations, we mixed them in various volume ratios to prepare samples with different fat concentrations; a milk carton was emptied, washed with distilled water, dried, and used as the measuring container. The premixed milk was transferred into the empty container for measurement, and two types of cartons were evaluated during the experiment. As a toxicity model, melamine was purchased from Merck Co. (USA) and dissolved at a concentration of ∼0.48 wt%.| Nutrition facts | ||
|---|---|---|
| Serving size 200 ml | ||
| Whole milk | Fat-free milk | |
| Calories | 120 kcal | 60 kcal |
| Total fat | 6.8 g | 0 g |
| Saturated fat | 4 g | 0 g |
| Trans fat | Less than 0.5 g | 0 g |
| Cholesterol | 25 mg | Less than 5 mg |
| Carbohydrate | 9 g | 9 g |
| Sugar | 9 g | 9 g |
| Protein | 6 g | 6 g |
| Sodium | 100 mg | 100 mg |
| Calcium | 200 mg | 200 mg |
Results and discussion
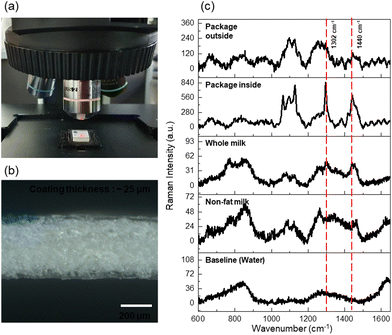
To quantify the fat contents in milk products, we recorded the Raman spectra of fresh samples using the present micro-Raman system, as shown in Fig. 1(a). In the measurements, the excitation laser was guided directly on top of the milk solution contained in a cuvette without the lid off. Prior to the non-invasive milk measurement, we obtained the Raman spectrum of the container alone as the background. Milk cartons, among the most popular packages for milk, are coated with a polymer on both sides, in order to protect/isolate the contents from ambient air and chemical environments. PE-coated paperboard is the typical constituent of milk cartons;17 microscopic photographs of the structure and thickness of each layer of a carton are shown in Fig. 1(b). Both sides of the paperboard layer in the middle of the carton were coated with PE, and the cartons had a typical PE/paperboard/PE layer structure. The average thicknesses of the paperboard and PE coating layers were found to be 370–380 and 25–30 μm, respectively, as determined from the photograph.Fig. 1(c) (from top to bottom) shows the Raman spectra of the carton paperboard and PE coating, as well as those of whole and fat-free milk samples and of the optical background. The spectrum of the PE carton coating showed intense Raman signals at 1063, 1129, 1296, and 1416–1463 cm−1, assigned to asymmetric (νCC,asym)/symmetric (νCC,sym) stretching, twisting (δCH2), and methylene bending (δCH2) vibrations corresponding to the typical Raman signature of neat PE.22 Sharp Raman peaks were hardly observed while adjusting the focus along the vertical direction. The Raman spectrum of whole milk showed broad bands at 700–900 (νCC, νCO, δCH3,rock, and various amino acid-specific modes), 1265 (amide III), 1302 (δCH2,twisting), and 1440 (δCH2,scissoring) cm−1.14 The Raman peaks at 1302 (δCH2,twisting) and 1440 (δCH2,scissoring) cm−1 showed significant intensities compared to the spectrum of nonfat milk; these signals are considered quantitative indicators of the fat composition. The positions of the main Raman peaks corresponding to milk fats completely overlapped with those of the PE coatings; hence, it is essential to suppress the signals from the PE coating in order to quantitatively determine the Raman signals from milk fats.
As shown in Fig. 1, the Raman intensity of the milk products was relatively weak compared to that of the PE coatings. The noninvasive and quantitative measurement of nutrient contents in commercial milk products requires a more sensitive approach for enhancing the Raman collection efficiency, taking into account the opacity of the package and the strong background. Therefore, we introduced the present line-illumination Raman system, providing high sensitivity and depth-resolved Raman signals. The intensity of spontaneous Raman scattering is proportional to the intensity of the excitation light in the first order; hence, the analysis of a weakly scattering material such as milk requires a high-power light source or a long detection time. Our line-illumination Raman system (illustrated in Fig. S3†) was designed to reduce the power density of the excitation laser in the form of a line beam, while maintaining sufficient power to observe the weak Raman scattering of milk and extend the observation area.
SORS is a representative deep Raman method developed to obtain signals from the internal regions of materials, reducing the spectroscopic interference from external layers by adjusting the distance between the excitation laser and the detection position. Fig. 2(a) shows a schematic diagram of the optical paths of incident and scattered photons during measurement of milk products contained in a carton. The system can collect the Raman photons generated in the milk solution because laser photons simultaneously propagate horizontally and penetrate vertically, on average. Fig. 2(b) shows the hypothetical simulated spectra corresponding to different fat concentrations in milk. A larger offset corresponds to a deeper position in the statistical distribution. In the measurements, the fat concentration and the spatial offset affect the magnitude of the Raman scattering from the carton-contained milk, and at the large offset, the Raman signals originating from the milk inside are expected to become stronger than the background Raman signals from the carton.
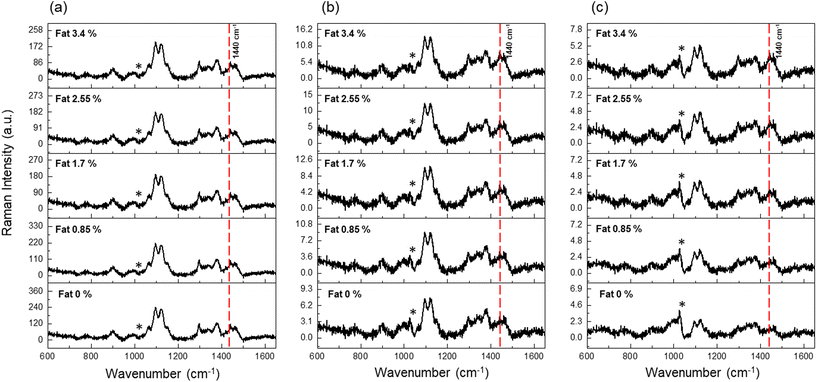
Five milk samples with different fat contents (0, 0.85, 1.7, 2.6, and 3.4%) were prepared by mixing fat-free and whole milk in different volume ratios (Table S1†), assuming that the fat-free milk contained 0% fat, as guaranteed by the manufacturer. The incident position of the excitation laser was varied from 0 to 5 mm at 1 mm intervals, and the maximum scan length of the system was 15 mm. Fig. 3(a)–(c) show the SORS spectra of five milk samples at 0, 2, and 4 mm offsets; other spectra recorded at 1, 3, and 5 mm are shown in the ESI (Fig. S4†). We investigated the relative intensity changes of fat signals (1302 and 1440 cm−1) with respect to the offset. The overall Raman intensities decreased with increasing offset because of the reduced collection efficiency in the radial direction, and the decrease rate changed depending on the depth of scattering. The Raman intensity of the surface coatings decreased rapidly, whereas that of the inner solution declined gradually as a function of the spatial offset; the relative intensity ratio between the PE coating and milk fat was measured to quantify the fat contents.
At zero offset, the two indicator peaks at 1302 (δCH2, twisting) and 1440 (δCH2,scissor) cm−1 are conspicuous, but their relative intensities with respect to those of the other peaks remained constant for various fat concentrations. Thus, we can speculate that all Raman peaks originated not from milk fat, but from the PE coating, considering that the Raman photons were mainly emitted from the surface. Each Raman spectrum was measured 10 times with an exposure time of 10 s, and the same procedure was repeated 5 times for averaging. The broad Raman band marked with an asterisk at 1026 cm−1 was assigned to the glass materials making up the optical components.
Even at a large offset, it is difficult to completely remove the Raman signals originating from the container because incident (excitation) photons undergo multiple scattering events inside the milk solution and resurface to generate Raman photons at the outer layer.23 At 4 mm offset, the Raman spectra in Fig. 3(c) clearly show a linear concentration dependence of the peak intensities at 1302 and 1440 cm−1. The intensities of these two peaks increased proportionally to the fat concentration at 4 mm offset, unlike those of the peaks corresponding to the PE coating. Based on this result, we can conclude that the present noninvasive system can be used to determine the origin of Raman peaks with identical energies, even though the peaks completely overlap in the spectrum.
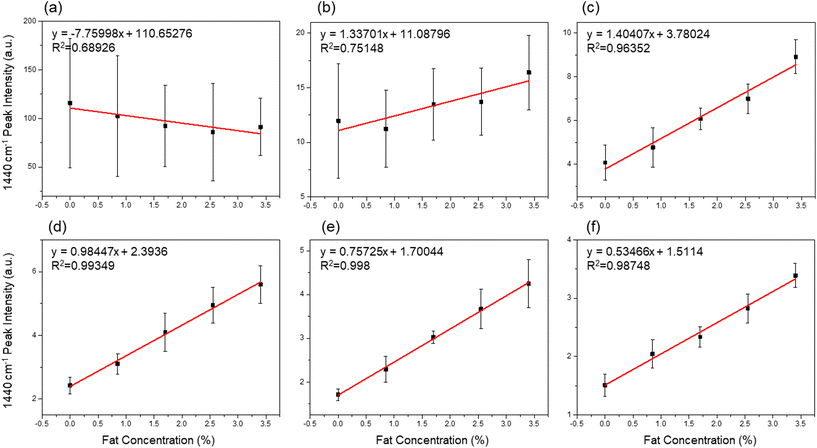
Obviously, the spatial offset determines the ratio of inner to outer Raman intensities. Generally, a larger offset leads to a better relative ratio, but is accompanied by a decrease in absolute intensity; thus, the optimal offset needs to be determined. Fig. 4(a–f) shows a plot of the 1440 cm−1 intensity vs. fat concentration at offsets of 0, 1, 2, 3, 4, and 5 mm. The plots in Fig. 4(a) and (b), corresponding to 0 and 1 mm offsets, respectively, do not show any correlation between the Raman intensity and the fat concentration in milk. The Raman signal of the PE layer dominated over that of the fat contents when the signals from the surface were measured at a small offset. On the other hand, the same plots for 2 to 5 mm offsets revealed an almost linear relationship with the fat concentration, as shown in Fig. 4(c)–(f). When the measurement position was shifted to a higher depth, the background signal from the carton was reduced, enabling spectroscopic quantification; however, the reliability of the quantification decreased because the Raman collection efficiency became markedly lower at offsets above 5 mm.
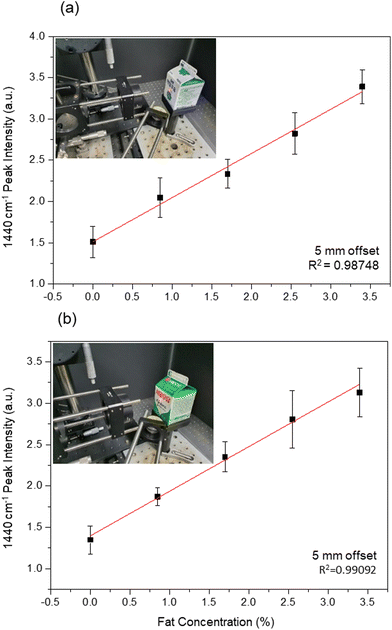
The reproducibility of the line-illumination system was evaluated for two different types of cartons produced by two different companies. The coating thicknesses of the two cartons were 25 (blue carton) and 22 (green carton) μm; a microscopy image of the cross-section of the green carton is shown in Fig. S5.† Raman spectra for milk contained in the two cartons were obtained at offsets ranging from 0 to 5 mm. The insets in Fig. 5 show photographs of the blue and green cartons. For milk in the blue carton, the intensity of the 1440 cm−1 peaks obtained at 5 mm offset is plotted as a function of fat concentration in Fig. 5(a). The intensity of the fat indicator peak at 1440 cm−1 increased linearly with fat concentration, with an R2 value of 0.98748. Fig. 5(b) shows the same plot for the green carton milk, giving a similar R2 value of 0.99092 and the slopes of the quantification curves measured in both cartons are almost similar. Therefore, we conclude that the fat composition of milk packaged in the same type of carton can be determined quantitatively using our deep Raman method, without opening the carton.
Noninvasive methods are also essential for detecting toxic substances, spoilage, and artificial additives in food, owing to the peculiar Raman spectral fingerprint of the materials. For instance, in the past some dairy companies added melamine to milk solutions to artificially increase their protein content.24 Therefore, besides the quantitative assessment of fat contents, we applied our system to monitor toxic chemicals in carton milk. We prepared melamine-containing milk to evaluate the ability of the line SORS system to detect toxic substances deliberately added to milk. A 0.24 wt% solution was prepared by adding 0.5 g of melamine to 200 ml of whole milk. Fig. 6(a) shows the Raman spectrum of melamine solution, displaying sharp peaks at 674 and 982 cm−1. The 674 cm−1 peak, which does not overlap with any Raman band of the carton, was assigned to the ring-breathing II mode of the C atoms, and designated as a melamine indicator.25
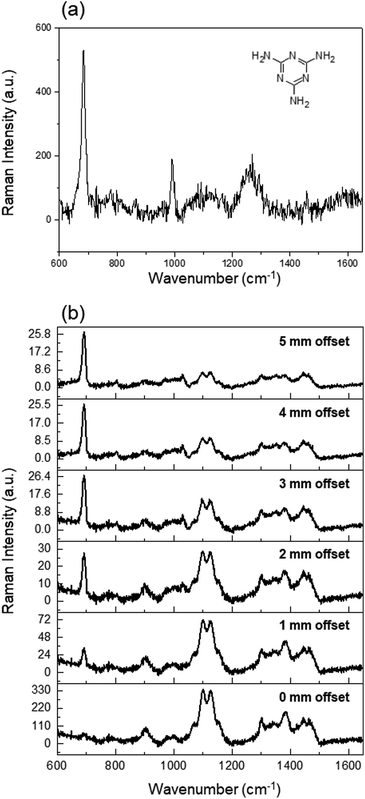 | ||
| Fig. 6 (a) Raman spectrum of melamine solution. (b) SORS spectra of milk samples containing 0.24 wt% melamine. | ||
Fig. 6(b) shows the depth-resolved Raman spectra of adulterated samples acquired at offsets from 0 to 5 mm. A milk solution with dissolved melamine was placed in the blue carton, and the Raman spectrum was obtained. At 0 mm offset, the Raman peak of PE was clearly visible, but that of melamine was not observed because the Raman signals originated from the surface. As the offset increased, the Raman peaks of melamine (674 and 982 cm−1) and milk fat (1440 cm−1) became clearly visible and their intensity increased with respect to that of the Raman peak of the PE coating. These results suggest that quantitative analysis of fat content can be conducted simultaneously with the detection of artificial additives in milk products.
In addition to optical systems for static measurements, the development of new probes is necessary for flexible field monitoring; therefore, we designed a novel fiber probe for extended Raman observation. To apply linear illumination and collection in a single-fiber optic probe, multiple linear bundles were aligned in a probe structure, as shown in Fig. 7. The multiple-depth probe consisted of Raman probing, laser (in), and signal (out) branches; Fig. 7(a) shows a photograph and a schematic diagram of the rectangular probing end. The latter included five linear arrays of seven fiber cores: the leftmost array was used for laser excitation and the other four were reserved for the delivery of Raman signals. The arrays for detection were displaced 1, 3, 5, and 7 mm apart from the leftmost excitation array. All cores had a size of 200 μm; laser-cleanup and long-pass filters were attached on top of the excitation and detection arrays, respectively, to suppress the background from silica making up the core/cladding. Fig. 7(b) shows the optical design of the signal end block: all 28 fibers originated from the detection cores in the probing end and were aligned in a linear shape. This ending block faced the input slit of the spectrograph, and the Raman photons collected at four different offsets were projected onto a CCD camera at once. All the positions of the fiber cores were mapped by the manufacturer, and we confirmed them by light transmission measurements. The Raman spectra corresponding to the individual depths (offsets) were segmented along the vertical direction of the detector; the spectra at 1, 3, 5, and 7 mm offsets were reconstructed by binning and used for quantitative analysis. To improve the signal-to-noise ratio, the Raman spectra were measured 10 times with an exposure time of 10 s (total acquisition time: 100 s).
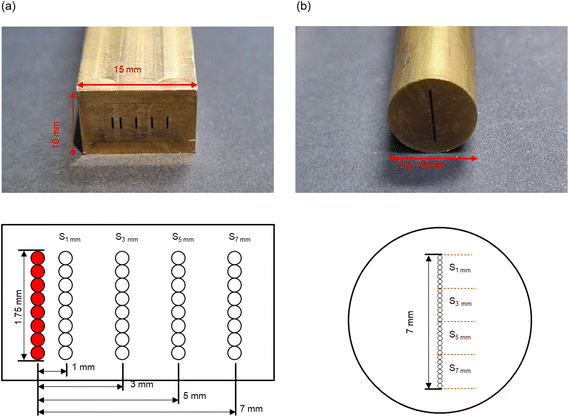 | ||
| Fig. 7 Photographs and schematic diagrams of (a) probing and (b) detecting branches of the multiple-depth probe. | ||
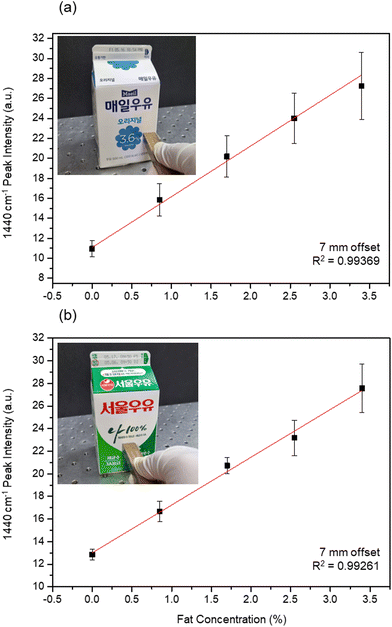
The deep detection efficiency of our multiple-depth Raman method on individual carton milk samples was evaluated as shown in Fig. 8. Milk samples with different fat concentrations were prepared by blending whole and fat-free milk. Fig. 8(a) and (b) show the photographs of the hand-held probe during noninvasive milk analysis, along with the relationship between the intensity of the 1440 cm−1 peak (designated as fat indicator) and the fat concentration recorded through the 7 mm offset array. During the noninvasive monitoring, the front face of the probing end was in direct contact with the milk package. The 1440 cm−1 intensity measured for the blue and green cartons exhibited an almost linear relationship with the fat concentration, with R2 values of 0.99169 and 0.99261, respectively. The two slopes of quantification curves of Fig. 8 are 5.07 and 4.23. Due to the presence of Raman background signals from milk and PE, the linear curve in our study does not cross zero. As a result, the plot exhibits a non-zero offset. The discrepancy between the cartons and methods would be reduced when we use relative intensity. For instance, we adjusted the plot and show in parallel the relative intensity (I1440/I1063) in the ESI (Fig. S6†). We anticipate that by achieving precise control of the movement of the fiber bundle, including both the angle and distance, we can further minimize the disparity between the blue carton and green carton. Similar to the line-illumination Raman system, the multi-offset line probe enables the quantitative analysis of the biological and chemical composition of milk samples contained in unopened packages. Therefore, we expect that the flexibility of fiber-based probes will pave the way for quick and immediate analysis of dairy products, with clear benefits for both consumers and suppliers.
Conclusions
In this work, the fat and toxic chemical contents in commercial milk products were measured using a noninvasive technique for the first time. We developed an optical system for the quantitative analysis of milk fat in unopened milk cartons. Raman interferences from the packaging material were removed by adjusting the Raman collection depth inside the milk carton. Quantitative analyses of fat and toxic chemical contents in milk containers were conducted in a noninvasive fashion. A multiple-depth line probe was also developed to enable flexible monitoring of off-the-shelf milk products. Our method offers the advantage of preserving the integrity of the milk sample. By avoiding the need to open the carton and transfer the milk to a cuvette, we minimize potential contamination and maintain the original state of the sample. Furthermore, our method has the potential for real-time monitoring and continuous analysis. This capability allows for in-line quality control during milk processing and production. We expect that our optical system will pave the way for in situ content monitoring of raw and processed products in food and agricultural industries.Conflicts of interest
There are no conflicts to declare.Acknowledgements
This research was supported by Basic Science Research Program through the National Research Foundation of Korea (NRF) funded by the Ministry of Science and ICT and Future Planning (NRF-2020R1A2C2010170) (RS-2023-00234859).References
- G. Meurant, Handbook of Milk Composition, Elsevier, 1995 Search PubMed.
- P. J. Huth and K. M. Park, Adv. Nutr., 2012, 3, 266–285 CrossRef CAS PubMed.
- M. Kratz, T. Baars and S. Guyenet, Eur. J. Nutr., 2013, 52, 1–24 CrossRef CAS PubMed.
- J. B. German, R. A. Gibson, R. M. Krauss, P. Nestel, B. Lamarche, W. A. van Staveren, J. M. Steijns, L. C. P. G. M. de Groot, A. L. Lock and F. Destaillats, Eur. J. Nutr., 2009, 48, 191–203 CrossRef CAS PubMed.
- C. Dawczynski, L. Martin, A. Wagner and G. Jahreis, Clin. Nutr., 2010, 29, 592–599 CrossRef CAS PubMed.
- Dietary Guidelines for Americans, 2020–2025. 164.
- Food-Based Dietary Guidelines in Europe – table 11|Knowledge for policy, https://knowledge4policy.ec.europa.eu/health-promotion-knowledge-gateway/food-based-dietary-guidelines-europe-table-11_en, (accessed January 5, 2022).
- Healthy diet, https://www.who.int/news-room/fact-sheets/detail/healthy-diet, (accessed January 5, 2022).
- E. Wong, The New York Times, 2008 Search PubMed.
- B. Amer, C. Nebel, H. C. Bertram, G. Mortensen, K. Hermansen and T. K. Dalsgaard, Int. Dairy J., 2013, 32, 199–203 CrossRef CAS.
- M. J. M. Rutten, H. Bovenhuis, K. A. Hettinga, H. J. F. van Valenberg and J. A. M. van Arendonk, J. Dairy Sci., 2009, 92, 6202–6209 CrossRef CAS PubMed.
- H. Soyeurt, P. Dardenne, F. Dehareng, G. Lognay, D. Veselko, M. Marlier, C. Bertozzi, P. Mayeres and N. Gengler, J. Dairy Sci., 2006, 89, 3690–3695 CrossRef CAS PubMed.
- H. He, D.-W. Sun, H. Pu, L. Chen and L. Lin, Crit. Rev. Food Sci. Nutr., 2019, 59, 770–793 CrossRef CAS PubMed.
- C. M. McGoverin, A. S. S. Clark, S. E. Holroyd and K. C. Gordon, Anal. Chim. Acta, 2010, 673, 26–32 CrossRef CAS PubMed.
- S. Gallier, K. C. Gordon, R. Jiménez-Flores and D. W. Everett, Int. Dairy J., 2011, 21, 402–412 CrossRef CAS.
- R. M. El-Abassy, P. J. Eravuchira, P. Donfack, B. Von Der Kammer and A. Materny, Appl. Spectrosc., 2012, 66, 538–544 CrossRef CAS PubMed.
- M. Kontominas, in Improving the Safety and Quality of Milk, Elsevier, 2010, pp. 136–158 Search PubMed.
- W. Cladman, S. Scheffer, N. Goodrich and M. W. Griffiths, Int. Dairy J., 1998, 8, 629–636 CrossRef.
- P. Matousek, I. P. Clark, E. R. C. Draper, M. D. Morris, A. E. Goodship, N. Everall, M. Towrie, W. F. Finney and A. W. Parker, Appl. Spectrosc., 2005, 59, 393–400 CrossRef CAS PubMed.
- W. J. Olds, E. Jaatinen, P. Fredericks, B. Cletus, H. Panayiotou and E. L. Izake, Forensic Sci. Int., 2011, 212, 69–77 CrossRef CAS PubMed.
- S. Lohumi, H. Lee, M. S. Kim, J. Qin and B.-K. Cho, Anal. Bioanal. Chem., 2018, 410, 5663–5673 CrossRef CAS PubMed.
- D. I. Bower and W. F. Maddams, The Vibrational Spectroscopy of Polymers, Cambridge University Press, 1992 Search PubMed.
- Y. Cho, S. W. Song, J. Sung, Y.-S. Jeong, C. R. Park and H. M. Kim, Analyst, 2017, 142, 3613–3619 RSC.
- Y.-C. Tyan, M.-H. Yang, S.-B. Jong, C.-K. Wang and J. Shiea, Anal. Bioanal. Chem., 2009, 395, 729–735 CrossRef CAS PubMed.
- S. Liu, A. Kannegulla, X. Kong, R. Sun, Y. Liu, R. Wang, Q. Yu and A. X. Wang, Spectrochim. Acta, Part A, 2020, 231, 118130 CrossRef CAS PubMed.
Footnote |
| † Electronic supplementary information (ESI) available. See DOI: https://doi.org/10.1039/d3an00416c |
| This journal is © The Royal Society of Chemistry 2023 |

