 Open Access Article
Creative Commons Attribution 3.0 Unported Licence
A spectroscopic assessment of static and dynamic disorder in a film of a polythiophene with a planarized backbone†
Konstantin
Schötz
a,
Fabian
Panzer
 a,
Michael
Sommer
 b,
Heinz
Bässler
c and
Anna
Köhler
 *ac
*ac
aSoft Matter Optoelectronics and Bavarian Polymer Institute (BPI), University of Bayreuth, Universitätsstr. 30, 95447 Bayreuth, Germany
bInstitute for Chemistry, Chemnitz University of Technology, Straße der Nationen 62, 09111 Chemnitz, Germany
cBayreuth Institute of Macromolecular Research (BIMF), University of Bayreuth, Universitätsstr. 30, 95447 Bayreuth, Germany. E-mail: anna.koehler@uni-bayreuth.de
First published on 9th October 2023
Abstract
The optoelectronic performance of organic semiconductor devices is related to the static and dynamic disorder in the film. The disorder can be assessed by considering the linewidth of its optical spectra. We focus on identifying the effect of conjugation length distribution on the static energetic disorder. Hence, we disentangle the contributions of static and dynamic disorder to the absorption and emission spectra of poly(3-(2,5-dioctylphenyl)-thiophene) (PDOPT) by exploring how the linewidth and energy of the spectra evolve upon cooling the sample from 300 K to 5 K. PDOPT has sterically hindered side chains that arrange such as to cause a planarized polymer backbone. This makes it a suitable model for a quasi-one-dimensional molecular system. By modelling the conjugated segments as coupled oscillators we find that the linewidth contribution resulting from the variation of conjugation length decreases linearly with decreasing exciton energy and extrapolates to zero at the energy corresponding to an infinite chain. These results provide a new avenue to the design of low disorder and hence high mobility polymeric semiconductors.
New conceptsThe charge carrier mobility of organic semiconductors, and hence the performance of optoelectronic devices, relates to the energetic disorder that prevails in the material, with low disorder usually resulting in high mobility values. This article illustrates how one can disentangle the signatures of static and dynamic disorder in optical spectra such as to identify their contributions and structural origin in a material. For low-molecule weight molecules, the static disorder is largely determined by the dispersion forces with neighbouring molecules. For polymers, there is an additional contribution that results from the distribution of conjugation length. By analysing the linewidth of the optical spectra we show that the overall static disorder reduces with increasing conjugation length and vanishes in the infinite chain limit. The reason for this is two-fold. First, there is an energy variation along the polymer chain that arises from dispersion interactions with adjacent sites. Our results suggest that these energies average out with increasing length of the conjugated system, akin to the effects of motional narrowing. Second, the transition energies of excited states in polymers are well known to show a parabola-like dependence on the inverse conjugation length. We show that this implies a vanishing energy variation for long conjugation lengths. Our results imply that the design of conjugated polymers with very high conjugation length, typically achieved by backbone planarization, may provide a route towards high mobility polymeric compounds. |
1. Introduction
In an array of small molecules the absorption and fluorescence (PL) spectra are broadened due to dynamic and static disorder (Fig. 1). Static disorder reflects the distribution of dispersion forces such as van-der-Waals interactions within the random environment of the chromophore. Dynamic disorder, in contrast, is caused by the time-dependent coupling between the excited chromophore and intra- or intermolecular low-energy phonons. Different coupling in ground and excited states may compromise the usual mirror-symmetry in spectral shape between absorption and PL spectra.1–5 A π-conjugated polymer consists of a sequence of coherently π-conjugated oligomeric segments, designated as effective conjugation length. This conjugation length is subject to a distribution since the segments are usually not perfectly aligned but slightly distorted which affects their degree of conjugation. This distribution of conjugation length translates into a further contribution to the spectral line broadening, since the excitation energy of π-system is well known to shift to the red with increasing conjugation length.5–8 This implies that, in a polymer, the static disorder of an optical transition must be the sum of the van-der-Waals contribution and, in addition, the contribution due the standard deviation of the effective conjugation length (σCL). However, while dynamic as well as van-der-Waals-type static disorder have been studied intensively, no quantitative link between the statistical variation of the conjugation length and its standard deviation σCL has been established. This is the topic of the current work.The material chosen for the current study is regioregular poly(3-(2,5-dioctphenyl)thiophenyl (PDOPT) with a number-average degree of polymerization of DPn = 89. The dioctyl-phenyl-groups stabilize the chain by backbone planarization via side-chain alignment, thus reducing the variation in conjugation lengths.9,10 In their spectroscopic pioneering study, Raithel et al.11 applied single molecule spectroscopy to characterize the individual PDOPT chains with either 89 or 16 repeat units embedded and highly diluted in decane-matrix at 5 K. Their spectra reveal sharp zero-phonon lines of the 0–0 S1 ← S0 transition with average full width half maximum (FWHM) widths of 64 cm−1 (8 meV) and 33 cm−1 (4 meV), respectively. When considering the zero-phonon line in a site-selective study at 5 K, both static disorder and dynamic disorder are removed, thus revealing the linewidth of the single, individual π-conjugated chromophore.12
In contrast to their single-molecule study, our work is concerned with the linewidth in an ensemble of chromophores that prevail, e.g., in thin films that are used for optoelectronic applications such as solar cells and light emitting diodes. In the ensemble, static and dynamic disorder cause a distribution of excitation energies, so that the absorption spectrum of a film is correspondingly broadened since it comprises a superposition of all the excitation energies that are available in the density of states.13,14 The PL spectra, however, are more complex. In a neat film, a singlet excitation is subject to Förster-type energy transfer towards lower states of the distribution.15–29 This spectral diffusion is well known to be temperature dependent and to address different subsets of states.30 We wanted to examine how the inhomogeneously broadened absorption and fluorescence spectra of a neat PDOPT film evolve upon cooling from 300 K to 5 K. This should provide a handle on a correlation between inhomogeneous line-broadening, the transition energy and, concomitantly, the conjugation length distribution.
The experiments show that both the red-shift of the PL spectrum as well as the line-narrowing continue upon cooling until a temperature of about 20 K is reached with an ultimate standard deviation of the 0–0 transition as low as 10 meV. We find that the variance of the static disorder scales linearly with decreasing energy of the 0–0 feature of the PL spectrum. Due to the parabolic dependence between transition-energy and conjugation length,31 this provides a link between the distributions of conformational disorder and conjugation lengths.
2. Experimental section
Material synthesis
Regioregular poly(3-(2,5-dioctylphenyl)thiophene) (PDOPT) was synthesized using Kumada catalyst-transfer polycondensation described in more detail elsewhere.32 The PDOPT used in this study has a molecular weight of Mn = 33.7 kDa and a dispersity Đ = 1.66. The high regioregularity assists the formation of structures with intermolecular interactions such as aggregates or even crystallites, as detailed in ref. 32.Sample preparation
PDOPT was solved in tetrahydrofuran (THF) with a low concentration of about 2 mg ml−1. For film preparation, 50 μL of the solution was deposited onto a glass substrate and spin coated for 100 s at 3000 rpm. The resulting film is very thin with an estimated thickness of few tens of nanometers (based on the very low optical density and reported absorption coefficients of similar polythiophenes).Temperature-dependent optical spectroscopy and Raman spectroscopy
Temperature-dependent PL and absorption spectra were measured in a home-built setup. The setup consists of an electrically heatable continuous flow cryostat (Oxford Instruments), controlled by a temperature controller (Oxford Instruments ITC503S). A tungsten lamp (LOT-Oriel) serves as a white light source for the absorption measurements. For PL measurements, the sample is excited with a diode laser (Coherent COMPASS 405-50 CW) emitting at 405 nm. The light (PL or transmitted white light) is focused into a spectrograph (Andor Shamrock SR303i) and it is detected with a silicon CCD-camera (Andor iDus DU420a-OE). The optical density is calculated from the measured transmitted white light with the help of a reference measurement of an empty substrate. The recorded PL is corrected for self-absorption effects and for the detection efficiency of the setup.The Raman spectrum of the PDOPT thin film was recorded using a commercial confocal Raman microscope (WITec alpha300 RA+) coupled to a spectrometer (UHTS 400S NIR) and a CCD camera (Andor iDUS DU401 BR-DD). The excitation wavelength was 785 nm. The recorded spectrum was background corrected.
3. Results
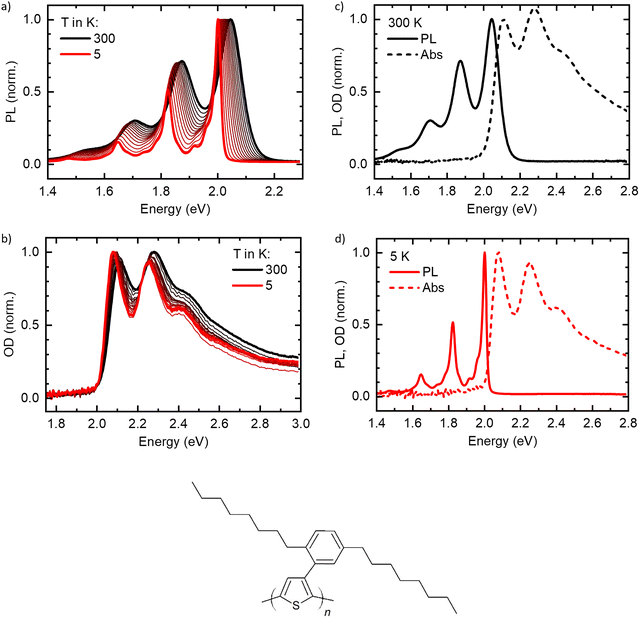
The normalized temperature-dependent PL and absorption spectra are shown in Fig. 2(a) and (b), respectively (see Fig. S1, ESI† for unnormalized data). At 300 K, the spectra agree well with reported spectra of highly aligned crystalline PDOPT samples.10,33,34 The PL shows already a clear vibronic progression, with the 0–0-peak being at 2.05 eV and vibronic peaks visible at 1.89 eV, 1.71 eV and 1.54 eV. Upon cooling, the spectrum shifts to lower energies, with the 0–0-peak reaching 2.008 eV at 5 K, and the linewidth reduces significantly. Thereby, additional vibronic features of energetically lower vibrational modes around 1.97 eV, 1.92 eV and 1.87 eV, and also between 1.68 eV and 1.80 eV become clearly visible.The absorption spectra (Fig. 2(b)) show a similar behavior, yet less pronounced. At 300 K, the 0–0 peak is at 2.12 eV, with vibronic features at about 2.29 eV and 2.48 eV. Upon cooling, the peaks shift to lower energies, with the 0–0 peak reaching 2.085 eV at 5 K. Additionally, the linewidth reduces, and the spectrum becomes slightly more structured. Remarkably, the onset of absorption (see also Fig. S2a, ESI† for a zoom-in) appears to stay constant for all temperatures at an energy slightly below 2.0 eV.
Fig. 2(c) and (d) show PL and absorption plotted on one energy axis at 300 K and 5 K, respectively. Here, the remarkably small linewidth of the PL at low temperatures becomes obvious. At 5 K, the 0–0 peak of the PL is located slightly above the onset of the absorption (see also Fig. S2b, ESI†).
To quantify the spectral changes observed during cooling, we fitted the temperature-dependent optical spectra with Franck–Condon (FC) progressions of the form:
 | (1) |
 | (2) |
 | (3) |
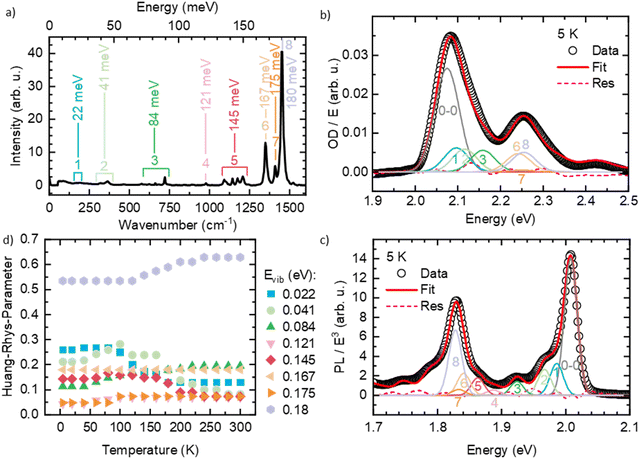
Like many conjugated polymers, the spectra of PDOPT result from a superposition of transition to chains that are disordered, non-aggregated and not interacting electronically, and to chains that are aligned and interact electronically such as to form weakly-interacting-aggregates.36 Before fitting the spectra, we therefore extracted the absorption of the interacting, aggregated chains from the overall absorption spectra with a scaling approach described in detail elsewhere (see also Fig. S3, ESI†).36 To evaluate which vibrational modes need to be considered in the FC-progression, we measured a Raman spectrum of the thin film at room temperature (Fig. 3(a)) and compared the energies of occurring features with the well-resolved PL at 5 K (Fig. 3(b)). We find several energetically low (effective) modes at about 22 meV (1), 41 meV (2), 84 meV (3), 121 meV (4) and 145 meV (5), and the dominant high energy modes at 167 meV (6), 175 meV (7) and 180 meV (8) that are characteristic for thiophene-containing π-conjugated systems.37,38 An exemplary fit of eqn (1) to the PL at 5 K is shown in Fig. 3(b), where all the considered modes are necessary to describe the PL spectrum satisfyingly (see also Fig. S4, ESI† for full spectral range). A fit of eqn (2) to the extracted absorption of the aggregated, interacting chains can be seen in Fig. 3(c). The Huang–Rhys factors obtained for the room temperature absorption spectra are consistent with the intensities of the Raman modes, as expected for Raman spectra taken with excitation near resonance. Starting at 5 K, we fitted the optical spectra of the aggregated chains at each temperature by varying E0–0, σ and the Huang–Rhys-parameters (full details of the FC-analysis can be found in Tables S1 and S2, ESI†). The Huang–Rhys-parameters are approximately constant upon heating yet around 150 ± 50 K, the relative weight shifts away from the lower-energy modes (22 and 41 meV) to the higher energy modes, notably 180 meV (Fig. 3(d)).
The results for E0–0 and σ are shown in Fig. 4(a) and (b), respectively. The 0–0 peak position of the absorption (E0–0,abs) decreases from 2.098 eV at 300 K to about 2.075 eV at 60 K, where it remains also for lower temperatures. The E0–0-feature of the PL-spectrum is red-shifted relative to the absorption spectrum by about 40 meV (at 300 K) to 80 meV (at 5 K). It decreases from 2.056 eV at 300 K to 2.098 eV at 20 K, where it saturates. A linear extrapolation of the region between 140 K and 60 K with a guide to the eye (dashed line) towards 0 K yields a value of E0–0,PL,extrapol = 2.000 ± 0.003 eV. Similarly to E0–0, the linewidth of the absorption σAbs (Fig. 3(b)) decreases upon cooling, starting at 37 meV at 300 K and saturating at approximately 28.7 meV at 40 K. At 300 K, the linewidth of the PL σPL is identical to σAbs, yet it decreases more strongly upon cooling and saturates at about 10.2 meV at 20 K. In contrast to σ2 at T > 40 K, σ is not linear, yet an approximate, linear extrapolation of σPL in the region before saturation occurs leads to agreement with the average value of the zero phonon line of isolated molecules reported by Raithel et al. (FWHM of 69 ± 24 cm−1, corresponding to σ = 3.7 ± 3.0 meV), which is indicated by the blue bar in Fig. 4(b)).11
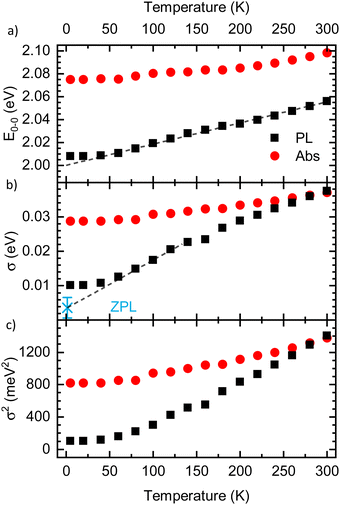 | ||
| Fig. 4 (a) Energetic position of the 0–0 peak (E0–0) and (b) linewidth Sigma of the PL (black) and the absorption spectra (red) as a function of temperature, as extracted from the Franck–Condon-analysis. Dashed lines are guides to the eye, linearly extrapolating the values to 0 K. The blue asterisk in panel (b) indicates the average linewidth of the zero phonon line (ZPL) of isolated PDOPT chains from the work of Raithel et al.11 (c) σ2 as a function of temperature. | ||
4. Discussion
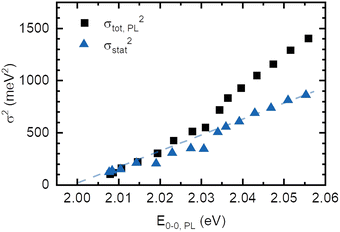
The absorption spectrum of an amorphous film of non-aggregated chromophores is usually of Gaussian shape. It reflects its static and dynamic disorder, quantified terms of the standard deviations σstat and σdyn (cf.Fig. 1 above). Upon broad band optical excitation, singlet excitons are created that execute a random walk among the density of state (DOS) distribution. This gives rise to spectral diffusion of the excitons towards tail state of the DOS distribution. The fluorescence (PL) spectrum is therefore off-set from the absorption spectrum by the amount of spectral relaxation combined with temperature dependent spectral broadening. The theory of random walks predicts that under the condition of low intensity the excitons should relax to quasi-equilibrium at an energy of σ2/kT below the center of the DOS distribution unless the jump rate of the exciton becomes less than the rate of its intrinsic decay. Usually this occurs when the exciton has relaxed by an amount of 2.5–3.0·σ.19,39 If the excitations reach thermal quasi-equilibrium, the width of the DOS distribution that is occupied in this relaxation process is maintained.40 Otherwise, the distribution of occupied states narrows up to about 2/3 of the total DOS width.30 Since the standard deviation of the absorption spectrum of the PDOPT film is about 35 meV one would expect (i) that the PL spectrum would first bear out a red-shift upon sample cooling but tend to saturate at a temperature of (150 ± 15) K and (ii) that the width of the PL-spectrum would amount to at least 23 meV.Fig. 2 and 4 show that the PL spectrum shifts continuously down to roughly 20 K and its standard deviation reaches an unexpectedly low value of 10 meV. This is in striking disagreement with the conventional relaxation concept. Conjecturing that the temperature dependent red-shift of the PL emission and the line narrowing have a common origin, we plotted the variance σ2 of the 0–0 feature of the PL spectrum against its spectral position energy at a given temperature (Fig. 5). We find that σ2 increases linearly with energy up to an energy of 2.03 eV. Above 2.03 eV, σ2 maintains to increases linearly with E0–0 yet with a larger slope. We associate the change of slope with the change in the contribution of phonon modes that couple to the emission, cf.Fig. 3(d).
We argue that such a correlation is a consequence of the fact that PDOPT consists of long π-conjugated chromophores, where the energy of the singlet exciton depends on chromophore length. Based upon the coupled oscillator model of Lewis and Calvin,41 W. Kuhn – not to be confused with H. Kuhn who proposed the particle-in-a-box model – predicted that for moderate to long numbers n of double bonds in the conjugated system, the energy of the chromophores’ excited state should scale as
 | (4) |
As a consequence of this parabolic dependence of En on the inverse length of the conjugated unit, any statistical variation of the conjugation length must contribute to the static disorder of the system. This applies not only if the physical length of the conjugated units differs, but also when the conjugation length is reduced by poor coupling, e.g. due to torsions, along the chromophore.41,42 Similarly, this statistical variation in energy should vanish when the conjugation length becomes infinite (n → ∞). This is illustrated in Fig. 6.
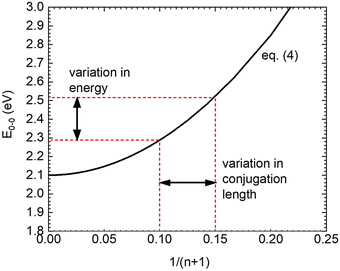 | ||
| Fig. 6 Illustration on the relation between the variations of conjugation length and transition energy on the basis of eqn (4). n denotes the number of double bonds, E0–0 is the energy of the first excited singlet state. The values are parametrized to describe PDOPT. | ||
Using eqn (4) and the mean value theorem, it is straightforward to see that a variation in the inverse length (1/n + 1) of the conjugated segment translates into a corresponding variation on the excited state energy En according to
 | (5) |
Correspondingly, any statistical distribution in the inverse conjugation lengths results in a statistical distribution of excited states energies. Hence, the variance σ2 should be proportional to (1/n + 1)2, and thus by eqn (4) proportional to En − En,∞, as is experimentally observed in Fig. 5.
The variance of the 0–0 feature of the PL spectrum is therefore the sum of three contributions, i.e. (1) of dynamic disorder, σdyn2, (2) the static disorder due to electrostatic dispersion interactions between the excited chain with the local dielectric environment (van-der-Waals coupling), σvdW2, and (3) the static disorder due to the variation of the conjugation length, σCL2.
Dynamic disorder is related to the interaction between an excited state and the local environment due to the electron–phonon-coupling that alters the site energy. The phonon modes involved are typically very low-energy modes, e.g. well below 10 meV. At sufficiently high temperatures at which low energy vibrations can be treated classically, the variance σdyn2, is related to the electron–phonon coupling parameter λ via σdyn2 = 2λkT.1 It is responsible for the temperature-dependent evolution of the spectral width of an excitation in a system in which static disorder is temperature-independent. This reasoning applies to the absorption spectrum of a PDOPT film. Fig. 4(a) and (b) shows that between 5 K and 300 K the absorption spectra bear out only weak blue-shift upon heating, accompanied by some broadening. This temperature-dependent change of the absorption spectrum must therefore solely be accounted for by temperature dependent line broadening due to dynamic disorder. The variance of the 0–0 feature of the absorption spectrum above 40 K indeed increases linearly with temperature as theoretically predicted (see Fig. 4(c) and Fig. S5, ESI†) and yields a λ of 30 meV for the temperature dependent dynamic disorder.
Making the approximation that the effect of dynamic disorder be the same in absorption and emission, we subtract the contribution of temperature-dependent dynamic disorder from the total variance of the PL spectrum (Fig. 5). As the excited state potential is, in general, more shallow than the ground state potential, i.e. λES < λGS, this approximation is subtracting too little, i.e. it gives an upper bound for the remaining quantity. The remaining quantity is the temperature-independent dynamic disorder and the static disorder. For PDOPT with its planarized backbone, coupling to phonon modes at 0 K is very weak, as evident from the lack of a significant phonon wing in the single molecule spectra.11 Hence, the temperature-independent dynamic disorder is negligible in PDOPT, and the remaining quantity corresponds to an upper bound for the static disorder, i.e. σCL2 + σvdW2. This disorder contribution decreases linearly with decreasing energy of the 0–0 PL and extrapolates to zero at an excited state energy of (2.000 ± 0.003) eV (Fig. 5). We recall from the context of eqn (4) that the limit of vanishing statistical variance corresponds to the limit of infinite conjugation length. Within experimental accuracy, this value of (2.000 ± 0.003) eV this agrees with the energy for the excited state of PDOPT chain extrapolated to 0 K, i.e. where spectral diffusion would reach the longest conjugated segments. (Fig. 4(a)). This does not only verify the hypothesis that the narrowing of the 0–0 PL line is the signature of the parabolic shape of the exciton spectrum as a function of reciprocal conjugation length, but also indicates that the van-der-Waals contribution to static disorder (σvdW2) decreases similarly with increases conjugation length. We interpret this as a signature of exchange narrowing that occurs when an excitation in π-bonded chain becomes more extended and the effect of the rough environment is progressively smeared out, akin to motional narrowing.7,43,44
To relate the energy of the 0–0 feature of the PL spectrum of a PDOPT film to the conjugation length we resort on the work of Wasserberg et al.45 who measured the PL spectra of 2–6 membered oligomers of thiophene. An analysis of her data in terms of eqn (4) yields β = (−1.9 ± 0.05) eV and En,∞ = 2.10 ± 0.05 eV. The extrapolated value of the exciton energy of an infinite PDOPT chain, (2.000 ± 0.003) eV, is roughly by 0.10 eV below the extrapolated value of 2.10 ± 0.05 eV for an infinite thiophene chain, as illustrated in Fig. 6. Raithel et al. attributed this to a different charge transfer character a PDOPT relative to a thiophene chain.11 That difference between the En,∞ value may, however, simply be the result of the increased solvent shift of the S1–S0 transition of PDOPT due to the polarizable side groups. Alternatively, the lower En,∞ value may result from the weak, predominantly J-type, coupling that prevails between the planarized chromophores here, analogous to that observed in planarized MEH-PPV.46 We recall that we are investigating those chains in the film that form aggregates, and that fitting these aggregates with eqn (1) yields a value of α ≈ 1.1, indicative of weak, predominant J-type, coupling.47,48
Adopting the same β-value for a poly-thiophene chain and a PDOPT chain may be questionable yet is supported by a comparison between present data and those of Raithel et al. These authors observed that the zero-phonon-line (ZPL) transition of a 16 membered PDOPT oligomer embedded in a decane-matrix is at an energy of 2.11 eV.11 Using our parameters for β and En,∞ we find that a transition energy of 2.11 eV indeed corresponds to a conjugation length of 16–18 thiophene-rings. This is a consistency check for present data analysis.
The concept of spectral diffusion predicts that once generated, excitons relax towards deeper states of the distribution and finally settle at a quasi-equilibrium level that is controlled by the trade-off between temperature-activated diffusion and radiative or non-radiative decay. When the chromophores are long as in a PDOPT-film, spectral diffusion can extend towards very low temperatures because, in view the parabolic dependence of the exciton energy and the chain length, the activation energy needed for transport becomes very small. Eventually, there will be a cut-off energy that translate into a maximum value of the conjugation length because ultimately excitons decay before finding another available chromophore for further energy transfer. Fig. 7 illustrates how this manifests itself in a maximum conjugation length of about 50 thiophene rings when eqn (4) is used to convert the temperature-dependent E0–0 values to number of coupled thiophene rings N (note that one thiophene ring N = 2 double bonds n).
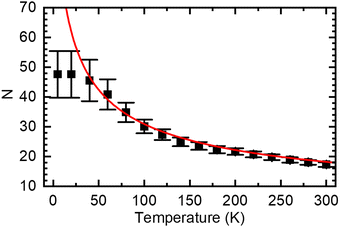 | ||
| Fig. 7 Average number of thiophene rings N in a conjugated segment that gives rise to PL emission at a given temperature, calculated from eqn (4) using the data in Fig. 4(a). The red line denote the values based on the extrapolation to 0 K (dashed line in Fig. 4(a)), the black squares are based on the experimental data (black squares in Fig. 4(a)). | ||
Extrapolating both the energy of the 0–0 feature of the PL spectrum and the variance of static disorder towards T = 0 K yields the asymptotic value for the PL spectrum of an infinite chain in the absence of both static and dynamic disorder and should mimic the ZPL 0–0 feature of a chain matrix-isolated in a decane-glass that is resonant in absorption and emission. Indeed, Raithel et al. found that the standard deviations of the ZPL lines are of the order of few meV. This remaining linewidth has to be an intra-chain property related to intra-chain scattering of the excitation.
5. Conclusions
Based upon absorption and fluorescence spectra in a film of neat PDOPT, that is a thiophene chain planarized via side-group alignment leading to long conjugated units, we are able to rationalize the inhomogeneous line broadening in a system of linearly extended chromophores. We find that under broad excitation the PL spectrum bears out a continuous red-shift when cooling the sample from 300 K to 20 K followed by subsequent saturation. Concomitantly the standard deviation σ of the 0–0 feature of the PL spectrum decreases from about 40 meV to 10 meV. Basically, these observations are the signature of spectral diffusion of singlet excitons which allows mapping the distribution of singlet states from which emission occurs. The intriguing aspect is that spectral diffusion extends to very low temperatures and that the ultimate PL-linewidth is as low as 10 meV, i.e., only 3 times the mean standard deviation of the zero-phonon-line that had been measured on a matrix-isolated PDOPT-chromophore. We argue that this a characteristic property of a long-chain chromophore whose inhomogeneous line-broadening is the sum of three terms, (i) dynamic disorder, (ii) static disorder due to van-der-Waals-type coupling of the excited state to the random environment, and (iii) static disorder because the energy of the excited states depends on the conjugation length of the oligomer that is subject to a distribution. In particular, we found the variance of the static disorder, σstat2 = σvdW2 + σCL2, to reduce in a linear fashion along with the 0–0 transition energy when the conjugation in a polymer chain segment increases. It is remarkable that that both reduce concomitantly, i.e. σvdW as a result of a motional narrowing effect, and σCL, as a result of the parabolic energy dependence of transition energies on inverse conjugation length. In this way, our findings elucidate and quantify the relationship between conjugation length and static disorder. Given that energetic disorder is still a key factor controlling thermally activated charge transport, knowledge on what can reduce disorder is relevant to device applications.Our findings can have implications for the design of solar cell materials as disorder is known to limit the maximum open circuit voltage in organic solar cells.49 Hence, the use of planar chains with long conjugation lengths is one way by which energetic disorder can be minimized. Chemical design approaches towards obtaining films with planar chains are well known. For example, rotations between repeat unit can be prevented by covalent bridges that fix the structure as in ribbon- or ladder-type frameworks, with ladder-type poly(para-phenylene) being the most prominent example.50 Alternatively, non-bonding heteroatom interactions may be employed to lock the backbone.51,52 The results presented by us point to a third general design principle by which sterically demanding side chains force the backbone into a higher degree of coplanarity, which may be employed to other examples of conjugated polymers as well.
Conflicts of interest
There are no conflicts to declare.Acknowledgements
We thank Daniel Schiefer for synthesizing the PDOPT sample and Holger Schmalz for assistance with the Raman-Measurements. Further, we acknowledge funding from the Deutsche Forschungsgemeinschaft, KO3973/3-1, sowie IRTG 2818/1 (OPTEXC) and PA3373/3-1.References
- N. R. Tummala, Z. L. Zheng, S. G. Aziz and V. Coropceanu,
et al.
, J. Phys. Chem. Lett., 2015, 6, 3657 CrossRef PubMed
.
- Z. L. Zheng, N. R. Tummala, T. H. Wang and V. Coropceanu,
et al.
, Adv. Energy Mater., 2019, 9, 1803926 CrossRef
.
- T. Linderl, T. Zechel, A. Hofmann and T. Sato,
et al.
, Phys. Rev. Appl., 2020, 13, 024061 CrossRef
.
- S. L. M. van Mensfoort, S. I. E. Vulto, R. A. J. Janssen and R. Coehoorn, Phys. Rev. B: Condens. Matter Mater. Phys., 2008, 78, 085208 CrossRef
.
- J. Gierschner, J. Cornil and H. J. Egelhaaf, Adv. Mater., 2007, 19, 173 CrossRef
.
-
K. Müllen and G. Wegner, Electronic Materials: The Oligomer Approach, Wiley-VCH, 1998 Search PubMed
.
- S. Baderschneider, U. Scherf, J. Köhler and R. Hildner, J. Phys. Chem. A, 2016, 120, 233 CrossRef PubMed
.
- J. Rissler, Chem. Phys. Lett., 2004, 395, 92 CrossRef
.
- F. M. Keheze, D. Raithel, T. Y. Wu and D. Schiefer,
et al.
, Macromolecules, 2017, 50, 6829 CrossRef
.
- Y. Y. Wang, B. Heck, D. Schiefer and J. O. Agumba,
et al.
, ACS Macro Lett., 2014, 3, 881 CrossRef PubMed
.
- D. Raithel, L. Simine, S. Pickel and K. Schötz,
et al.
, Proc. Natl. Acad. Sci. U. S. A., 2018, 115, 2699 CrossRef PubMed
.
- R. Hildner, L. Winterling, U. Lemmer and U. Scherf,
et al.
, ChemPhysChem, 2009, 10, 2524 CrossRef PubMed
.
-
A. Köhler and H. Bässler, Electronic Processes in Organic Semiconductors, Wiley-VCH, 2015 Search PubMed
.
- A. Amirav, U. Even and J. Jortner, Chem. Phys. Lett., 1980, 72, 16 CrossRef
.
- B. Movaghar, M. Grünewald, B. Ries and H. Bässler,
et al.
, Phys. Rev. B: Condens. Matter Mater. Phys., 1986, 33, 5545 CrossRef PubMed
.
- S. C. J. Meskers, J. Hübner, M. Oestreich and H. Bässler, J. Phys. Chem. B, 2001, 105, 9139 CrossRef
.
- S. T. Hoffmann, H. Bässler, J. M. Koenen and M. Forster,
et al.
, Phys. Rev. B: Condens. Matter Mater. Phys., 2010, 81, 115103 CrossRef
.
- T. A. Papadopoulos, L. Muccioli, S. Athanasopoulos and A. B. Walker,
et al.
, Chem. Sci., 2011, 2, 1025 RSC
.
- S. Athanasopoulos, S. T. Hoffmann, H. Bässler and A. Köhler,
et al.
, J. Phys. Chem. Lett., 2013, 4, 1694 CrossRef PubMed
.
- N. Banerji, J. Mater. Chem. C, 2013, 1, 3052 RSC
.
- L. M. Herz, C. Silva, A. C. Grimsdale and K. Müllen,
et al.
, Phys. Rev. B: Condens. Matter Mater. Phys., 2004, 70, 165207 CrossRef
.
- N. Banerji, S. Cowan, E. Vauthey and A. J. Heeger, J. Phys. Chem. C, 2011, 115, 9726 CrossRef
.
- W. Barford and M. Marcus, J. Chem. Phys., 2017, 146, 130902 CrossRef PubMed
.
- W. R. Hollingsworth, J. Lee, L. Fang and A. L. Ayzner, ACS Energy Lett., 2017, 2, 2096 CrossRef
.
- W. Barford, Front. Phys., 2022, 10, 1004042 CrossRef
.
- A. J. Sneyd, D. Beljonne and A. K. Rao, J. Phys. Chem. Lett., 2022, 6820 CrossRef PubMed
.
- O. V. Mikhnenko, P. W. M. Blom and T. Q. Nguyen, Energy Environ. Sci., 2015, 8, 1867 RSC
.
- S. Westenhoff, W. J. Beenken, A. Yartsev and N. C. Greenham, J. Chem. Phys., 2006, 125, 154903 CrossRef PubMed
.
- S. Westenhoff, W. J. Beenken, R. H. Friend and N. C. Greenham,
et al.
, Phys. Rev. Lett., 2006, 97, 166804 CrossRef PubMed
.
- A. Stankevych, R. Saxena, A. Vakhnin, F. May, N. Kinaret, D. Andrienko, J. Genoe, H. Bässler, A. Köhler and A. Kadashchuk, Phys. Rev. Appl., 2023, 19, 054007 CrossRef
.
- W. Kuhn, Helv. Chim. Acta, 1948, 31, 1780 CrossRef PubMed
.
- D. Schiefer, T. Wen, Y. Y. Wang and P. Goursot,
et al.
, ACS Macro Lett., 2014, 3, 617 CrossRef PubMed
.
- A. Hamidi-Sakr, D. Schiefer, S. Covindarassou and L. Biniek,
et al.
, Macromolecules, 2016, 49, 3452 CrossRef
.
- K. E. Aasmundtveit, E. J. Samuelsen, W. Mammo and M. Svensson,
et al.
, Macromolecules, 2000, 33, 5481 CrossRef
.
- F. C. Spano, Acc. Chem. Res., 2010, 43, 429 CrossRef PubMed
.
- F. Panzer, H. Bässler and A. Köhler, J. Phys. Chem. Lett., 2017, 8, 114 CrossRef PubMed
.
- J. Nightingale, J. Wade, D. Moia and J. Nelson,
et al.
, J. Phys. Chem. C, 2018, 122, 29129 CrossRef
.
- P. Cavassin, I. Holzer, D. Tsokkou and O. Bardagot,
et al.
, Adv. Mater., 2023, 2300308 CrossRef PubMed
.
- S. T. Hoffmann, S. Athanasopoulos, D. Beljonne and H. Bässler,
et al.
, J. Phys. Chem. C, 2012, 116, 16371 CrossRef
.
- H. Bässler, Phys. Status Solidi B, 1993, 175, 15 CrossRef
.
- G. N. Lewis and M. Calvin, Chem. Rev., 1939, 25, 273 CrossRef
.
- W. Barford, J. Phys. Chem. A, 2013, 117, 2665 CrossRef PubMed
.
- J. Knoester, J. Chem. Phys., 1993, 99, 8466 CrossRef
.
- E. W. Knapp, Chem. Phys., 1984, 85, 73 CrossRef
.
- D. Wasserberg, P. Marsal, S. C. Meskers and R. A. Janssen,
et al.
, J. Phys. Chem. B, 2005, 109, 4410 CrossRef PubMed
.
- H. Yamagata, N. J. Hestand, F. C. Spano and A. Köhler,
et al.
, J. Chem. Phys., 2013, 139, 114903 CrossRef PubMed
.
- F. C. Spano, J. Chem. Phys., 2005, 122, 234701 CrossRef PubMed
.
- H. Yamagata and F. C. Spano, J. Chem. Phys., 2012, 136, 184901 CrossRef PubMed
.
- M. Panhans, S. Hutsch, J. Benduhn and K. S. Schellhammer,
et al.
, Nat. Commun., 2020, 11, 1488 CrossRef PubMed
.
- U. Scherf, J. Mater. Chem., 1999, 9, 1853 RSC
.
- C. J. Mueller, E. Gann, C. R. McNeill and M. Thelakkat, J. Mater. Chem. C, 2015, 3, 8916 RSC
.
- N. E. Jackson, B. M. Savoie, K. L. Kohlstedt and M. O. de la Cruz,
et al.
, J. Am. Chem. Soc., 2013, 135, 10475 CrossRef PubMed
.
Footnote |
| † Electronic supplementary information (ESI) available. See DOI: https://doi.org/10.1039/d3mh01262j |
| This journal is © The Royal Society of Chemistry 2023 |


