Metabolic profiling of murine radiation-induced lung injury with Raman spectroscopy and comparative machine learning†
Mitchell
Wiebe
 a,
Kirsty
Milligan
 a,
Joan
Brewer
a,
Alejandra M.
Fuentes
a,
Joan
Brewer
a,
Alejandra M.
Fuentes
 a,
Ramie
Ali-Adeeb
b,
Alexandre G.
Brolo
 b,
Julian J.
Lum
cd,
Jeffrey L.
Andrews
a,
Christina
Haston
*a and
Andrew
Jirasek
*a
aDepartment of Computer Science, Mathematics, Physics, and Statistics, The University of British Columbia Okanagan Campus, Kelowna, Canada. E-mail: christina.haston@ubc.ca; andrew.jirasek@ubc.ca
bDepartment of Chemistry, The University of Victoria, Victoria, Canada
cDepartment of Biochemistry and Microbiology, University of Victoria, Victoria, Canada
dTrev and Joyce Deeley Research Centre, BC Cancer, Victoria, Canada
First published on 10th April 2024
Abstract
Radiation-induced lung injury (RILI) is a dose-limiting toxicity for cancer patients receiving thoracic radiotherapy. As such, it is important to characterize metabolic associations with the early and late stages of RILI, namely pneumonitis and pulmonary fibrosis. Recently, Raman spectroscopy has shown utility for the differentiation of pneumonitic and fibrotic tissue states in a mouse model; however, the specific metabolite-disease associations remain relatively unexplored from a Raman perspective. This work harnesses Raman spectroscopy and supervised machine learning to investigate metabolic associations with radiation pneumonitis and pulmonary fibrosis in a mouse model. To this end, Raman spectra were collected from lung tissues of irradiated/non-irradiated C3H/HeJ and C57BL/6J mice and labelled as normal, pneumonitis, or fibrosis, based on histological assessment. Spectra were decomposed into metabolic scores via group and basis restricted non-negative matrix factorization, classified with random forest (GBR-NMF-RF), and metabolites predictive of RILI were identified. To provide comparative context, spectra were decomposed and classified via principal component analysis with random forest (PCA-RF), and full spectra were classified with a convolutional neural network (CNN), as well as logistic regression (LR). Through leave-one-mouse-out cross-validation, we observed that GBR-NMF-RF was comparable to other methods by measure of accuracy and log-loss (p > 0.10 by Mann–Whitney U test), and no methodology was dominant across all classification tasks by measure of area under the receiver operating characteristic curve. Moreover, GBR-NMF-RF results were directly interpretable and identified collagen and specific collagen precursors as top fibrosis predictors, while metabolites with immune and inflammatory functions, such as serine and histidine, were top pneumonitis predictors. Further support for GBR-NMF-RF and the identified metabolite associations with RILI was found as CNN interpretation heatmaps revealed spectral regions consistent with these metabolites.
Introduction
Radiation therapy can be a highly effective treatment modality for cancer. However, treatment effectiveness is often limited by damage to healthy tissues.1 For patients receiving thoracic radiotherapy, radiation-induced lung injury (RILI) represents a limiting factor for successful treatments.2–4 Considering that radiation treatment of the two most prevalent cancers (breast and lung5) carry risk for RILI,3 characterizing the disease is an important step towards improving cancer patient treatment outcomes.RILI occurs following radiation-induced DNA damage and can be categorized into three main stages: initial cellular death, an acute stage marked by radiation pneumonitis, and a subsequent late stage marked by radiation pulmonary fibrosis.2–4,6–8 Pneumonitis refers to inflammation of the lung, typically presenting 1–6 months after radiation therapy with noteworthy symptoms being dyspnea (shortness of breath), cough, and mild fever. Radiation injury alters the number and type of inflammatory and immune cells, contributing to the complexity of pneumonitis by both repairing pulmonary damage and sustaining it.9,10 While pneumonitis is typically reversible, prolonged alveolar and vascular damage can lead to the irreversible condition of pulmonary fibrosis.2,4,6 Fibrosis is marked by excessive collagen production in the lung following sustained inflammation of pneumonitis, scarring the lung tissue and typically manifesting as progressive chronic dyspnea.
The predominant form of pre-clinical study for RILI has become mouse models, largely owing to their similarities to humans in terms of anatomy, physiology, pathology, and genomics.6 Hence, mouse models can provide valuable insights into the mechanisms of RILI. In particular, the C57BL/6J and C3H/HeJ mouse strains are often studied as each exhibits unique radio-sensitivity in terms of lung injury following radiation. C57BL/6J mice develop early pneumonitis and subsequent late fibrosis, while C3H/HeJ mice are prone to severe early pneumonitis.11–14
The metabolic investigation of biological systems, particularly for the study of disease, has been aided by the optical technique of Raman spectroscopy.15,16 Raman spectroscopy relies on the inelastic scattering of light to provide information on the chemical structures and physical forms of a sample.17 In concise terms, monochromatic light is scattered from a sample of interest and the change in wavelength between incident and returning photons is determined. The change in wavelength, and related quantity termed Raman shift, which represents the shift in wavenumber, carries characteristic (‘fingerprint’) information regarding molecular vibrational modes activated within the sample. As such, Raman spectroscopy has been used to identify radiation-induced metabolic changes in human cancer cells.18,19 Moreover, Raman spectroscopy has been recognized as a valuable tool for classifying RILI, as demonstrated in a mouse model, which successfully classified Raman spectra into distinct normal/fibrotic categories.20 However, while RILI has been investigated by genetic and blood assays,12,21 the RILI metabolic associations remain to be investigated from a Raman perspective.
The analysis of Raman spectroscopic data has been largely aided by the application of dimension reduction techniques and machine learning.22 For high dimensional data, as in Raman spectroscopy, dimension reduction decreases the amount of correlated features and facilitates supervised machine learning tasks.23 The newly formatted data can be utilized for tasks such as classification of healthy/diseased tissue. Conventionally, principal component analysis (PCA) has been used as a spectral decomposition technique for dimension reduction, providing principal components (PCs) that describe the variation within the dataset.24 In this approach, each spectrum within the dataset receives a score for each PC, indicating the extent to which the spectrum follows the given PC trend. In the context of Raman spectroscopy, PCs are often difficult to interpret as they can take on negative values, an incorrect representation of spectroscopic data, and spectral features related to individual biochemicals may be present across multiple PCs.24 Recently, group and basis restricted non-negative matrix factorization (GBR-NMF) has demonstrated utility as an interpretable spectral decomposition technique capable of assigning relative scores for individual metabolites based on their Raman profiles.25 GBR-NMF scores, in combination with random forest classifiers, have shown utility to identify radiation-induced metabolic changes in human cancer cells.19
In some cases, dimension reduction may be essentially by-passed by deep learning models such as convolutional neural networks (CNNs), by performing end-to-end feature learning and prediction of Raman spectra through multiple processing layers.23 Additionally, CNNs consider the spatial relations between adjacent Raman shift values, making them suitable for spectral analysis.26 Although CNNs have demonstrated state-of-the-art performance for feature learning and classification performance,26,27 their interpretability has not been entirely clear.28 Recently, however, gradient-based attribution methods have been developed to pinpoint the areas in the input Raman spectrum that had the most influence on the network's prediction.28,29
Finally, logistic regression (LR) has been utilized to classify full spectra,20 also circumventing the use of dimension reduction techniques. However, this method is limited in terms of metabolic interpretation as it treats each Raman wavenumber independently and does not account for the fact that adjacent values are correlated.
This work investigates the potential of Raman spectroscopy to identify metabolic associations with radiation-induced pneumonitis and fibrosis in a mouse model. We hypothesize that Raman spectra decomposed via GBR-NMF can be predicted as normal, pneumonitis, or fibrosis with random forest classifiers to provide interpretable metabolic-based insights to each disease. To provide comparative context, we also analyze the classification performance of conventional PCA with random forest, a Raman-specific CNN based on previous work,26 and logistic regression. Furthermore, to explore CNN interpretability, we apply gradient class activation mapping (grad-CAM29) to highlight spectral regions deemed important for disease classification.
Methods
Mouse model, irradiation, and lung preparation
C3H/HeJ (C3H) and C57BL/6J (C57) female mice were purchased from the Jackson Laboratory (Bar Harbor, ME) and housed in the animal facility of the University of British Columbia Okanagan. Mice were handled according to protocol A18–0140 approved by the Animal Care Committee at the University of British Columbia, in accordance with regulations set by the Canadian Council on Animal Use and Care. In total, 10 C57 mice (5 control and 5 irradiated) and 10 C3H mice (5 control and 5 irradiated) were investigated. Female mice were studied as they manifest earlier onset of radiation-induced disease than males of the same strain.12Mice were irradiated as set out in ref. 20. Briefly, eight week old mice were anesthetized by intraperitoneal injection of sodium pentobarbitol and xylazine, placed in a transparent box and irradiated with 16 Gy to the thorax by a 6 MV flattening filter free Varian Linac. The dose-level of 16 Gy was selected as it is known to cause RILI in the mouse strains investigated.14 Following irradiation, mice were monitored for signs of physical distress due to RILI. The experimental endpoints for mice were ≥20% weight loss (from greatest observed weight) and/or shallow and rapid breathing, hunching, slow and tip-toe movement, ungroomed fur, and decreased physical responsiveness. Mice qualified for euthanasia based upon an overall impression of these conditions, typically expressing all symptoms along with significant weight loss. For each mouse, the time from radiation date to euthanasia is listed in ESI Table S1.† Control mice were euthanized around the same timepoint as irradiated mice of the same strain.
Immediately following euthanasia, by intraperitoneal injection of a lethal sodium pentobarbitol dose, the chest wall was opened and the lungs were removed. The left lobe was filled with a 1![[thin space (1/6-em)]](https://www.rsc.org/images/entities/char_2009.gif) :
:![[thin space (1/6-em)]](https://www.rsc.org/images/entities/char_2009.gif) 1 solution of optimal cutting temperature (OCT) compound and phosphate buffer solution (PBS) to expand the lung to maintain anatomical morphology. The expanded lung was placed in a plastic mold, surrounded by undiluted OCT, and placed on crushed dry ice to freeze prior to storage at −80 °C.
1 solution of optimal cutting temperature (OCT) compound and phosphate buffer solution (PBS) to expand the lung to maintain anatomical morphology. The expanded lung was placed in a plastic mold, surrounded by undiluted OCT, and placed on crushed dry ice to freeze prior to storage at −80 °C.
Raman acquisition and pre-processing
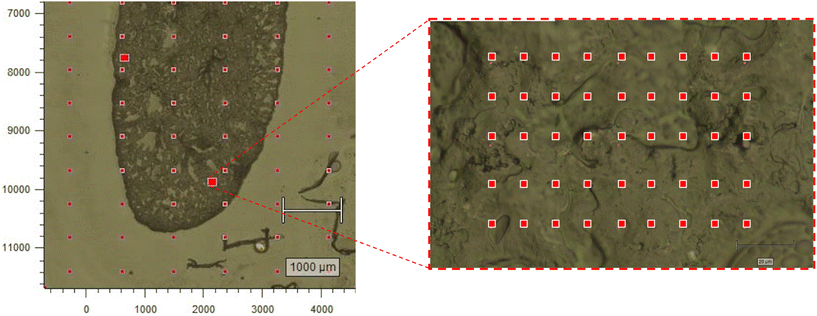
Frozen lung blocks were sectioned at 20 μm with a microtome cryostat, and mounted to a MgF2 slide. Once mounted, the OCT medium acted to stabilize the tissue and limit potential deformation. Raman measurements were acquired on a Renishaw InVia microscope (830 lines per mm, 785 nm excitation laser, 100× dry objective, power density 0.5 mW μm−3) (Renishaw Inc., IL, USA). Three regions of interest (ROI) were selected along the lung periphery, with the goal of sampling from dense, potentially fibrotic regions. Three ROIs were also selected within the central area of the lung, with the goal of sampling from potentially pneumonitic regions. Approximately 50–70 spectra were acquired (30 seconds-per-spectrum) in a raster pattern to form a grid from each ROI at a step size of 15 μm (Fig. 1). To reduce the likelihood of acquiring low quality spectra due to biological tissue degradation, the total sampling time for each tissue was kept under three hours. This was based on insights provided by Butler et al.30 as well as our group's prior experience acquiring Raman spectra from biological samples.Acquired spectra were pre-processed with an in-house MATLAB script before further analysis. In summary, cosmic ray contamination was removed by linear interpolation, saturated spectra were removed, a Savitsky–Golay filter was used to reduce noise (window size = 5 points, polynomial order = 1) and estimate/subtract the fluorescence background (window size = 7% of the spectral range, polynomial order = 1), and resulting spectra were normalized to unity by area under the curve. To remove spectra with low tissue composition (i.e.: air-space filled with OCT-PBS), Pearson's correlation coefficient was calculated for each spectrum against an average of 300 pure OCT-PBS spectra. If the correlation was ≥0.80, the spectrum was removed from the dataset. Furthermore, to retain generally high quality spectra, each spectrum was compared by Pearson's correlation coefficient to an average of 10 high quality spectra for the corresponding strain in the corresponding irradiated/un-irradiated condition. The spectrum was discarded if the correlation was ≤0.90, kept if ≤0.98, and considered to be of unknown quality otherwise. The unknown spectra were kept or discarded using a model-based classification technique based on parsimonious Gaussian mixture models (PGMMs)31 in R. Briefly, the unknown spectra were input to a model along with several known-high quality and known-poor quality spectra. The unknown spectra were randomly assigned to one group, the mean and covariance for each group were estimated, and clustering was performed. The later two processes repeated iteratively until further iterations minimally improve the fitting criteria. Examples of both high- and low-quality spectra, including high OCT-PBS correlation, are illustrated in ESI Fig. S1.†
Pre-processing resulted in 1372 spectra from C57 mice (954 normal, 286 pneumonitis, and 132 fibrosis) from 49 individual regions (33 normal, 10 pneumonitis, and 6 fibrosis) and 1673 spectra from C3H mice (1150 normal and 291 pneumonitis) from 48 individual regions (42 normal and 6 pneumonitis).
For comparison with GBR-NMF, we also decomposed the Raman spectral dataset through principal component analysis (PCA) in MATLAB. Each spectrum within the dataset received a score for each PC, indicating the extent to which the spectrum followed the corresponding trend. In contrast, GBR-NMF provided a relative score for each biochemical.
Histological evaluation of pneumonitis and fibrosis
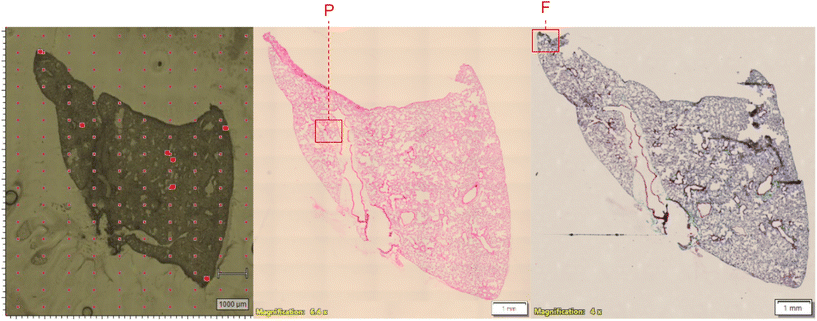
Frozen lung blocks were sectioned and stained for histological analysis at the Center for Heart and Lung Innovation at St Paul's hospital (Vancouver, BC Canada). Histology analyses were performed on 5 μm tissue sections, collected adjacent to the tissue slice used for Raman analysis. Hematoxylin and eosin (H&E) stains were used to assess pneumonitis, while Masson's trichrome stains were used to assess fibrosis. Whole slides were digitally scanned with an Olympus microscope at 4 or 6.4× magnification, and Raman sampled regions were matched based on tissue morphology and surrounding structures. Raman maps were assigned labels (N = Normal, P = Pneumonitis, F = Fibrosis) based on assessment of the corresponding histological section (Fig. 2). Pneumonitis regions were identified by thick alveolar walls and cellular infiltrate in the airspace. Fibrosis regions were identified by collapsed alveolar walls with collagen deposition.Comparative supervised machine learning analysis
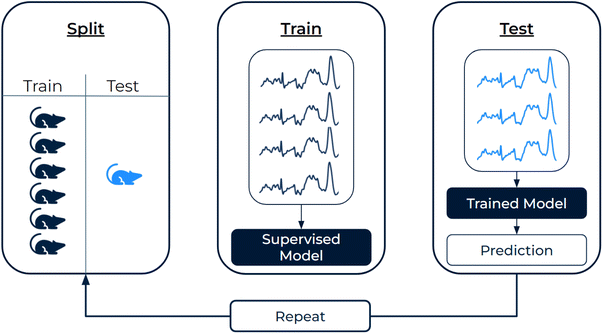
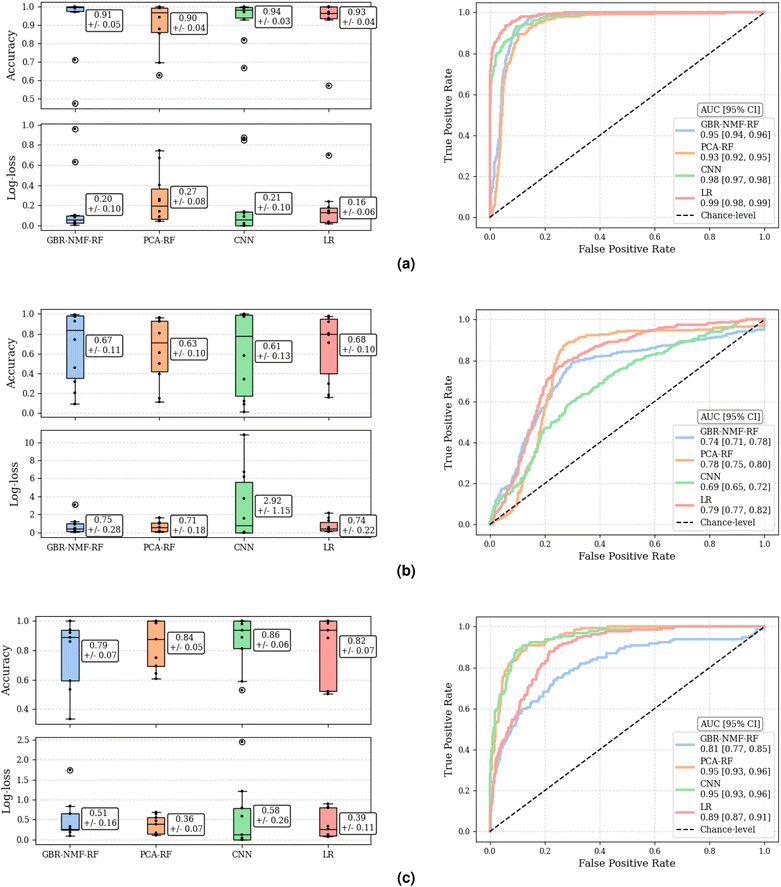
To differentiate normal/pneumonitis and normal/fibrosis tissues, we employed four different supervised learning approaches in Python. Methods 1 and 2 employed random forests to classify (1) metabolite scores derived via GBR-NMF and (2) principal component scores derived via PCA. Methods 3 and 4 classified full Raman spectra via (3) a Raman-specific CNN (full architecture shown in ESI Fig. S2†) and (4) logistic regression with L1 penalty. Random forest specifications were 200 trees, max depth = 5, max features = sqrt. The L1 penalty for logistic regression was set to C = 0.1 with solver = liblinear.Model classification performance was assessed in two ways. (1) Individual classification performance was assessed for each left-out-mouse by measure of accuracy (as some mice only contained regions from one class) and log-loss (quantifies the proximity of predicted class probability to the ground truth class label). (2) Global classification performance was assessed across all left-out-mouse predictions by measure of receiver operating characteristic (ROC) curves and area under the curve (AUC). To estimate uncertainty in global classification metrics, we implemented bootstrapping (1000 iterations) on the class probabilities for all spectra and reported 95% confidence intervals.34
Results
Classification performance
The classification performance of each methodology, assessed by accuracy and log-loss, as well as by the ROC curve and corresponding AUC, are depicted in Fig. 4. Accuracy and log-loss were calculated for each left-out-mouse individually, while ROC curves were computed globally, across all predictions for all left-out-mice, providing an overall measure of discriminant ability. There were no statistically significant differences between methodologies by measure of accuracy or log-loss as Mann–Whitney U test yielded p > 0.11, p > 0.57, and p > 0.43 for C3H pneumonitis, C57 pneumonitis, and C57 fibrosis classification tasks, respectively. Additionally, global AUC metrics indicated that no methodology was dominant across all three classification tasks. Specifically, the methodologies that achieved highest global AUCs for each classification task (considering range of 95% confidence intervals) were as follows: CNN (0.98 [0.97, 0.98]) and LR (0.99 [0.98, 0.99]) for C3H pneumonitis classification, GBR-NMF-RF (0.74 [0.71, 0.78]), PCA-RF (0.78 [0.75, 0.80]), and LR (0.79 [0.77, 0.82]) for C57 pneumonitis classification, and PCA-RF (0.95 [0.93, 0.96]) and CNN (0.95 [0.93, 0.96]) C57 fibrosis classification.Interpretation comparisons
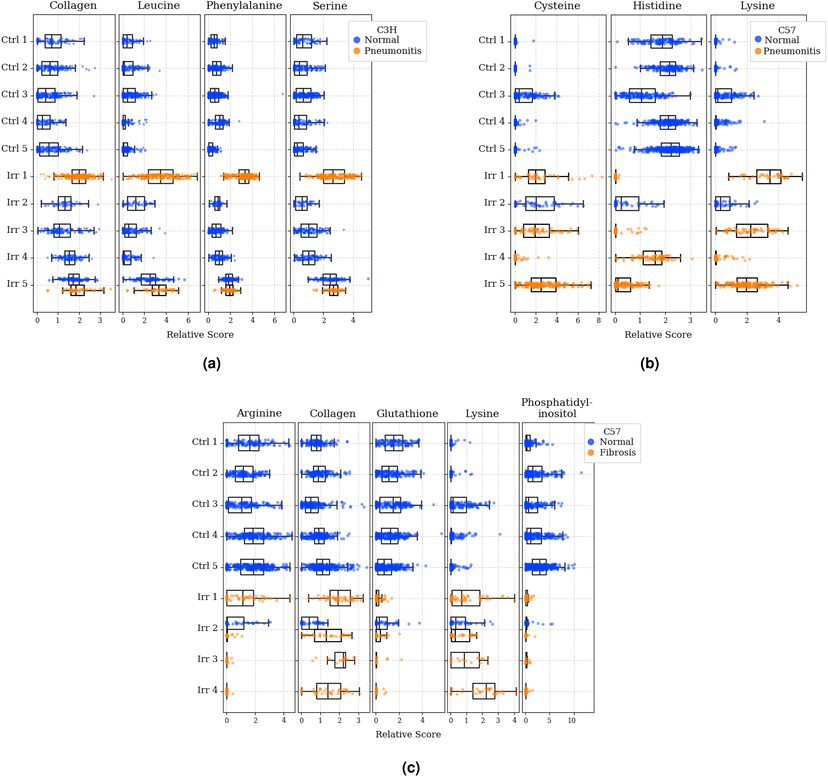
The most predictive metabolites for each classification task, as determined by GBR-NMF-RF, were: (1) collagen, leucine, phenylalanine, and serine for C3H pneumonitis classification; (2) cysteine, histidine, and lysine for C57 pneumonitis classification and (3) arginine, collagen, glutathione, lysine, and phosphatidylinositol for C57 fibrosis classification. To qualitatively present these metabolite distributions across normal and diseased tissues, we plotted density distributions of GBR-NMF scores as shown in Fig. 5. Visually, we observed that C3H mice with pneumonitis showed elevated scores for collagen, leucine, phenylalanine, and serine compared to normal mice. Considering C57 mice, generally higher cysteine and lysine scores, as well as generally lower histidine scores, were observed in 3/4 mice with pneumonitis. Additionally, we observed relatively higher collagen and lysine scores, as well as relatively lower arginine, glutathione, and phosphatidylinositol, in C57 mice with fibrosis compared to normal mice.
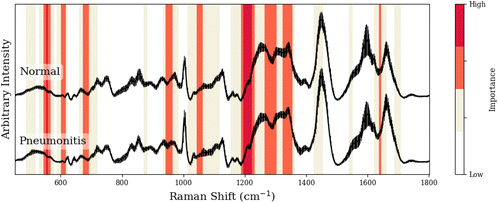
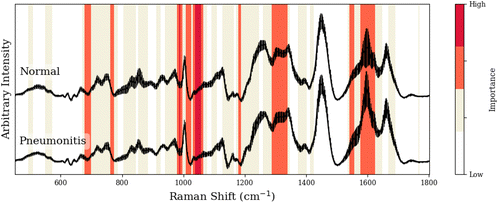
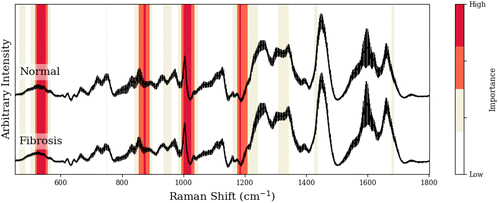
To facilitate our interpretation of CNN predictions, we compared spectral regions of high-importance for disease classification (as identified by grad-CAM heatmaps in red/dark-red of Tables 1–3) to the known spectral peaks of the most predictive metabolites identified via GBR-NMF-RF. We observed alignment between importance regions within CNN heatmaps and Raman peaks associated with these metabolites (8/9 regions for C3H pneumonitis interpretation, 5/8 regions for C57 pneumonitis interpretation, and 4/4 regions for C57 fibrosis interpretation).
| Peak (cm−1) | GBR-NMF-RF/CNN aligned peak assignment | CNN region (cm−1) | Additional assignment (non-GBR-NMF-RF) |
|---|---|---|---|
| 554, 555, 556 | — | 544–566 | Citric acid,36 lactose,36 uracil36 |
| 605, 611 | Phenylalanine,36,37 serine36,37 | 600–616 | — |
| 684 | Phenylalanine37 | 674–691 | — |
| 948, 951 | Leucine,37 phenylalanine36,37 | 940–961 | — |
| 1043 | Collagen38 | 1042–1062 | — |
| 1204–1206/1223, 1187, 1220 | Collagen,38 leucine,37 serine36,37 | 1186–1230 | — |
| 1265–1269/1278/1280/1283, 1293, 1296, 1299 | Collagen,38 phenylalanine,37 leucine,37 serine36,37 | 1263–1301 | — |
| 1322–1324/1330/1335–1345, 1326, 1342, 1343 | Collagen,38 serine,36,37 leucine,37 phenylalanine37 | 1320–1354 | — |
| 1635 | Collagen38 | 1634–1642 | — |
| Peak (cm−1) | GBR-NMF-RF/CNN aligned peak assignment | CNN region (cm−1) | Additional assignment (non-GBR-NMF-RF) |
|---|---|---|---|
| 677, 680 | Cysteine,39 histidine37 | 676–698 | — |
| 764, 765 | — | 761–766 | Isoleucine,40 methionine37 |
| 988 | Lysine | 977–996 | — |
| 1013, 1015, 1017 | — | 1005–1025 | Tryptophan,37 glutathione,36 isoleucine37 |
| 1036/1055, 1061, 1062 | Lysine,37 cysteine,41 histidine37 | 1030–1064 | — |
| 1182, 1183, 1184 | — | 1177–1187 | Glutamic acid,37 phenylalanine,36 riboflavin36 |
| 1295, 1305, 1319/1336 | Cysteine,41 lysine,37 histidine37 | 1285–1338 | — |
| 1548, 1548 | — | 1540–1554 | Proline,37 threonine37 |
| 1609 | Lysine37 | 1575–1621 | — |
| Peak (cm−1) | GBR-NMF-RF/CNN aligned peak assignment | CNN region (cm−1) | Additional assignment (non-GBR-NMF-RF) |
|---|---|---|---|
| 523, 524 | Glutathione,36 phosphatidylinositol42 | 522–549 | — |
| 855–859, 867, 877, 879 | Collagen,38 glutathione,36 lysine,37 arginine36 | 853–890 | — |
| 1002–1004, 1015 | Collagen,38,37 glutathione36 | 999–1025 | — |
| 1173/1204–1206, 1176 | Arginine,36 phosphatidylinositol43 | 1173–1206 | — |
| 1189, 1205 | Collagen,38 lysine37 | ||
Discussion
We combined a novel spectral decomposition technique (GBR-NMF) with random forest classifiers to identify metabolites associated with radiation-induced pneumonitis in C3H/C57 mice and pulmonary fibrosis in C57 mice. Moreover, we established that the GBR-NMF-RF classification performance was comparable to other machine learning methodologies within our dataset, providing support for its use as the most interpretable methodology. We also observed that CNNs highlighted spectral regions consistent with the GBR-NMF-RF identifies metabolites for classifying normal and diseased tissue states. As high-importance regions within CNN heatmaps were not exclusively attributable to the metabolites identified by GBR-NMF-RF, it is possible that other metabolites also contributed to the heatmap importance bands. Furthermore, the insights of GBR-NMF-RF were limited to the 37 metabolic bases that we specified, plus the unconstrained component. While the unconstrained component was important for the accurate reconstruction of the original spectra and the corresponding metabolic scores, individual compounds could not be interpreted from it. As such, the GBR-NMF-RF interpretation was limited to the 37 specified metabolites, but it is possible that other metabolites may also be involved in RILI.Given that collagen emerged as a prevalent feature in two classification tasks and represented the sole protein in our GBR-NMF basis spectral library, we investigated whether the addition of another protein with a similar spectrum to collagen would influence the results. We found that incorporating another protein (serum albumin from bovine) in the GBR-NMF spectral library did not affect classification performance for any classification task (within one standard error) and the metabolic score distributions remained relatively unchanged. Notably, the addition of another protein basis did not affect the selection of collagen as the most predictive fibrosis feature. However, the addition of serum albumin resulted in slight changes to the most predictive features for C3H pneumonitis predictions. Most notably, collagen was no longer selected as a top predictor by the RF model, a result that made intuitive sense as the collagen observed histologically in C3H mouse lungs did not appear to be associated with pathology of pneumonitis (ESI Fig. S3†). Regardless, this finding illustrates that the most predictive features determined with the GBR-NMF-RF pipeline can be influenced by which bases spectra are included in the modelling, and thus, is a limitation of the methodology.
Recent work by Ali-Adeeb et al. investigated Raman spectroscopy for RILI classification within a mouse model20 and our work was designed to expand upon theirs in several ways. First, we acquired Raman spectra from regions likely to be pneumonitic/fibrotic rather than by method of random sampling. Second, we implemented leave-one-out cross-validation as recommended by Guo et al.,23,33 whereas Ali-Adeeb performed 10-fold cross validation, permitting data from the same mouse to occur in both training and test sets. Thus, our reported performance is expected to better represent the generalizability (ability to predict on unseen data) of each methodology. For example, using LR, Ali-Adeeb reported accuracy metrics of 99.1% for C57 fibrosis grade classification and 89.2% for C3H pneumonitis grade classification; whereas we observed mean accuracy metrics of 82 ± 7% and 93 ± 4% for the binary classification of C57 fibrosis and C3H pneumonitis, respectively. Third, we implemented GBR-NMF-RF and CNN methods which aided to reveal metabolic associations with RILI.
Classification
GBR-NMF-RF yielded the importance of model constituents (metabolites) while demonstrating classification performance comparable to other machine learning approaches. Across all classification tasks, we found that GBR-NMF-RF performance was not different from any other methodology for individual leave-one-out-mice predictions (by measure of accuracy and log-loss with standard error). Based on AUC assessment across all left-out mice, GBR-NMF-RF was surpassed by other methods for predicting C3H pneumonitis and C57 fibrosis. Nevertheless, GBR-NMF-RF exhibited noteworthy performance in these cases, with AUC values of 0.95 and 0.81 for C3H pneumonitis and C57 fibrosis predictions, respectively, underscoring its applicability as it is the most interpretable methodology. Previous work by our group demonstrated that GBR-NMF-RF was capable of classifying radio-sensitive/-resistant cancer cell lines and interpreting metabolites,19 but classification performance was not compared to other methodologies. Here, we offer further insight regarding GBR-NMF-RF by demonstrating its comparable performance to other methodologies for individual left-out-mouse predictions. Altogether, these results provide context for the predictive ability of GBR-NMF-RF, and by extension, it's reliability in identifying disease-associated metabolites.Previous work by Fuentes et al. has shown CNNs to outperform the GBR-NMF-RF methodology for the classification of irradiated/non-irradiated breast tumor xenografts.26 Our findings extend this insight to the domain of RILI classification in mouse lung tissues through Raman spectroscopy, underscoring the greater applicability of the CNN approach. Specifically, for prediction tasks such as C3H pneumonitis and C57 fibrosis, CNNs demonstrated comparable performance to other methods for individual left-out-mouse predictions, yet surpassed GBR-NMF-RF in terms of global AUC. It is also important to acknowledge the potential for further CNN performance gains given a more comprehensive dataset, highlighting a limitation of CNNs – their data-hungry nature.
Metabolic insights
The fibrosis-associated metabolites uncovered via GBR-NMF-RF contribute valuable context to our understanding of the disease in C57 mice. The most predictive metabolites (arginine, collagen, glutathione, lysine, and phosphatidylinositol) are consistent with current literature on fibrosis. This is principally demonstrated by the presence of collagen and collagen precursors, as excessive collagen deposition is the main hallmark of fibrosis.11 The synthesis of collagen has been linked to arginine metabolism via transforming growth factor-β (TGF-β),44,45 lysine modifications,46 and phosphatidylinositol through the phosphatidylinositol 3-kinase (PI3K) signaling pathway.47 Finally, glutathione has been linked to fibrosis through mediation of the pro-fibrogenic effects of TGF-β.48 Thus, our findings offer further support for the involvement of the identified metabolites in pulmonary fibrosis. Overall, our findings indicate that by Raman profiling, radiation-induced fibrosis was largely distinguished by collagen and related precursors.While pneumonitis-metabolite associations are highly complex, GBR-NMF-RF identified biochemical constituents consistent with existing literature. Notably, through Raman profiling, we identified distinct metabolites for each of C3H and C57 pneumonitis. For C3H mice, the most predictive features of pneumonitis included leucine, phenylalanine, and serine, each of which functions in the immune/inflammatory response,49 as well as collagen. In detail, leucine is involved with immune cell activation and proliferation through the regulation of mTOR (mammalian target of rapamycin) which is essential for the development and function of immune cells.50 Phenylalanine can be converted into tyrosine, which is involved in the synthesis of neurotransmitters (norepinephrine, and epinephrine) that regulate cell metabolism and influence immune responses such as inflammation.49 Serine contributes to various cellular responses, including anti-oxidant defense,51 and is vital for cell proliferation in immune cells.52 Histological investigation revealed that collagen in C3H mice was present on intact alveolar walls, as opposed to collagen deposition associated with fibrotic scarring (ESI Fig. S3†). This finding is consistent with work done by Travis et al., wherein a positive relationship was observed between collagen and radiation dose in C3H/Kam mice, despite the lack of fibrosis development.53 As such, each metabolite identified for association with pneumonitis in C3H mice offers a potential mechanism of disease involvement that is consistent with current literature. For C57 mice, the most predictive pneumonitis metabolites included cysteine, histidine, and lysine. Cysteine is a precursor to the anti-oxidant glutathione,54,55 and thus can help maintain defense mechanisms against radiation-induced damage. Histidine, through conversion to histamine, helps regulate inflammatory and immune responses,56 suggesting modulating the pneumonitis inflammatory response. As mentioned prior, lysine is a precursor to collagen, which is essential for repair of radiation-induced tissue damage;46 therefore, the presence of lysine may be expected in a region of tissue that is transitioning between pneumonitis and fibrosis. Moreover, this highlights a potential limitation of our work in that we labelled tissue regions as either pneumonitis or fibrosis, while in reality a transitional state may exist. The identification of distinct metabolites associated with pneumonitis in C57 and C3H strains aligns with their documented differential responses to radiation, further underscoring the effect of genetic background on disease manifestation. Additionally, these results support our hypothesis that GBR-NMF-RF provides interpretable insights to pneumonitis and fibrosis, identifying metabolites consistent with existing literature and offering further support for the involvement of the identified metabolites in mice with RILI. It is important to note that these findings are specifically related to mice and are not automatically valid within the context of a human model.
Leave-one-mouse-out cross validation illustrated the challenge of model generalizability for both fibrosis and pneumonitis predictions as some mice were poorly classified. A possible reason for this is that the diseased examples were only present in a few mice, so when left out, the model was less likely to learn a generalized fibrosis-/pneumonitis-signature. This highlights the limitation that our dataset was likely not representative of all histological manifestations of RILI. It is expected that increasing the number of mice (specifically with disease) could improve the generalizability of each methodology for new fibrosis/pneumonitis predictions. Furthermore, our dataset may be considered to be weakly-labelled, as normal/disease classes were assigned for a whole region. Such labels represent a limitation within our work as some normal cells may have existed within a diseased region, leading to erroneous labels and potentially limiting performance. Finally, our work is limited as we did not present results for the binary classification task of pneumonitis/fibrosis, or the three-way classification task of normal/pneumonitis/fibrosis. While we performed preliminary investigations on these classification tasks, performance on our dataset was relatively poor across all methodologies investigated. In general, these models poorly differentiated between diseased states, which may be due to limitations within out dataset. As such, future work remains to investigate and interpret a machine learning classifier that can robustly differentiate these tissue states in a mouse model.
We observed overlap between high-importance CNN heatmap regions and Raman peaks of metabolites identified via GBR-NMF-RF, suggesting that the two methodologies have captured similar features as important for disease classification. Still, the CNN methodology identified several spectral regions that did not align with spectral features of these metabolites. This was to be expected as the CNN was trained on full spectra, permitting it to learn from all spectral features. This can be advantageous for classification performance but may pose challenges for interpretation. For instance, as a lone methodology, CNN heatmaps may be laborious to interpret with reference material as many different biomolecules may contribute signal within the wide range of high-importance values. This underscores the well-known challenge of human interpretation of deep learning models.57
Conclusions
The results of this study highlight specific RILI-associated metabolites through classification of Raman spectra with supervised machine learning. First, the utility of GBR-NMF-RF was demonstrated as it provided directly interpretable features and, for the first time from a Raman perspective, identified disease-associated metabolites consistent with current literature. Additionally, disease classification with the GBR-NMF-RF method was not statistically different than any other methodology for individual left-out-mouse predictions, lending credit to its validity. Secondly, the CNN was qualitatively interpreted through grad-CAM heatmaps, highlighting spectral regions consistent with GBR-NMF-RF identified metabolites. Notably, both methodologies demonstrated overlap for identifying the same disease-associated metabolites. Specifically, GBR-NMF-RF was useful for metabolite identification and yielded similar classification performance to other methodologies, while CNNs aided interpretation of the GBR-NMF-RF identified metabolites.Data availability
All code and data from this study are available upon reasonable request.Author contributions
MW, AJ, JL, AB, and CH conceived the experiment and experimental design. RA irradiated and supervised mice. MW, KM, and CH acquired data. MW, KM, and JB processed data. MW and AF implemented grad-CAM for the CNN. MW performed the analysis with guidance by JA. All authors reviewed the manuscript.Conflicts of interest
The authors declare no competing interests.Acknowledgements
This work was supported by grant funding from the National Sciences and Engineering Research Council of Canada Discovery Grants (grants no. RGPIN-2020-07232, RGPIN-2020-04646) and the Canadian Institutes of Health Research (PJT 162279).References
- S. K. Vinod and E. Hau, Radiotherapy treatment for lung cancer: Current status and future directions, Respirology, 2020, 25, 61–71 CrossRef PubMed.
- L. Giuranno, J. Ient, D. De Ruysscher and M. A. Vooijs, Radiation-induced lung injury (RILI), Front. Oncol., 2019, 9, 877 CrossRef PubMed.
- L. B. Marks, X. Yu, Z. Vujaskovic, W. Small Jr., R. Folz and M. S. Anscher, Seminars in radiation oncology, 2003, pp. 333–345 Search PubMed.
- A. N. Hanania, W. Mainwaring, Y. T. Ghebre, N. A. Hanania and M. Ludwig, Radiation-induced lung injury: assessment and management, Chest, 2019, 156, 150–162 CrossRef PubMed.
- C. P. Wild, B. W. Stewart and C. Wild, World cancer report 2014, World Health Organization Geneva, Switzerland, 2014 Search PubMed.
- X. Liu, C. Shao and J. Fu, Promising Biomarkers of Radiation-Induced Lung Injury: A Review, Biomedicines, 2021, 9, 1181 CrossRef CAS PubMed.
- I. Madani, K. De Ruyck, H. Goeminne, W. De Neve, H. Thierens and J. Van Meerbeeck, Predicting risk of radiation-induced lung injury, J. Thorac. Oncol., 2007, 2, 864–874 CrossRef PubMed.
- K. Fleckenstein, B. Gauter-Fleckenstein, I. L. Jackson, Z. Rabbani, M. Anscher and Z. Vujaskovic, Seminars in radiation oncology, 2007, pp. 89–98 Search PubMed.
- D. De Ruysscher, J. Jin, T. Lautenschlaeger, J.-X. She and Z. Liao, et al., Blood-based biomarkers for precision medicine in lung cancer: precision radiation therapy, Transl. Lung Cancer Res., 2017, 6, 661 CrossRef CAS PubMed.
- Y. Yan, J. Fu, R. O. Kowalchuk, C. M. Wright, R. Zhang, X. Li and Y. Xu, Exploration of radiation-induced lung injury, from mechanism to treatment: a narrative review, Transl. Lung Cancer Res., 2022, 11, 307 CrossRef CAS PubMed.
- J. Sharplin and A. J. Franko, A quantitative histological study of strain-dependent differences in the effects of irradiation on mouse lung during the intermediate and late phases, Radiat. Res., 1989, 119, 15–31 CrossRef CAS.
- A. Paun and C. K. Haston, Genomic and genome-wide association of susceptibility to radiation-induced fibrotic lung disease in mice, Radiother. Oncol., 2012, 105, 350–357 CrossRef CAS PubMed.
- L. Walkin, S. E. Herrick, A. Summers, P. E. Brenchley, C. M. Hoff, R. Korstanje and P. J. Margetts, The role of mouse strain differences in the susceptibility to fibrosis: a systematic review, Fibrog. Tissue Repair, 2013, 6, 1–12 CrossRef PubMed.
- B. B. Moore and C. M. Hogaboam, Murine models of pulmonary fibrosis, Am. J. Physiol.: Lung Cell. Mol. Physiol., 2008, 294, L152–L160 CrossRef CAS PubMed.
- S. Cui, S. Zhang and S. Yue, Raman spectroscopy and imaging for cancer diagnosis, J. Healthc. Eng., 2018, 2018, 8619342 Search PubMed.
- C. Lima, H. Muhamadali and R. Goodacre, The role of Raman spectroscopy within quantitative metabolomics, Annu. Rev. Anal. Chem., 2021, 14, 323–345 CrossRef CAS PubMed.
- E. Smith and G. Dent, Modern Raman spectroscopy: a practical approach, John Wiley & Sons, 2019 Search PubMed.
- S. J. Van Nest, L. M. Nicholson, N. Pavey, M. N. Hindi, A. G. Brolo, A. Jirasek and J. J. Lum, Raman spectroscopy detects metabolic signatures of radiation response and hypoxic fluctuations in non-small cell lung cancer, BMC Cancer, 2019, 19, 1–13 CrossRef PubMed.
- K. Milligan, X. Deng, P. Shreeves, R. Ali-Adeeb, Q. Matthews, A. Brolo, J. J. Lum, J. L. Andrews and A. Jirasek, Raman spectroscopy and group and basis-restricted non negative matrix factorisation identifies radiation induced metabolic changes in human cancer cells, Sci. Rep., 2021, 11, 1–11 CrossRef PubMed.
- R. N. Ali-Adeeb, P. Shreeves, X. Deng, K. Milligan, A. G. Brolo, J. J. Lum, C. Haston, J. L. Andrews and A. Jirasek, Raman microspectroscopy and machine learning for use in identifying radiation-induced lung toxicity, PLoS One, 2022, 17, e0279739 CrossRef CAS PubMed.
- A. Paun, A. Kunwar and C. K. Haston, Acute adaptive immune response correlates with late radiation-induced pulmonary fibrosis in mice, Radiat. Oncol., 2015, 10, 1–11 CrossRef CAS PubMed.
- F. Lussier, V. Thibault, B. Charron, G. Q. Wallace and J.-F. Masson, Deep learning and artificial intelligence methods for Raman and surface-enhanced Raman scattering, TrAC, Trends Anal. Chem., 2020, 124, 115796 CrossRef CAS.
- S. Guo, J. Popp and T. Bocklitz, Chemometric analysis in Raman spectroscopy from experimental design to machine learning–based modeling, Nat. Protoc., 2021, 16, 5426–5459 CrossRef CAS PubMed.
- F. Bonnier and H. Byrne, Understanding the molecular information contained in principal component analysis of vibrational spectra of biological systems, Analyst, 2012, 137, 322–332 RSC.
- P. Shreeves, J. L. Andrews, X. Deng, R. Ali-Adeeb and A. Jirasek, Nonnegative matrix factorization with group and basis restrictions, Stat. Biosci., 2023, 15, 608–632 CrossRef.
- A. M. Fuentes, A. Narayan, K. Milligan, J. J. Lum, A. G. Brolo, J. L. Andrews and A. Jirasek, Raman spectroscopy and convolutional neural networks for monitoring biochemical radiation response in breast tumour xenografts, Sci. Rep., 2023, 13, 1530 CrossRef CAS PubMed.
- R. Luo, J. Popp and T. Bocklitz, Deep learning for Raman spectroscopy: a review, Analytica, 2022, 3, 287–301 CrossRef.
- X. Zhang, J. Xu, J. Yang, L. Chen, H. Zhou, X. Liu, H. Li, T. Lin and Y. Ying, Understanding the learning mechanism of convolutional neural networks in spectral analysis, Anal. Chim. Acta, 2020, 1119, 41–51 CrossRef CAS PubMed.
- R. R. Selvaraju, M. Cogswell, A. Das, R. Vedantam, D. Parikh and D. Batra, Proceedings of the IEEE international conference on computer vision, 2017, pp. 618–626.
- H. J. Butler, L. Ashton, B. Bird, G. Cinque, K. Curtis, J. Dorney, K. Esmonde-White, N. J. Fullwood, B. Gardner and P. L. Martin-Hirsch, et al., Using Raman spectroscopy to characterize biological materials, Nat. Protoc., 2016, 11, 664–687 CrossRef CAS PubMed.
- P. D. McNicholas, Model-based classification using latent Gaussian mixture models, J. Stat. Plann. Inference, 2010, 140, 1175–1181 CrossRef.
- K. Milligan, K. Scarrott, J. L. Andrews, A. G. Brolo, J. J. Lum and A. Jirasek, Reconstruction of Raman Spectra of Biochemical Mixtures Using Group and Basis Restricted Non-Negative Matrix Factorization, Appl. Spectrosc., 2023, 77(7), 698–709 CrossRef CAS PubMed.
- S. Guo, T. Bocklitz, U. Neugebauer and J. Popp, Common mistakes in cross-validating classification models, Anal. Methods, 2017, 9, 4410–4417 RSC.
- B. Efron and R. J. Tibshirani, An introduction to the bootstrap, CRC press, 1994 Search PubMed.
- N. V. Chawla, K. W. Bowyer, L. O. Hall and W. P. Kegelmeyer, SMOTE: synthetic minority over-sampling technique, J. Artif. Intell. Res., 2002, 16, 321–357 CrossRef.
- J. De Gelder, K. De Gussem, P. Vandenabeele and L. Moens, Reference database of Raman spectra of biological molecules, J. Raman Spectrosc., 2007, 38, 1133–1147 CrossRef CAS.
- G. Zhu, X. Zhu, Q. Fan and X. Wan, Raman spectra of amino acids and their aqueous solutions, Spectrochim. Acta, Part A, 2011, 78, 1187–1195 CrossRef PubMed.
- Z. Movasaghi, S. Rehman and I. U. Rehman, Raman spectroscopy of biological tissues, Appl. Spectrosc. Rev., 2007, 42, 493–541 CrossRef CAS.
- N. Brandt, A. Y. Chikishev, A. Kargovsky, M. Nazarov, O. Parashchuk, D. Sapozhnikov, I. Smirnova, A. Shkurinov and N. Sumbatyan, Terahertz time-domain and Raman spectroscopy of the sulfur-containing peptide dimers: Low-frequency markers of disulfide bridges, Vib. Spectrosc., 2008, 47, 53–58 CrossRef CAS.
- B. Hernández, F. Pflüger, N. Derbel, J. De Coninck and M. Ghomi, Vibrational analysis of amino acids and short peptides in hydrated media. VI. amino acids with positively charged side chains: L-Lysine and L-Arginine, J. Phys. Chem. B, 2010, 114, 1077–1088 CrossRef PubMed.
- A. Pawlukojć, J. Leciejewicz, A. Ramirez-Cuesta and J. Nowicka-Scheibe, L-Cysteine: Neutron spectroscopy, Raman, IR and ab initio study, Spectrochim. Acta, Part A, 2005, 61, 2474–2481 CrossRef PubMed.
- C. Krafft, L. Neudert, T. Simat and R. Salzer, Near infrared Raman spectra of human brain lipids, Spectrochim. Acta, Part A, 2005, 61, 1529–1535 CrossRef PubMed.
- G. Pezzotti, Raman spectroscopy in cell biology and microbiology, J. Raman Spectrosc., 2021, 52, 2348–2443 CrossRef CAS.
- K. Kitowska, D. Zakrzewicz, M. Königshoff, I. Chrobak, F. Grimminger, W. Seeger, P. Bulau and O. Eickelberg, Functional role and species-specific contribution of arginases in pulmonary fibrosis, Am. J. Physiol.: Lung Cell. Mol. Physiol., 2008, 294, L34–L45 CrossRef CAS PubMed.
- Y. Wang, J. Zhao, H. Zhang and C.-Y. Wang, Arginine is a key player in fibroblasts during the course of IPF development, Mol. Ther., 2021, 29, 1361–1363 CrossRef CAS PubMed.
- M. Yamauchi and M. Sricholpech, Lysine post-translational modifications of collagen, Essays Biochem., 2012, 52, 113–133 CrossRef CAS PubMed.
- G. Son, I. N. Hines, J. Lindquist, L. W. Schrum and R. A. Rippe, Inhibition of phosphatidylinositol 3-kinase signaling in hepatic stellate cells blocks the progression of hepatic fibrosis, Hepatology, 2009, 50, 1512–1523 CrossRef CAS PubMed.
- R.-M. Liu and K. G. Pravia, Oxidative stress and glutathione in TGF-β-mediated fibrogenesis, Free Radicals Biol. Med., 2010, 48, 1–15 CrossRef CAS PubMed.
- P. Li, Y.-L. Yin, D. Li, S. W. Kim and G. Wu, Amino acids and immune function, Br. J. Nutr., 2007, 98, 237–252 CrossRef CAS PubMed.
- E. A. Ananieva, J. D. Powell and S. M. Hutson, Leucine metabolism in T cell activation: mTOR signaling and beyond, Adv. Nutr., 2016, 7, 798S–805S CrossRef CAS PubMed.
- K. Kurita, H. Ohta, I. Shirakawa, M. Tanaka, Y. Kitaura, Y. Iwasaki, T. Matsuzaka, H. Shimano, S. Aoe and H. Arima, et al., Macrophages rely on extracellular serine to suppress aberrant cytokine production, Sci. Rep., 2021, 11, 11137 CrossRef CAS PubMed.
- E. H. Ma, G. Bantug, T. Griss, S. Condotta, R. M. Johnson, B. Samborska, N. Mainolfi, V. Suri, H. Guak and M. L. Balmer, et al., Serine is an essential metabolite for effector T cell expansion, Cell Metab., 2017, 25, 345–357 CrossRef CAS PubMed.
- E. Travis, M. Meistrich, M. Finch-Neimeyer, T. Watkins and I. Kiss, Late functional and biochemical changes in mouse lung after irradiation: differential effects of WR-2721, Radiat. Res., 1985, 103, 219–231 CrossRef CAS PubMed.
- W. Dröge and R. Breitkreutz, Glutathione and immune function, Proc. Nutr. Soc., 2000, 59, 595–600 CrossRef PubMed.
- L. E. S. Netto, M. A. de Oliveira, G. Monteiro, A. P. D. Demasi, J. R. R. Cussiol, K. F. Discola, M. Demasi, G. M. Silva, S. V. Alves and V. G. Faria, et al., Reactive cysteine in proteins: protein folding, antioxidant defense, redox signaling and more, Comp. Biochem. Physiol., Part C: Toxicol. Pharmacol., 2007, 146, 180–193 Search PubMed.
- M. E. Brosnan and J. T. Brosnan, Histidine metabolism and function, J. Nutr., 2020, 150, 2570S–2575S CrossRef PubMed.
- S. Chakraborty, R. Tomsett, R. Raghavendra, D. Harborne, M. Alzantot, F. Cerutti, M. Srivastava, A. Preece, S. Julier, R. M. Rao, et al., 2017 IEEE smartworld, ubiquitous intelligence & computing, advanced & trusted computed, scalable computing & communications, cloud & big data computing, Internet of people and smart city innovation, 2017, pp. 1–6.
Footnote |
| † Electronic supplementary information (ESI) available. See DOI: https://doi.org/10.1039/d4an00152d |
| This journal is © The Royal Society of Chemistry 2024 |

