Boron-rich hybrid BCN nanoribbons for highly ambient uptake of H2S, HF, NH3, CO, CO2 toxic gases†
Received
1st October 2023
, Accepted 5th January 2024
First published on 9th January 2024
Abstract
Nanomaterials-based gas sensors are widely applied for the monitoring and fast detection of hazardous gases owing to their sensitivity and selectivity. Hydrogen sulfide (H2S), hydrogen fluoride (HF), ammonia (NH3), and carbon monoxide/dioxide (CO/CO2) produced from petroleum fields, sewage, mines, and gasoline are harmful for both human life and environment. With an increase in the emission of these toxic compounds, their real-time monitoring and efficient adsorbent application and storage are very necessary. To this end, we investigated the adsorption characteristic and sensitivity factor of these five toxic gases on armchair and zigzag hybrid boron-carbon-nitride (BCN) nanoribbons with/without boron-rich (B-rich) defects using first principle calculation, where 25%, 33%, and 50% carbon concentration were considered. Our findings reveal that B-rich nanoribbons have strong adsorption energy, charge transfer, and structural deformation owing to the double acceptor of B-rich defects. Moreover, the zigzag and armchair forms of these hybrid BCN nanoribbons show physical adsorption, altering their band gap and phase transition after adsorbing these toxic gases, where B-rich nanoribbons possess high sensitivity to NH3 and CO among other gases. Furthermore, B-rich hybrid nanoribbons have higher CO2 adsorption energy than the standard free energy of CO2 at room temperature. This study suggests that hybrid BCN nanoribbons and B-rich defected structures can be good candidates for the uptake and storage of toxic gases, helping experimental groups to design efficient ambient gas sensors.
1. Introduction
The detection and uptake of toxic gases have become a major problem because of their emission by thermal power plants, chemical production plants, automobiles, and diesel engines.1–8 Gas sensors have been developed for the environmental monitoring of industrial emissions; combustibles; polluted air containing odorless and colorless CO; greenhouse gases such as CO2; hydrogen sulfide (H2S) and fluorane (HF), the most toxic gases with adverse effects on human lives (injuries or fatality); as well as ammonia (NH3).9–13 The key and core parameter for efficient gas sensors is sensing materials with a high level of stability, sensitivity, and fast response speed.3,4,7,8,14 Hence, the cornerstone of revolutionary advancements in energy storage, environmental, and sustainability engineering relies on nanostructured gas adsorbent materials (GAMs).
Owing to the importance of adsorbing these toxic gases, various nanostructures have been investigated both experimentally and theoretically to detect them. One-dimensional (1-D) ZnO nanostructures have been experimentally synthesized to detect CO and H2S gases.15 SnO2 nanowires and ZnO-functionalized SnO2 nanowires are designed to detect CO and H2S gases.16 Also, other nanostructures such as CuO nanowires,17 Mg-doped In2O3 nanowires,18 ZnO-doped In2O3 nanowires,19 and NiO/TiO2 nanofibers20 have been used to detect CO gas. In2O3 nanowires21 and 1-D ZnO/ZnSO3 nanoarrays22 are among the synthesized nanostructures for H2S gas detection. To detect NH3 gas, hexagonal molybdenum oxide (h-MoO3),23 graphene nanoribbon (GNR),24 and Ag nanocrystal-functionalized multiwalled carbon nanotubes (Ag NC−MWCNTs)25 have been synthesized. TiO2 gas sensors are used to detect CO, H2S, and NH3 gases,26 while single layer SnS2 nanosheets27 and porous silicon14 are used to detect CO and HF gases, respectively.
Moreover, blue phosphorene as a common allotrope of black phosphorene has been successfully synthesized through the molecular-beam epitaxial growth method. The sp3 hybridization between P atoms causes high chemical activity in interaction with gas molecules. Safari et al.28 reported that pristine blue phosphorene is not sensitive to CO2, CO, NO, NO2, and NH3, which was significantly altered by applying electric field and doping nonmetal atom. Studies by Wang et al.29 showed that metal doping in MOFs serves as an efficient approach to increase CO2 adsorption capacity.
Boron nitride nanosheet (BNNS) is an isoelectronic analog of graphene that exhibits high thermal conductivity and excellent mechanical properties. However, the pristine BNNS with strong sp2–sp2 bonding between B and N atoms cannot efficiently adsorb and activate gas molecules. Doping atoms on BNNS improves their reactive activities and electronic properties and, which makes BNNS as a good candidate for nanostructured gas-adsorbent materials (GAM). For instance, Qu et al.30 found that pristine BNNS could not efficiently activate CO2, while boron-rich BNNS could efficiently convert CO2 to CH2. Moreover, Zhang et al.31 showed that the adsorption of CO2, H2O, CO, NO, O2, and H2 on the Mg/Ca-doped BNC system have higher adsorption energies than BN and BNC sheets.
Moreover, the surface reactivity of h-BN can be significantly improved through heteroatom chemical doping as reported by previous experimental32–34 and theoretical35–38 studies. Several reports have well stated that hybrid structures are better candidates for adsorbing toxic gases; for example, Darvishi Gilan et al.39 showed that BN–C hybrid nanoribbons are better structures than pristine BNNRs due to their tunable band gaps for adsorbing CO and NH3 toxic gases. There are several examples in this regard, C-doped h-BN nanosheets show superior catalytic activity for CO oxidation,40 N2O reduction,41 oxygen reduction,42 and SO2 oxidation;43 in fact, C doping leads to the activation of h-BN toward SO2 oxidation, which is mostly due to the localization of high spin density on the C atom.
Tables 1 and 2 represent some theoretical and experimental studies for the adsorption of different molecules on different structures, some of which are defective, hybrid, or decorated, along with their adsorption energy.28,29,44–53 Cao et al.54 showed that metal doping in metal organic frameworks (MOFs) serves as an efficient approach to increase the CO2 adsorption capacity. Xiao et al.51 realized that H2S adsorption on activated carbon (AC) and impregnated activated carbon (IAC) in fixed bed demonstrates that impregnation with Na2CO3 increases the adsorption capacity under anaerobic conditions. Small-pore zeolites (SAPO-34, SSZ-13) have potential for removing CO2 from natural gas.52 The comparison of adsorption capacities when CO2 is adsorbed on SAPO-34 zeolite and SAPO-34/graphite zeolite shows that the adsorption capacity of CO2 on the hybrid SAPO-34/graphite zeolite increases.52,53 The comparison of these adsorption energies and adsorption capacities shows that in general, defective, hybrid, and decorated structures have higher adsorption.28,44,45
Table 1 Comparison of adsorption energies of different molecules on various structures using theoretical calculations
| Material |
Detected gases |
E
ads (eV) |
Type of adsorption |
Ref. |
| Blue phosphorene |
H2S |
−0.116 |
Physisorption |
28
|
| Li-decorated blue phosphorene |
H2S |
−0.60 |
Chemisorption |
28
|
| Ni-decorated blue phosphorene |
H2S |
−0.90 |
Chemisorption |
28
|
| Pt-decorated blue phosphorene |
H2S |
−0.99 |
Chemisorption |
28
|
| BNNS |
CO2 |
−0.10 |
Physisorption |
45
|
| BNNT |
CO2 |
−0.09 |
Physisorption |
45
|
| B-rich BNNS |
CO2 |
−1.09 |
Chemisorption |
45
|
| B-rich BNNT |
CO2 |
−1.17 |
Chemisorption |
45
|
| Mg-doped BNC |
CO2 |
−0.209 |
Physisorption |
44
|
|
|
CO |
−0.202 |
Physisorption |
44
|
| Ca-doped BNC |
CO2 |
−0.374 |
Chemisorption |
44
|
|
|
CO |
−0.283 |
Physisorption |
44
|
| BN sheet |
CO2 |
−0.103 |
Physisorption |
44 and 47
|
|
|
CO |
−0.097 |
Physisorption |
44 and 47 |
|
|
NH3 |
−0.53 |
Chemisorption |
44 and 47 |
| O/BN surface (oxygen-modified BN surface) |
CO2 |
−1.36 |
Chemisorption |
46
|
| CaO monolayer |
CO2 |
−1.95 |
Chemisorption |
48
|
| Borophene/MoS2 |
CO |
−1.15 |
Chemisorption |
49
|
| CO2 |
−0.64 |
Physisorption |
49
|
| NH3 |
−1.52 |
Chemisorption |
49
|
Table 2 Comparison of adsorption capacities of different molecules on various structures via experimental calculations
| Material |
Detected gases |
Adsorption capacity |
Temperature |
Ref. |
| Mg-MOF-74 |
CO2 |
8.6 (mmol g−1) |
|
29
|
| Co-MOF-74 |
CO2 |
7.5 (mmol g−1) |
298 (K) |
29
|
| Ni-MOF-74 |
CO2 |
7.1 (mmol g−1) |
|
29
|
| MOF-177 |
CO2 |
0.8 (mmol g−1) |
|
29
|
| Activated carbon fibers |
H2S |
800 (mg g−1) |
293 (K) |
50
|
| Potassium hydroxide AC |
H2S |
65 (mg g−1) |
303 (K) |
50
|
| AC |
H2S |
2.7 (mg g−1) |
30 (°C) |
51
|
| IAC |
H2S |
9.4 (mg g−1) |
|
51
|
| SSZ-13 zeolite |
CO2 |
4.2 (mmol g−1) |
294 (K) |
52
|
| SAPO-34 zeolite |
CO2 |
3.3 (mmol g−1) |
|
52
|
| SAPO-34/graphite zeolite |
CO2 |
4.9 (mmol g−1) |
273 (K) |
53
|
In this work, by employing first principles calculation, we carry out studies on the adsorption behaviors of 5 toxic gases, including CO, CO2, H2S, HF, and NH3 on 8 types of hybrid BCN nanoribbons, where four types of which are pristine and in the other four types, we substituted a boron atom for the carbon atom, which actually made them rich in boron. The atomic configurations and adsorption energy of these molecules on hybrid BCN nanoribbons with/without B-rich were evaluated and compared. Our results reveal that the electronic properties and charge distribution of these nanoribbons are affected after different gases adsorption, appropriate for gas sensor and uptake. This study suggests the experimental utilization of hybrid BCN nanoribbons as a good gas-sensing material.
2. Computational methods
Our theoretical calculations were performed using density functional theory (DFT), as implemented in the SIESTA code. The Perdew–Burke–Ernzerhof (PBE) generalized gradient approximation (GGA) was employed to calculate the exchange–correlation energy.55 For each type of functional, a specific set of pseudopotentials was generated and tested by starting from the parameters for the GGA–PBE functional.56 We also introduced van der Waals type corrections using a functional that includes van der Waals interactions (VDW-DF). Armchair nanoribbons under our investigation have 48 atoms and their width is 6 atoms, and zigzag nanoribbons have 50 atoms and their width is 8 atoms, with a vacuum space of 30 Å along the conventional (100) and (010) directions to avoid the unwanted interaction between the periodically repeating units. To get B-rich BCN nanoribbons, we have substituted B at the C site of the BCN nanoribbons, because according to previous studies on BCN systems, the presence of holes (p-type) is energetically more favorable than the presence of electrons (n-type); so, when C atoms are replaced with B atoms in BCN systems, the structure is more stable.57 For all the studied structures, Brillouin zone integration was performed using 1 × 1 × 12 Monkhorst–pack k-point sampling after the optimization of several k-points. The convergence criteria that we used in the system includes Harris energy tolerance, Hamiltonian tolerance, and (free) energy tolerance, which are 0.000100 eV, 0.001000 eV, and 0.000100 eV, respectively. Other convergence criteria that we used in the system include Pulay mixing (Pulay mixing generally accelerates convergence quite significantly), mixing weight of the density matrix, and tolerance of density matrix, which were set at 7, 0.02, and 10−4, respectively. To calculate the charge transfer between the gas molecules and the nanoribbons, we have used the Voronoi atomic population analysis. The basis sets applied in the studied systems were double-zeta-polarized (DZP). DZP basis set provides accurate results and a relatively fast computational approach;56 therefore, the smallest basis set 7 is of DZP quality,58 and the optimized mesh cutoff energy for all nanoribbons is set at 280 Ry (see Fig. S14 in the ESI†). The adsorption energy is defined as59–61| | | Eads = Esensing material+gas − (Esensing material + Egas) | (1) |
where Esensing material+gas demonstrates the total energy of the sensing material after the adsorption of the gas molecule, and Esensing material and Egas imply the total energy of the sensing material before the adsorption of the gas molecule and the total energy of the gas molecule, respectively.62 The calculation of the stability of various nanoribbons was performed based on the prior determination of convenient chemical potentials63–65 and the formation energies of the BCN nanoribbons (Eform) is obtained according to the following equation64| |  | (2) |
where Etot is the total energy of each BCN nanoribbon, nB, nC, nN, nHB, nHC, and nHN are the number of C, B, N atoms, and H–B, H–C and H–N bonds, respectively, μB, μC, μN, μHB, μHC, and μHN are the respective chemical potentials, and nt is the total number of atoms. According to eqn (2), we obtained the formation energy of our studied nanoribbons, which are presented in Table 3. A lower (more negative) Eform means a more stable structure.57,66 Therefore, according to Table 3, among pristine nanoribbons, 8-ZBCNNR with 25%-C (Eform = −9.636 eV per atom) is the most stable and among all nanoribbons, B-rich 8-ZBCNNR with 25%-C (Eform = −10.237 eV per atom, Table 3) is the most stable. One fundamental parameter for gas sensor is their selectivity rate,62 which is expressed by sensitivity factor (SF).67| |  | (3) |
where Egi is the initial band gap before interaction and Egf is the final band gap after the interaction. To investigate the effect of temperature and pressure on the adsorption energy of gases on the substrate, we carried out ab initio molecular dynamics (AIMD), as implemented in SIESTA.
Table 3 The formation energy (Eform) of 6-ABCNNR with 50%-C, 8-ZBCNNR with 50%-C, 6-ABCNNR with 33%-C, 8-ZBCNNR with 25%-C, B-rich 6-ABCNNR with 50%-C, B-rich 8-ZBCNNR with 50%-C, B-rich 6-ABCNNR with 33%-C, and B-rich 8-ZBCNNR with 25%-C nanoribbons
| Nanoribbon |
E
form (eV per atom) |
| 6-ABCNNR with 50%-C |
−6.209 |
| 8-ZBCNNR with 50%-C |
−6.752 |
| 6-ABCNNR with 33%-C |
−7.982 |
| 8-ZBCNNR with 25%-C |
−9.636 |
| B-Rich 6-ABCNNR with 50%-C |
−6.808 |
| B-Rich 8-ZBCNNR with 50%-C |
−7.324 |
| B-Rich 6-ABCNNR with 33%-C |
−8.587 |
| B-Rich 8-ZBCNNR with 25%-C |
−10.237 |
3. Results and discussion
As mentioned, following up previous theoretical and experimental studies, which show that hybrid and defective nanostructures have large adsorption capacity than pristine structures, we create defective hybrid nanoribbons by extra boron atom, which sits at the carbon site surrounded by two carbon atoms and one nitrogen atom in hybrid BCN nanoribbons. Since nanoribbons with zigzag and armchair edges have different electronic characteristics, therefore, we study both nanoribbons. We investigate the adsorption of toxic gases on pristine nanoribbons including armchair nanoribbons with a width of 6 atoms and 50% carbon (6-ABCNNR with 50%-C), zigzag nanoribbons with a width of 8 atoms and 50% carbon (8-ZBCNNR with 50%-C), armchair nanoribbons with a width of 6 atoms and 33% carbon (6-ABCNNR with 33%-C), zigzag nanoribbons with a width of 8 atoms and 25% carbon (8-ZBCNNR with 25%-C), and defective hybrid nanoribbons including boron-rich armchair nanoribbons with a width of 6 atoms and 50% carbon (B-rich 6-ABCNNR with 50%-C), boron-rich zigzag nanoribbons with a width of 8 atoms and 50% carbon (B-rich 8-ZBCNNR with 50%-C), boron-rich armchair nanoribbons with a width of 6 atoms and 33% carbon (B-rich 6-ABCNNR with 33%-C), and boron-rich zigzag nanoribbons with a width of 8 atoms and 25% carbon (B-rich 8-ZBCNNR with 25%-C). To check the band structure, DOS, PDOS, and adsorption of toxic gases were studied on 6-ABCNNR with 33%-C, 8-ZBCNNR with 25%-C, B-rich 6-ABCNNR with 33%-C, and B-rich 8-ZBCNNR with 25%-C; refer to the (ESI†).
3.1. Analysis of the nanoribbons before the adsorption of gas molecules
The supercells and optimized structures of pristine 6-ABCNNR with 50%-C (Fig. 1(a) and (b)) and 8-ZBCNNR with 50%-C (Fig. 1(c) and (d)) are shown in Fig. 1. Also, the optimized boron-rich nanoribbons, i.e., B-rich 6-ABCNNR with 50%-C (Fig. 2(a) and (b)) and B-rich 8-ZBCNNR with 50%-C (Fig. 2(c) and (d)), can be seen in Fig. 2. In the boron-rich nanoribbons with 50% carbon, we substituted half the number of boron and nitrogen atoms of each hexagon with carbon atoms in the boron nitride nanoribbon and, in this way, we simulated boron–carbon–nitride nanoribbons with 50% carbon. The successful synthesis of boron–carbon–nitride nanoribbons has been reported previously.55 In the case of 6-ABCNNR with 50%-C, the length of C–C, B–N, C–B, and C–N bonds is 1.41 Å, 1.45 Å, 1.48 Å, and 1.39 Å, respectively. Also, in the 8-ZBCNNR with 50%-C, the length of C–C, B–N, C–B, and C–N bonds were calculated to be 1.41 Å, 1.43 Å, 1.55 Å, and 1.43 Å, respectively. But when 6-ABCNNR with 50%-C becomes boron-rich, the length of bonds changes compared to when it is pristine, i.e., in B-rich 6-ABCNNR with 50%-C, the C–C bond length becomes 1.40 Å, which means that it has decreased compared to 6-ABCNNR with 50%-C, but other bond lengths do not change. The comparison of B-rich 8-ZBCNNR with 50%-C and 8-ZBCNNR with 50%-C also shows us that in B-rich 8-ZBCNNR with 50%-C, the C–B bond length is 1.54 Å, i.e., it has decreased compared to 8-ZBCNNR with 50%-C, but the C–N bond length is 1.44 Å and has increased compared to 8-ZBCNNR with 50%-C, and the other bond lengths do not change. The length of C–B, C–N, and B–N bonds in 6-ABCNNR with 33%-C, 8-ZBCNNR with 25%-C, B-rich 6-ABCNNR with 33%-C, and B-rich 8-ZBCNNR with 25%-C is given in Table S1 in the ESI,† and in B-rich 6-ABCNNR with 33%-C and B-rich 8-ZBCNNR with 25%-C, there is also a B–B bond due to the addition of boron atom.
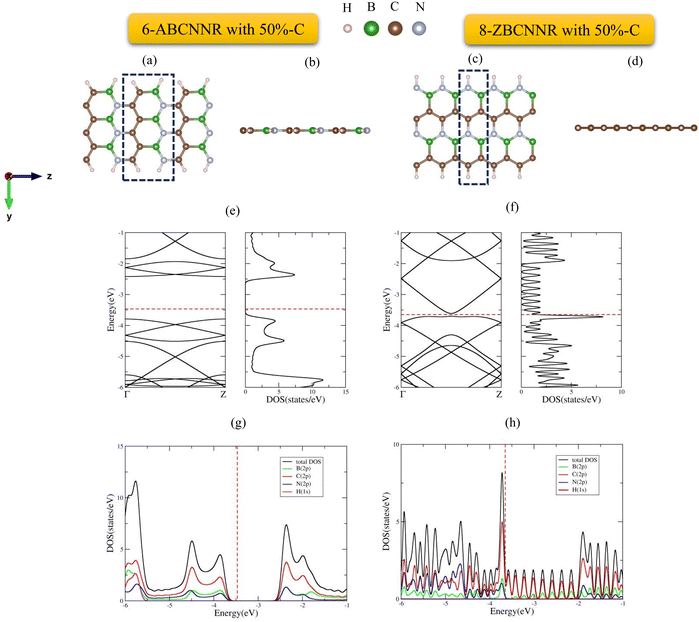 |
| | Fig. 1 Top view and side view of the geometric configurations of 6-ABCNNR with 50%-C (a) and (b) and 8-ZBCNNR with 50%-C (c) and (d), band structure and DOS of 6-ABCNNR with 50%-C (e) and 8-ZBCNNR with 50%-C (f), PDOS of 6-ABCNNR with 50%-C (g), and 8-ZBCNNR with 50%-C (h). The Fermi level is indicated by the red dashed line. | |
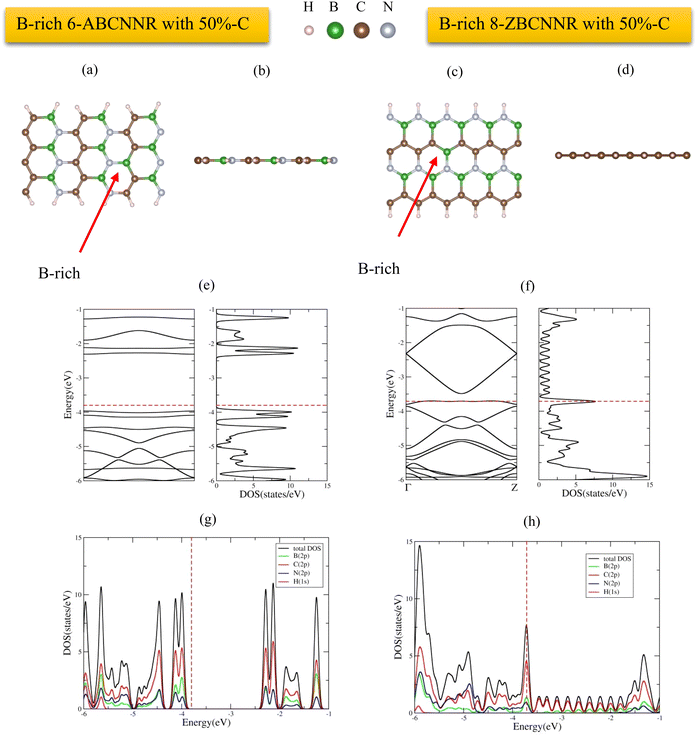 |
| | Fig. 2 Top view and side view of the geometric configurations of B-rich 6-ABCNNR with 50%-C (a) and (b) and B-rich 8-ZBCNNR with 50%-C (c) and (d), band structure and DOS of B-rich 6-ABCNNR with 50%-C (e) and B-rich 8-ZBCNNR with 50%-C (f), PDOS of B-rich 6-ABCNNR with 50%-C (g) and B-rich 8-ZBCNNR with 50%-C (h). The Fermi level is indicated by the red dashed line. | |
The electronic band structure, density of states (DOS), and projected density of states (PDOS) of 6-ABCNNR with 50%-C and 8-ZBCNNR with 50%-C are shown in Fig. 1(e)–(h). Fig. 1(e) indicates that there is a band gap of 1.365 eV (Table 4), which confirms that the 6-ABCNNR with 50%-C is a semiconductor. Additionally, Fig. 1(f) exhibits that 8-ZBCNNR with 50%-C is a semimetal because its band gap is very small and almost zero (Table 4). To determine the contribution of the different atomic orbitals of the structures, we calculated and plotted the PDOS and focused on the contribution of atomic orbitals of valence electrons. According to Fig. 1(g), the 6-ABCNNR with 50%-C behaves as a semiconductor with a forbidden region of electronic states. In addition, Fig. 1(g) shows that in the valence and conduction regions, the contribution of C (2p) states is more than the contribution of B (2p) and N (2p) states. Strong hybridization between 2p orbitals of B, C, and N atoms is observed in the valence and conduction regions. In Fig. 1(h) for 8-ZBCNNR with 50%-C, the largest contribution of the density of electron states is related to the C (2p) states, where the contribution of B (2p) and N (2p) states in the conduction region is very small. The band structure, density of states (DOS), and projected density of states (PDOS) of B-rich 6-ABCNNR with 50%-C and B-rich 8-ZBCNNR with 50%-C is shown in Fig. 2(e)–(h). When the structures are defective B-rich hybrid structures, their electrical conductivity undergoes changes. According to Fig. 2(e), in the B-rich 6-ABCNNR with 50%-C, the band gap is increased (−3.800 eV, Table 4), resulting in lower electrical conductivity. The existence of flat bands in the band structure of B-rich 6-ABCNNR with 50%-C (Fig. 2(e)) indicates the localized electronic states with zero group velocity of electrons.68 Furthermore, a phase transition occurs for 8-ZBCNNR with 50%-C, when becomes B-rich; from semimetal to metal (Table 4) (Fig. 2(f)). In Fig. 2(g), similar to Fig. 1(g), in the valence and conduction regions, the contribution of C (2p) states is more than the contribution of B (2p) and N (2p) states. Fig. 2(h) also shows that the B-rich 8-ZBCNNR with 50%-C is metal, where the density of electron states is more dominated by the C (2p) states. 6-ABCNNR with 33%-C and 8-ZBCNNR with 25%-C are semiconductors, but by adding extra boron in their configuration, they become metals (see Table S2 and Fig. S1, S2 in the ESI†). The charge density distribution of 8-ZCBNNR with 25%-C and B-rich 8-ZCBNNR with 25%-C are shown in Fig. 3(a) and (b). According to the color codes, the charge density is higher in the inner-most region (magenta) and lower in the outer most regions (red). More charge density is observed around nitrogen (Fig. 3(a) and (b)) because the electronegativity of nitrogen atom is more than that of boron and carbon atoms. To investigate the dynamic stability, the phonon spectrum is calculated and plotted in Fig. 4(a) and (b) for 6-ABCNNR with 50%-C and 8-ZBCNNR with 50%-C, respectively. The phonon spectrum of these structures reveals no negative frequencies in the diagrams, confirming the dynamic stability of hybrid BCN nanoribbons. We also investigated the thermodynamic stability. To peruse the thermodynamic stability, we used ab initio molecular dynamics (AIMD) simulation in SIESTA and set the desired temperature to 600 K. Our results in Fig. 4(c) and (d) showed that 6-ABCNNR with 50%-C and 8-ZBCNNR with 50%-C remain stable up to a temperature above 600 K, and no bonds are broken.
Table 4 Fermi energy (EF), energy band gap (Eg), and electrical conductivity of 6-ABCNNR, 8-ZBCNNR, B-rich 6-ABCNNR, and B-rich 8-ZBCNNR with 50%-C before gas molecule adsorption
| Substrate (with 50%-C) |
E
F (eV) |
E
g (eV) |
Electrical conductivity |
| 6-ABCNNR |
−3.469 |
1.365 |
Semiconductor |
| 8-ZBCNNR |
−3.650 |
~ 0 |
Semimetal |
| B-rich 6-ABCNNR |
−3.800 |
1.654 |
Semiconductor |
| B-rich 8-ZBCNNR |
−3.713 |
0 |
Metal |
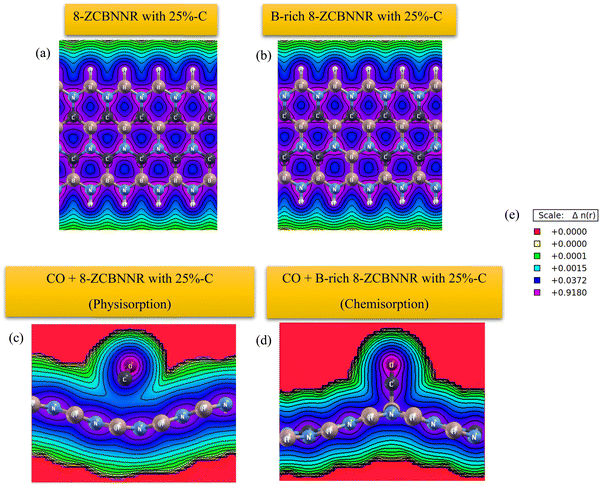 |
| | Fig. 3 Charge density distribution of 8-ZCBNNR with 25%-C (a), B-rich 8-ZCBNNR with 25%-C (b), CO molecule adsorbed on 8-ZCBNNR with 25%-C (physisorption) (c), and CO molecule adsorbed on B-rich 8-ZCBNNR with 25%-C (chemisorption) (d). Charge density color codes (e) and the color scale is in e Å−3. | |
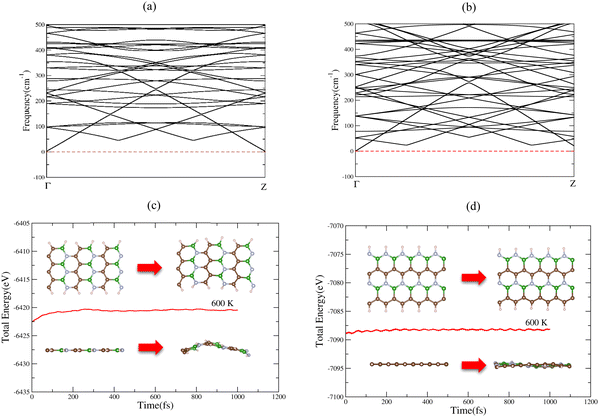 |
| | Fig. 4 Phonon dispersion spectrum of 6-ABCNNR with 50%-C (a) and 8-ZBCNNR with 50%-C (b), time evolution of total energy of 6-ABCNNR with 50%-C (c) and 8-ZBCNNR with 50%-C (d) during the AIMD simulations at a high temperature of 600 K. | |
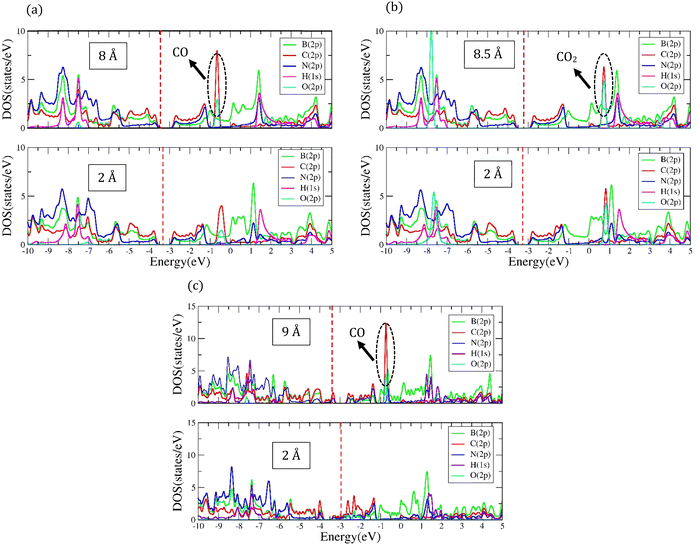 |
| | Fig. 5 Comparison of the density of electronic states of orbitals after the molecule adsorption at the distance of 2 Å and at a distance where the adsorption energy is almost zero: (a) PDOS of CO molecule adsorbed on 8-ZCBNNR with 25%-C at the distance of 2 Å (bottom figure) and at a distance (8 Å) where the adsorption energy is almost zero (top figure), (b) PDOS of CO2 molecule adsorbed on 8-ZCBNNR with 25%-C at the distance of 2 Å (bottom figure) and at a distance (8.5 Å) where the adsorption energy is almost zero (top figure), and (c) PDOS of CO molecule adsorbed on B-rich 8-ZCBNNR with 25%-C at the distance of 2 Å (bottom figure) and at a distance (9 Å) where the adsorption energy is almost zero (top figure), The Fermi level is indicated by the red dashed line. | |
Furthermore, to investigate and analyze the adsorption of toxic gas molecules on the nanoribbons, we consider the molecules at different sites of the nanoribbons, including the hollow-center (center of hexagon), bridge-center (center of C–C bond, center of B–N bond, center of C–B bond, center of C–N bond, and center of B–B bond), B-top, N-top and C-top sites, and finally selected the most stable ones in terms of energy. It should also be mentioned that we place the molecules at a distance of 2 Å above the substrates (nanoribbons) and investigate the adsorption of molecules at this distance. To check the adsorption of CO and NH3 molecules on 8-ZBCNNR with 25%-C at a longer distance (3 Å), see Fig. S13 and Tables S14–S17 in ESI.†
3.2. CO molecule adsorption
The most stable adsorption configuration of CO molecule before and after adsorption is shown in Fig. 6(a)–(p), which is the hollow-center for the 6-ABCNNR with 50%-C (Fig. 6(a)–(d)), B-rich 6-ABCNNR with 50%-C (Fig. 6(i)–(l)) and B-rich 8-ZBCNNR with 50%-C (Fig. 6(m)–(p)), and the bridge-center (center of C–C bond) for the 8-ZBCNNR with 50%-C (Fig. 6(e)–(h)). The most stable adsorption configuration of CO molecule before and after adsorption on 6-ABCNNR with 33%-C, 8-ZBCNNR with 25%-C, B-rich 6-ABCNNR with 33%-C and B-rich 8-ZBCNNR with 25%-C is shown in Fig. S3 in the ESI.† The changes of bond length (average the length of bonds of the molecule), adsorption distance of nearest-neighbor atoms of adsorption site and charge transfer between CO molecule and substrate (the sign “−“ means that the molecule is the acceptor of the charge and the sign “+” means the molecule is the donor of the charge), as well as the adsorption energy after adsorption are summarized in Table 5, where these parameters for nanoribbons with 25% and 33% carbon are given in Table S3 in the ESI.† The adsorption energy of molecules is calculated using eqn (1). Before adsorption, the CO molecule bond length is 1.145 Å and after adsorption on all nanoribbons, its bond length slightly increases, and the largest bond length occurs after CO molecule adsorption on 8-ZBCNNR with 50%-C (1.152 Å, Table 5). In addition, after CO molecule adsorption on all nanoribbons, the adsorption distance of the nearest-neighbor atom of the adsorption site between CO molecule and substrate increases, where the CO molecule moves away from the substrate. The maximum (from 2.122 Å to 2.848 Å, Table 2) and minimum (from 2.460 Å to 2.813 Å, Table 5) of this distance belong to the CO molecule adsorption on 8-ZBCNNR with 50%-C and 6-ABCNNR with 50%-C substrates, respectively. The highest adsorption energy of the CO molecule is on B-rich 6-ABCNNR with 50%-C (−1.531 eV, Table 5), and the lowest adsorption energy is on 8-ZBCNNR with 50%-C (−0.453 eV, Table 5). After the interaction between the molecule and the nanoribbon, due to the charge transfer, creation of a bond between the adsorbate and substrate, or the repulsion between them, a structural deformation is revealed. Table 6 shows the structural deformation of the nanoribbons after CO molecule adsorption, where B-rich 6-ABCNNR with 50%-C (1.395 Å) shows the highest structural deformation and 8-ZBCNNR with 50%-C and B-rich 8-ZBCNNR with 50%-C (0.502 Å) exhibits the lowest one. The structural deformation for nanoribbons with 25% and 33% carbon after CO molecule adsorption is listed in Table S4 in the ESI.†Fig. 7(a)–(d) shows the band structure and DOS of nanoribbons after CO molecule adsorption. The band gap of 6-ABCNNR with 50%-C, 8-ZBCNNR with 50%-C, and B-rich 8-ZBCNNR with 50%-C after the CO molecule adsorption are not different from before adsorption, but the band gap of B-rich 6-ABCNNR with 50%-C decreases (1.584 eV, Table 6), leading to larger electrical conductivity. The opening/closing band gap are related to charge transfer and structural deformation, leading to broken symmetry. A previous study stated that charge transfer between the adsorbate and substrate and orbital mixing due to structural deformation affect the electronic and adsorption energy, which confirm phase transition.69–71Table 5 describes that a small charge transfer occurs between CO molecule and all the nanoribbons; the highest charge transfer is between 8-ZBCNNR with 50%-C and CO molecule (−0.031 e) and the lowest one is between B-rich 6-ABCNNR with 50%-C; among the B-rich 8-ZBCNNR with 50%-C and the CO molecule (−0.024 e), the CO molecule behaves as an electron acceptor. After gas molecule adsorption, Fermi energy shift appears due to charge transfer between nanoribbons and gas molecules (Table 3). The comparison of the DOSs of Fig. 1(e), (f), 2(e), (f) and Fig. S1(e) (f) (ESI†) (before CO molecule adsorption) with DOSs of Fig. 6(a)–(d) and Fig. S4(a), (b) (ESI†) (after CO molecule adsorption) shows that insignificant changes occur far from the Fermi level in the conduction and valence regions, and these changes are due to small orbital mixing, confirming the results obtained from the band structure (side figure). But the comparison of the DOS of Fig. S2(e) and (f) (ESI†) (before CO molecule adsorption) with DOSs of Fig. S4(c) and (d) (ESI†) (after CO molecule adsorption) shows that significant changes occur in the DOS near the Fermi level. For instance, in Fig. S4(d) (ESI†), the significant oscillations of peak intensity of the DOS around the Fermi level is because of orbital mixing between the CO molecules and substrate as well as charge transfer (chemisorption), which is very different from Fig. S2(f) (ESI†). Fig. 7(e)–(h) indicates the PDOS of nanoribbons after CO molecule adsorption. Because the charge transfer between CO molecule and the nanoribbons is small, the PDOS of the structures before and after CO molecule adsorption only has slight changes. As it is clear from Fig. 7(e)–(h), the density of electronic states of O (2p) is negligible compared to B (2p), N (2p), and C (2p) states around the Fermi energy (the valence and conduction regions), and this also confirms the small amount of charge transfer between the CO molecule and nanoribbons. Comparing the band structures and DOS of the nanoribbons before (Fig. 1(e), (f) and 2(e), (f)) and after (Fig. 7(a)–(d)) the molecule adsorption explains that they are not much different around the Fermi energy, and this indicates the physical adsorption (physisorption) of the CO molecule. The slight changes in the band structures and DOSs after CO molecule adsorption can be attributed to structural deformation. The band structure, DOS, and PDOS of CO molecule adsorbed on nanoribbons with 25% and 33% carbon is shown in Fig. S4 in the ESI.† The charge density distribution of the CO molecule adsorbed on 8-ZCBNNR with 25%-C (physisorption) and CO molecule adsorbed on B-rich 8-ZCBNNR with 25%-C (chemisorption) are shown in Fig. 3(c) and (d). In CO molecule, by considering the larger electronegativity of O atoms, the larger charge density appears around O atoms than C atoms (Fig. 3(c) and (d)). A strong interaction between the CO molecule and B-rich 8-ZCBNNR with 25%-C can be observed in Fig. 3(d), leading to chemisorption. As shown in Fig. 3(c) and (d), in the region between the CO molecule and B-rich 8-ZCBNNR with 25%-C where the bond between the CO molecule and B-rich 8-ZCBNNR with 25%-C is created, there is a larger charge density than where the CO molecule is physically adsorbed on 8-ZCBNNR with 25%-C. Therefore, according to the charge density diagram, it is possible to understand the physical and chemical nature of adsorption. To investigate the contribution of the density of electronic states of the orbitals after CO molecule adsorption on 8-ZBCNNR with 25%-C and B-rich 8-ZBCNNR with 25%-C at a distance of 2 Å and at a distance of 8 Å (for 8-ZBCNNR with 25%-C), 9 Å (for B-rich 8-ZBCNNR with (25%-C)) where the adsorption energy is almost zero (there is no adsorption between the molecule and the nanoribbon), we compare their PDOS, as depicted in Fig. 5. We find that by locating the molecule at the distance of 8 Å and 9 Å, there is practically no adsorption between the molecule and the nanoribbon, and the intensity of the peak corresponding to the density of electronic states of the 2p orbitals of the O atom and C atom are much larger than the adsorption of the molecule at a distance of 2 Å as a conclusion of the strong interaction of the molecule with the nanoribbon. Fig. 5(a) and (c) reveals that significant charge transfer happens between the CO molecule and B-rich 8-ZCBNNR with 25%-C. The comparison of Fig. 5(a) and (c) shows that the intensity of the peak related to the CO orbitals after the adsorption on B-rich 8-ZCBNNR with 25%-C at a distance of 2 Å has decreased much more than of its pristine structure, supporting significant charge transfer, strong interaction, and chemical adsorption of CO molecule on B-rich 8-ZCBNNR with 25%-C, which is attributed to B-doping and its double-acceptor character.
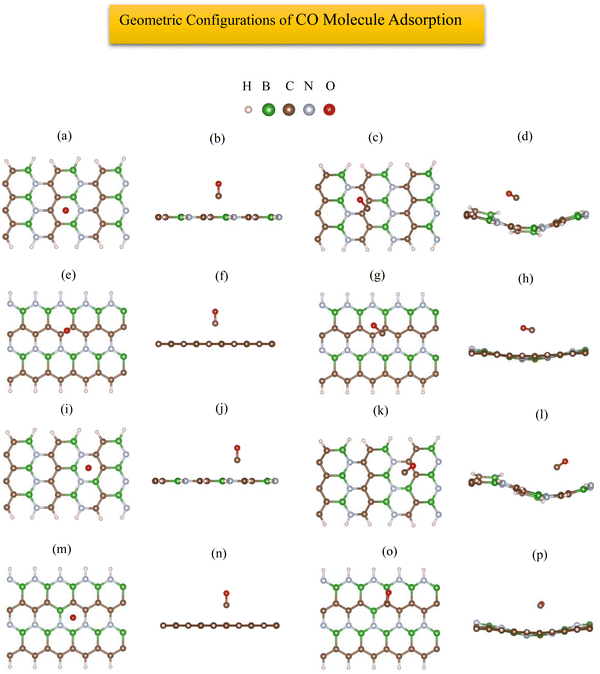 |
| | Fig. 6 Top view and side view of the geometric configurations of CO molecule on 6-ABCNNR with 50%-C before (a) and (b) and after (c) and (d) optimization, 8-ZBCNNR with 50%-C before (e) and (f) and after (g) and (h) optimization, B-rich 6-ABCNNR with 50%-C before (i) and (j) and after (k) and (l) optimization, B-rich 8-ZBCNNR with 50%-C before (m) and (n) and after (o) and (p) optimization. | |
Table 5 CO, CO2, H2S, HF, and NH3 molecules adsorbed on 6-ABCNNR, 8-ZBCNNR, B-rich 6-ABCNNR, and B-rich 8-ZBCNNR with 50%-C: the bond length of gas molecule (L), adsorption distance of nearest-neighbor atoms between the gas molecule and substrate (D), the angle of gas molecule (α), charge transfer between gas molecule and substrate (ΔQ), and adsorption energy (Eads)
| Molecule |
Substrate (with 50%-C) |
L (Å) |
D (Å) |
α (°) |
ΔQ (e) |
E
ads (eV) |
Type of adsorption |
| Before |
After |
Before |
After |
Before |
After |
| CO |
6-ABCNNR |
1.145 |
1.152 |
2.460 |
2.813 |
|
— |
−0.027 |
−1.278 |
Physisorption |
| 8-ZBCNNR |
1.145 |
1.148 |
2.122 |
2.848 |
|
— |
−0.031 |
−0.453 |
Physisorption |
| B-rich 6-ABCNNR |
1.145 |
1.150 |
2.440 |
2.810 |
— |
— |
−0.024 |
−1.531 |
Physisorption |
| B-rich 8-ZBCNNR |
1.145 |
1.150 |
2.485 |
2.901 |
|
— |
−0.024 |
−0.558 |
Physisorption |
|
|
| CO2 |
6-ABCNNR |
1.178 |
1.179 |
2.459 |
2.960 |
|
178.955 |
+0.005 |
−1.354 |
Physisorption |
| 8-ZBCNNR |
1.178 |
1.179 |
2.458 |
2.961 |
|
178.626 |
−0.007 |
−0.542 |
Physisorption |
| B-rich 6-ABCNNR |
1.178 |
1.179 |
2.013 |
2.797 |
180 |
178.018 |
+0.005 |
−1.58 |
Physisorption |
| B-rich 8-ZBCNNR |
1.178 |
1.179 |
2.000 |
3.123 |
|
179.380 |
−0.001 |
−0.576 |
Physisorption |
|
|
| H2S |
6-ABCNNR |
1.371 |
1.371 |
3.215 |
3.042 |
|
92.389 |
−0.011 |
−1.281 |
Physisorption |
| 8-ZBCNNR |
1.371 |
1.370 |
2.468 |
3.297 |
|
91.462 |
+0.018 |
−0.389 |
Physisorption |
| B-rich 6-ABCNNR |
1.371 |
1.372 |
2.440 |
3.149 |
92.033 |
91.291 |
+0.025 |
−1.507 |
Physisorption |
| B-rich 8-ZBCNNR |
1.371 |
1.371 |
2.460 |
3.186 |
|
91.424 |
+0.003 |
−0.500 |
Physisorption |
|
|
| HF |
6-ABCNNR |
0.929 |
0.942 |
3.278 |
2.186 |
|
— |
−0.072 |
−1.351 |
Physisorption |
| 8-ZBCNNR |
0.929 |
0.930 |
2.468 |
2.693 |
|
— |
+0.025 |
−0.391 |
Physisorption |
| B-rich 6-ABCNNR |
0.929 |
0.947 |
3.246 |
2.045 |
— |
— |
−0.081 |
−1.619 |
Physisorption |
| B-rich 8-ZBCNNR |
0.929 |
0.942 |
3.280 |
2.119 |
|
— |
−0.082 |
−0.648 |
Physisorption |
|
|
| NH3 |
6-ABCNNR |
1.041 |
1.042 |
2.486 |
2.708 |
|
106.368 |
+0.06 |
−1.366 |
Physisorption |
| 8-ZBCNNR |
1.041 |
1.045 |
2.000 |
1.770 |
|
108.784 |
+0.384 |
−0.651 |
Physisorption |
| B-rich 6-ABCNNR |
1.041 |
1.045 |
2.440 |
1.753 |
105.506 |
109.402 |
+0.365 |
−1.676 |
Physisorption |
| B-rich 8-ZBCNNR |
1.041 |
1.044 |
2.000 |
1.769 |
|
108.384 |
+0.389 |
−0.573 |
Physisorption |
Table 6 Fermi energy (EF), energy band gap (Eg), structural deformation (Δ), and electrical conductivity of 6-ABCNNR, 8-ZBCNNR, B-rich 6-ABCNNR, and B-rich 8-ZBCNNR with 50%-C after CO, CO2, H2S, HF, and NH3 molecules adsorption
| Molecule |
Substrate (with 50%-C) |
E
F (eV) |
E
g (eV) |
Δ (Å) |
Electrical conductivity |
| CO + |
6-ABCNNR |
−3.381 |
1.365 |
1.069 |
Semiconductor |
| 8-ZBCNNR |
−3.700 |
∼0 |
0.502 |
Semimetal |
| B-rich 6-ABCNNR |
−3.750 |
1.584 |
1.395 |
Semiconductor |
| B-rich 8-ZBCNNR |
−3.782 |
0 |
0.502 |
Metal |
|
|
| CO2 + |
6-ABCNNR |
−3.254 |
1.374 |
0.956 |
Semiconductor |
| 8-ZBCNNR |
−3.660 |
∼0 |
0.386 |
Semimetal |
| B-rich 6-ABCNNR |
−3.700 |
1.576 |
1.409 |
Semiconductor |
| B-rich 8-ZBCNNR |
−3.747 |
0 |
0.527 |
Metal |
|
|
| H2S + |
6-ABCNNR |
−3.550 |
1.409 |
0.499 |
Semiconductor |
| 8-ZBCNNR |
−3.670 |
∼0 |
0.352 |
Semimetal |
| B-rich 6-ABCNNR |
−3.650 |
1.558 |
1.386 |
Semiconductor |
| B-rich 8-ZBCNNR |
−3.746 |
0 |
0.502 |
Metal |
|
|
| HF + |
6-ABCNNR |
−3.700 |
1.409 |
1.000 |
Semiconductor |
| 8-ZBCNNR |
−3.556 |
∼0 |
0.049 |
Semimetal |
| B-rich 6-ABCNNR |
−3.850 |
1.645 |
1.467 |
Semiconductor |
| B-rich 8-ZBCNNR |
−3.916 |
0 |
0.494 |
Metal |
|
|
| NH3 + |
6-ABCNNR |
−3.500 |
1.400 |
0.989 |
Semiconductor |
| 8-ZBCNNR |
−3.370 |
0.131 |
0.521 |
Semiconductor |
| B-rich 6-ABCNNR |
−3.450 |
1.610 |
1.419 |
Semiconductor |
| B-rich 8-ZBCNNR |
−3.379 |
0 |
0.574 |
Metal |
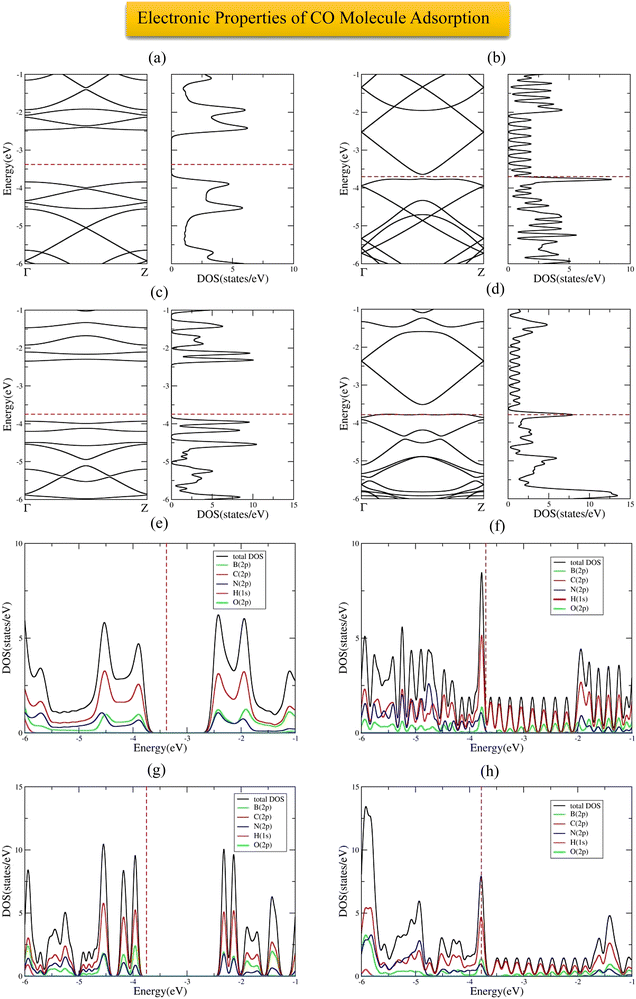 |
| | Fig. 7 Band structure and DOS of CO molecule adsorbed on 6-ABCNNR with 50%-C (a), 8-ZBCNNR with 50%-C (b), B-rich 6-ABCNNR with 50%-C (c), B-rich 8-ZBCNNR with 50%-C (d). PDOS of CO molecule adsorbed on 6-ABCNNR with 50%-C (e), 8-ZBCNNR with 50%-C (f), B-rich 6-ABCNNR with 50%-C (g), and B-rich 8-ZBCNNR with 50%-C (h). The Fermi level is indicated by the red dashed line. | |
3.3. CO2 molecule adsorption
The most stable adsorption configuration of CO2 molecule before and after adsorption is shown in Fig. 8(a)–(p), which is the bridge-center (center of C–C bond) for the 6-ABCNNR with 50%-C (Fig. 6(a)–(d)) and 8-ZBCNNR with 50%-C (Fig. 8(e)–(h)), hollow-center for B-rich 6-ABCNNR with 50%-C (Fig. 8(i)–(l)), and the top of B atom (B atom replacing C atom) for the B-rich 8-ZBCNNR with 50%-C (Fig. 8(m)–(p)). The most stable adsorption configuration of CO2 molecule before and after adsorption on 6-ABCNNR with 33%-C, 8-ZBCNNR with 25%-C, B-rich 6-ABCNNR with 33%-C, and B-rich 8-ZBCNNR with 25%-C is shown in Fig. S5 in the ESI.† The changes in the bond length (average length of bonds of the molecule), adsorption distance of nearest-neighbor atom of adsorption site and CO2 molecule, charge transfer between CO2 molecule and substrate, the angle of CO2 molecule (average angles in the molecule), and adsorption energy after adsorption are summarized in Table 5, and these parameters after adsorption on nanoribbons with 25% and 33% carbon are presented in Table S5 in the ESI.† Before CO2 molecule adsorption, the average length of bonds is 1.178 Å and after adsorption on all nanoribbons, it slightly increases (1.179 Å, Table 5). Before adsorption, the CO2 bond angle is 180°, but after the interaction with all the nanoribbons, this angle decreases and the smallest angle belongs to CO2 molecule adsorption on B-rich 6-ABCNNR with 50%-C (178.018°, Table 5). After CO2 molecule adsorption on all substrates, the adsorption distance of the nearest-neighbor atoms of the adsorption site and CO2 molecule increases, where the adsorbate moves away from the substrate. The maximum (from 2.0 Å to 3.123 Å, Table 5) and minimum (from 2.459 Å to 2.960 Å, Table 5) of this distance belong to CO2 molecule adsorption on B-rich 8-ZBCNNR with 50%-C and 6-ABCNNR with 50%-C substrates, respectively. Similar to CO molecule, the highest adsorption energy of CO2 molecule is on B-rich 6-ABCNNR with 50%-C (−1.582 eV, Table 5) and the lowest adsorption energy is on 8-ZBCNNR with 50%-C (−0.542 eV, Table 5). Table 6 shows the structural deformation of the nanoribbons after CO2 molecule adsorption, the highest of which is related to B-rich 6-ABCNNR with 50%-C (1.409 Å) and the lowest is related to 8-ZBCNNR with 50%-C (0.386 Å). The structural deformation for nanoribbons with 25% and 33% carbon after CO2 molecule adsorption is listed in Table S6 in the ESI.†Fig. 9(a)–(d) shows us the band structure and DOS of nanoribbons after CO2 molecule adsorption. The band gap of 8-ZBCNNR with 50%-C and B-rich 8-ZBCNNR with 50%-C after CO2 molecule adsorption are not different from that before CO2 molecule adsorption and are still metal and semimetal, respectively. But the band gap of B-rich 6-ABCNNR with 50%-C decreases (1.576 eV, Table 6) and its electrical conductivity improves, while the band gap of 6-ABCNNR with 50%-C increases (1.374 eV, Table 6), leading to lower electrical conductivity. Table 5 describes that a negligible charge transfer occurs between CO2 molecule and all the nanoribbons, the highest charge transfer is between 8-ZBCNNR with 50%-C and CO2 molecule (−0.007 e), and the lowest charge transfer is between B-rich 8-ZBCNNR with 50%-C and CO2 molecule (−0.001 e). When the CO2 molecule is adsorbed on 6-ABCNNR with 50%-C and B-rich 6-ABCNNR with 50%-C, it behaves as the electron donor, and when it is adsorbed on 8-ZBCNNR with 50%-C and B-rich 8-ZBCNNR with 50%-C, it becomes the electron acceptor. The Fermi energy shift happens due to the charge transfer between the nanoribbons and CO2 molecule (Table 6). The adsorption of CO2 on all nanoribbons is physical adsorption, so there are no specific changes in the band structure and in the DOS, and we only see a series of very small oscillations in the regions far from the Fermi level in the conduction and valence regions (comparison of Fig. 1(e), (f), 2(e), (f) and Fig. S1(e), (f), S2(e), (f) (ESI†) (before CO2 molecule adsorption) with Fig. 8(a)–(d) and Fig. S6(a)–(d) (ESI†) (after CO2 molecule adsorption)). Fig. 9(e)–(h) exhibits the PDOS of nanoribbons after CO2 molecule adsorption. Because the charge transfer between CO2 molecule and the nanoribbons is negligible, the PDOS of the structures before and after CO2 molecule adsorption are not drastically different. Similar to CO molecule, it can be clearly seen from Fig. 9(e)–(h) that the density of electronic states of the O (2p) state is negligible compared to B (2p), N (2p), and C (2p) states around the Fermi energy (the valence and conduction regions), and this also confirms a small amount of charge transfer between CO2 molecule and nanoribbons. The comparison of the band structure and DOS of nanoribbons before (Fig. 1(e), (f) and 2(e), (f)) and after (Fig. 9(a)–(d)) CO2 molecule adsorption shows a very small difference due to the structural deformation, but due to this small difference and negligible charge transfer, the CO2 molecule adsorption is physical. The band structure, DOS, and PDOS of CO2 molecule adsorbed on nanoribbons with 25% and 33% carbon is shown in Fig. S6 in the ESI.† Comparing the density of electronic states of orbitals after CO2 molecule adsorption on 8-ZBCNNR with 25%-C at a distance of 2 Å and at a distance (8 Å), the adsorption energy is almost zero (see Fig. 5(b)). Among native defects such as vacancies and Stone Wales, we focus on extra boron atom, which sits at the carbon site surrounded by two carbon atoms and one nitrogen atom. In fact, the double-acceptor state of the boron-doped hybrid structure can break the C![[double bond, length as m-dash]](https://www.rsc.org/images/entities/char_e001.gif) O double bond of a CO2 molecule, where this type of interaction is similar to the finding of Choi et al.72 Furthermore, to investigate the effect of B-doping, which leads to an increase in the adsorption energy, we plotted and analyzed the PDOS (Fig. 4) and charge density (Fig. 3), which explains the details of the variation of adsorption energy and orbital contribution.
O double bond of a CO2 molecule, where this type of interaction is similar to the finding of Choi et al.72 Furthermore, to investigate the effect of B-doping, which leads to an increase in the adsorption energy, we plotted and analyzed the PDOS (Fig. 4) and charge density (Fig. 3), which explains the details of the variation of adsorption energy and orbital contribution.
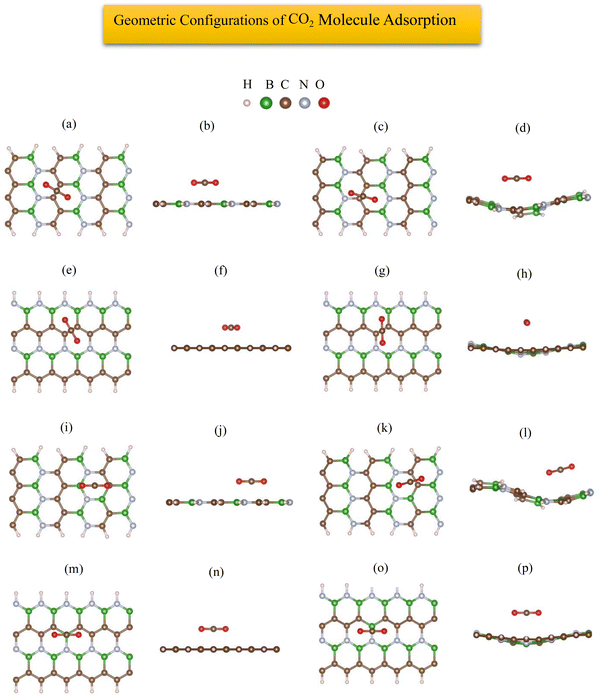 |
| | Fig. 8 Top view and side view of the geometric configurations of CO2 molecule on 6-ABCNNR with 50%-C before (a) and (b) and after (c) and (d) optimization, 8-ZBCNNR with 50%-C before (e) and (f) and after (g) and (h) optimization, B-rich 6-ABCNNR with 50%-C before (i) and (j) and after (k) and (l) optimization, B-rich 8-ZBCNNR with 50%-C before (m) and (n) and after (o) and (p) optimization. | |
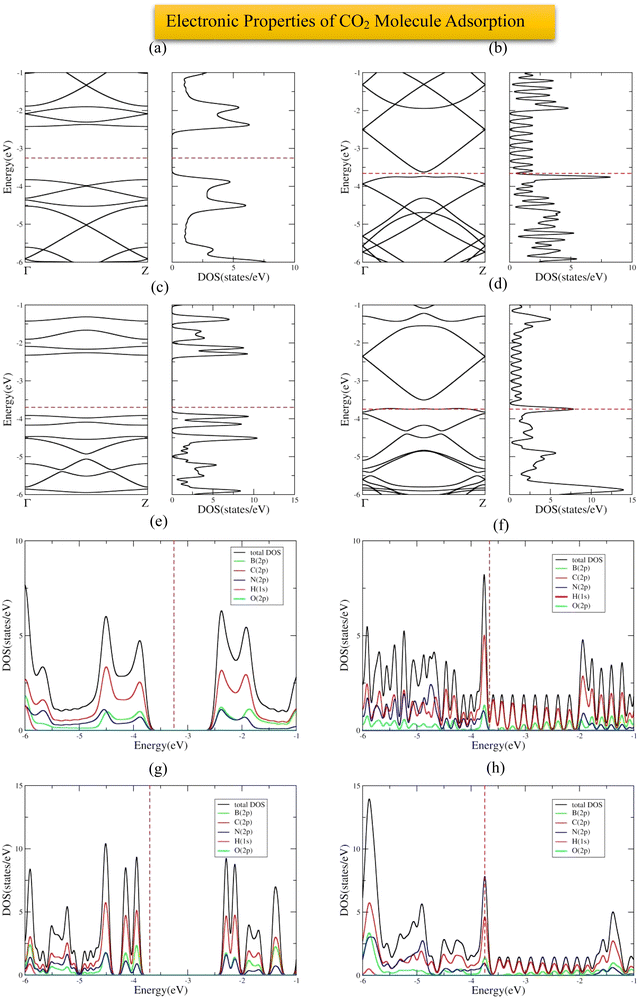 |
| | Fig. 9 Band structure and DOS of CO2 molecule adsorbed on 6-ABCNNR with 50%-C (a), 8-ZBCNNR with 50%-C (b), B-rich 6-ABCNNR with 50%-C (c), B-rich 8-ZBCNNR with 50%-C (d). PDOS of CO2 molecule adsorbed on 6-ABCNNR with 50%-C (e), 8-ZBCNNR with 50%-C (f), B-rich 6-ABCNNR with 50%-C (g), B-rich 8-ZBCNNR with 50%-C (h). The Fermi level indicated by the red dashed line. | |
3.4. H2S molecule adsorption
The most stable adsorption configuration of H2S molecule before and after adsorption is shown in Fig. 10(a)–(p), which is the hollow-center for all structures. The most stable adsorption configuration of H2S molecule before and after adsorption on 6-ABCNNR with 33%-C, 8-ZBCNNR with 25%-C, B-rich 6-ABCNNR with 33%-C, and B-rich 8-ZBCNNR with 25%-C is shown in Fig. S7 in the ESI.† The changes in the bond length (the average length of bonds of the molecule), adsorption distance of nearest-neighbor atoms between the H2S molecule and substrate, charge transfer between H2S molecule and substrate, the angle of H2S molecule (average angles in the molecule), and adsorption energy after H2S molecule adsorption are summarized in Table 5, and these parameters after H2S molecule adsorption on nanoribbons with 25% and 33% carbon are given in Table S7 in the ESI.† Before H2S molecule adsorption, the average length of bonds is 1.371 Å and after H2S molecule adsorption on 8-ZBCNNR with 50%-C, it decreases (1.370 Å, Table 5), but after adsorption on B-rich 6-ABCNNR with 50%-C, it increases (1.372 Å, Table 5). Also, this value does not change when adsorbing on two other nanoribbons. Before the interaction of H2S molecule with the nanoribbons, its bond angle is 92.033°, but after the interaction with all the nanoribbons except 6-ABCNNR with 50%-C, its bond angle decreases and the smallest bond angle belongs to H2S molecule adsorption on B-rich 6-ABCNNR with 50%-C (91.291°, Table 5). After the interaction of H2S molecule with 6-ABCNNR with 50%-C, its bond angle increases to 92.389° (Table 5). After H2S molecule adsorption on 6-ABCNNR with 50%-C, the adsorption distance of the nearest-neighbor atoms between H2S molecule and substrate decreases (from 3.215 Å to 3.042 Å, Table 6), which means that the molecule comes close to the substrate, while after H2S molecule adsorption on other nanoribbons, this distance increases, which indicates that due to the interaction of the molecule with the nanoribbons, the molecule moves away from them, where the largest distance belongs to H2S molecule adsorption on 8-ZBCNNR with 50%-C (from 2.468 Å to 3.297 Å, Table 5). Similar to CO and CO2 molecules, the highest adsorption energy of H2S molecule is on B-rich 6-ABCNNR with 50%-C (−1.507 eV, Table 5) and the lowest adsorption energy is on 8-ZBCNNR with 50%-C (−0.389 eV, Table 5). Table 6 shows the structural deformation of the nanoribbons after the interaction of H2S molecule with the nanoribbons, similar to CO2 molecule, the highest one is related to B-rich 6-ABCNNR with 50%-C (1.386 Å), and the lowest one is related to 8-ZBCNNR with 50%-C (0.352 Å). The structural deformation of nanoribbons with 25% and 33% carbon after H2S molecule adsorption is presented in Table S8 in the ESI.†Fig. 10(a)–(d) shows the band structure and DOS of nanoribbons after H2S molecule adsorption. The band gap of 8-ZBCNNR with 50%-C and B-rich 8-ZBCNNR with 50%-C after H2S molecule adsorption is not different from before H2S molecule adsorption and are still metal and semimetal, respectively. However, the band gap of 6-ABCNNR with 50%-C (1.409 eV, Table 6) and B-rich 6-ABCNNR with 50%-C increase (1.558 eV, Table 6), leading to lower electrical conductivity. Table 5 describes that a small charge transfer occurs between the H2S molecule and all the nanoribbons, the highest charge transfer is between B-rich 6-ABCNNR with 50%-C and H2S molecule (+0.025 e), and the lowest charge transfer is between B-rich 8-ZBCNNR with 50%-C and H2S molecule (+0.003 e). The H2S molecule behaves as the electron acceptor only when it is adsorbed on 6-ABCNNR with 50%-C, and it is the electron donor when it is adsorbed on other nanoribbons. Moreover, the Fermi energy of nanoribbons shifts after H2S molecule adsorption, supporting charge transfer between the adsorbate and substrate (Table 6). The adsorption of H2S is physically similar to CO2 on all nanoribbons; as a conclusion, we will not expect special changes near the Fermi level. Minor changes can be seen in the regions far from the Fermi level (conduction and valence regions). For example, after the adsorption of H2S on 6-ABCNNR, 8-ZBCNNR, B-rich 6-ABCNNR, and B-rich 8-ZBCNNR with 50%-C due to the creation of a flat band in the band structure, a large peak is seen in DOS near the energy of −5 eV. Also, due to the creation of these flat bands in the range from −5 eV to −6 eV, the long peaks in DOS are created for 6-ACBNNR with 33%-C, 8-ZCBNNR with 25%-C, B-rich 6-ACBNNR with 33%-C, and B-rich 8-ZCBNNR with 25%-C (comparison of Fig. 1(e), (f), 2(e), (f) and Fig. S1(e), (f), S2(e), (f) (ESI†) (before H2S molecule adsorption) with Fig. 10(a)–(d) and Fig. S8(a)–(d) (ESI†) (after H2S molecule adsorption)). Fig. 10(e)–(h) shows the PDOS of nanoribbons after H2S molecule adsorption. For all the configurations of the H2S molecule adsorption on the nanoribbons for the regions far from the Fermi energy and valence band, almost strong hybridization between the B (2p), N (2p), and C (2p) states of the nanoribbon with the S (2p) state of the H2S molecule happen. However, for the regions near the Fermi energy and in the valence and conduction band regions, the contribution of the S (2p) state is negligible, and also the contribution of B (2p), N (2p), and C (2p) states has a very small difference compared to before H2S molecule adsorption (Fig. 1(g), (h) and 2(g), (h)), which is due to small charge transfer that occurs. Similar to CO and CO2 molecules, the slight changes observed in the band structure and DOS of nanoribbons after H2S molecule adsorption (Fig. 10(a)–(d)) indicates the physical adsorption of H2S molecule on the nanoribbons. The band structure, DOS, and PDOS of H2S molecule adsorbed on nanoribbons with 50% carbon is shown in Fig. 11, and for 25% and 33% carbon are brought in Fig. S8 in ESI.†
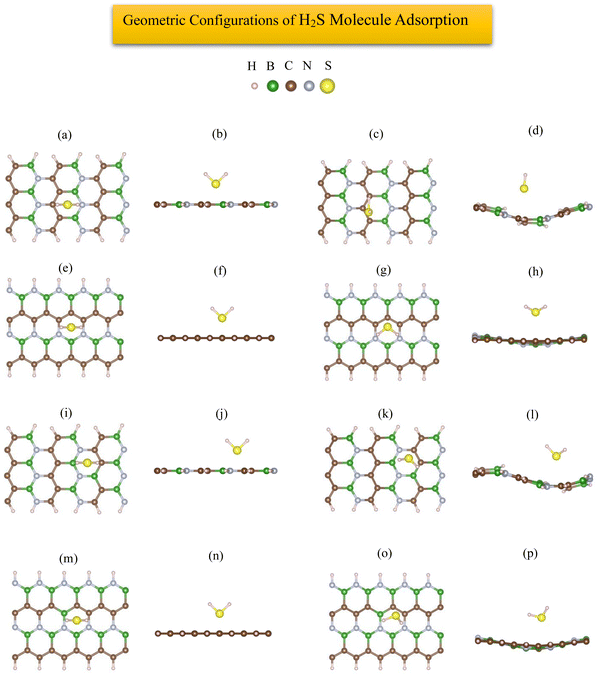 |
| | Fig. 10 Top view and side view of the geometric configurations of H2S molecule on 6-ABCNNR with 50%-C before (a) and (b) and after (c) and (d) optimization, 8-ZBCNNR with 50%-C before (e) and (f) and after (g) and (h) optimization, B-rich 6-ABCNNR with 50%-C before (i) and (j) and after (k) and (l) optimization, B-rich 8-ZBCNNR with 50%-C before (m) and (n) and after (o) and (p) optimization. | |
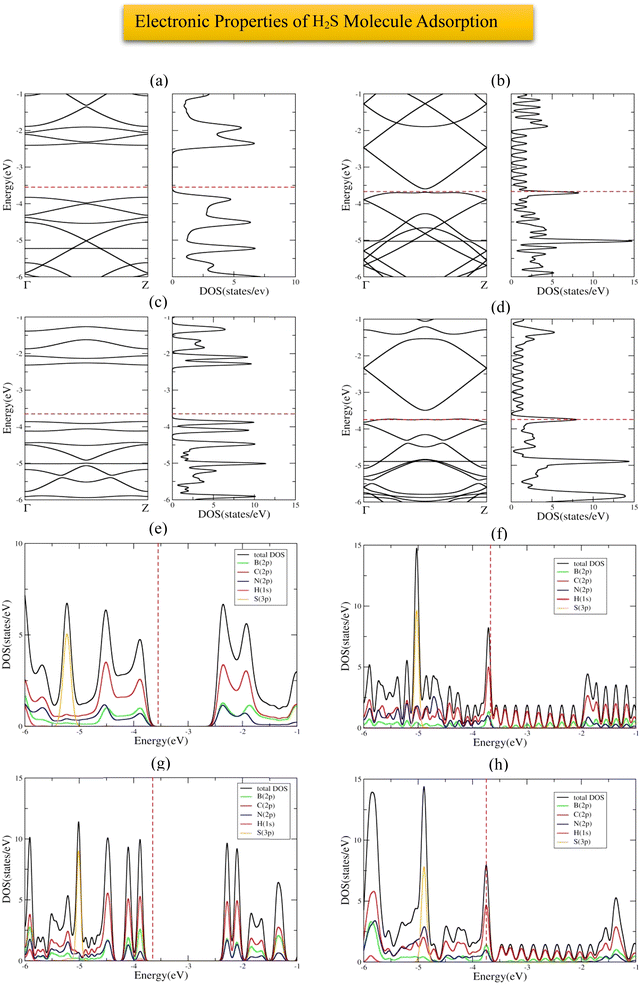 |
| | Fig. 11 Band structure and DOS of H2S molecule adsorbed on 6-ABCNNR with 50%-C (a), 8-ZBCNNR with 50%-C (b), B-rich 6-ABCNNR with 50%-C (c), B-rich 8-ZBCNNR with 50%-C (d). PDOS of H2S molecule adsorbed on 6-ABCNNR with 50%-C (e), 8-ZBCNNR with 50%-C (f), B-rich 6-ABCNNR with 50%-C (g), and B-rich 8-ZBCNNR with 50%-C (h). The Fermi level is indicated by the red dashed line. | |
3.5. HF molecule adsorption
The most stable adsorption configuration of the HF molecule before and after adsorption is shown in Fig. 12(a)–(p), which is the hollow-center for all the structures. The most stable adsorption configuration of the HF molecule before and after adsorption on 6-ABCNNR with 33%-C, 8-ZBCNNR with 25%-C, B-rich 6-ABCNNR with 33%-C, and B-rich 8-ZBCNNR with 25%-C is shown in Fig. S9 in the ESI.† The changes in the bond length (the average length of bonds of the molecule), adsorption distance of nearest-neighbor atoms, and charge transfer between HF adsorbate and substrate, and adsorption energy after HF molecule adsorption are summarized in Table 5, and these parameters after HF molecule adsorption on nanoribbons with 25% and 33% carbon are given in Table S9 in the ESI.† Before adsorption, the HF bond length is 0.929 Å and after adsorption on all substrates, the HF molecule bond length increases slightly, where the largest bond length happens after HF molecule adsorption on B-rich 6-ABCNNR with 50%-C (0.947 Å, Table 5). By calculation of the structural deformation of substrate and adsorption distance of HF molecule and nearest-neighbor atoms of the adsorption site, the HF orientation is determined, where the HF molecule approaches 8-ZBCNNR with 50%-C (from 2.468 Å to 2.693 Å), while the HF molecule moves away from other nanoribbons. Similar to CO, CO2, and H2S molecules, the highest adsorption energy of HF molecule is on B-rich 6-ABCNNR with 50%-C (−1.619 eV, Table 5), and the lowest adsorption energy is on 8-ZBCNNR with 50%-C (−0.391 eV, Table 5). Table 6 presents the structural deformation of the nanoribbons after the interaction of HF molecule with the nanoribbons, similar to CO2 and H2S molecules; the highest one is related to B-rich 6-ABCNNR with 50%-C (1.467 Å) and the lowest one is related to 8-ZBCNNR with 50%-C (0.049 Å), which is a small value. The structural deformation for nanoribbons with 25% and 33% carbon after HF molecule adsorption is listed in Table S10 in the ESI.†Fig. 13(a)–(d) displays the band structure and DOS of nanoribbons after HF molecule adsorption. The band gap of 8-ZBCNNR with 50%-C and B-rich 8-ZBCNNR with 50%-C after HF molecule adsorption are not different from that before HF molecule adsorption and are still metal and semimetal, respectively. However, the band gap of 6-ABCNNR with 50%-C (1.409 eV, Table 6) increases, leading to lower electrical conductivity, while the band gap of B-rich 6-ABCNNR with 50%-C decreases (1.645 eV, Table 6), thus enhancing its electrical conductivity. Table 5 shows the charge transfer between HF molecule and nanoribbons, which is greater than the charge transfer between the other molecules and nanoribbons (except for the charge transfer between CO molecule and 8-ZBCNNR with 50%-C (−0.031 e, Table 5), which is greater than the charge transfer between HF molecule and 8-ZBCNNR with 50%-C (+0.025 e)). The greatest charge transfer is between B-rich 8-ZBCNNR with 50%-C and HF molecule (−0.082 e) and the lowest one is between 8-ZBCNNR with 50%-C and HF molecule (+0.025 e). The HF molecule behaves as the electron acceptor when adsorbed on all nanoribbons except 8-ZBCNNR with 50%-C. As mentioned in previous sections, charge transfer between the adsorbate and substrate leads to the Fermi energy shift of nanoribbons (Table 6). Similar to CO2 and H2S, the adsorption of HF is physical on all nanoribbons; thus, we do not expect any special changes in the DOS around the Fermi level. In 6-ACBNNR with 33%-C, a new peak is observed at energy of −1.5 eV due to the creation of a new band in the band structure, and in B-rich 6-ACBNNR with 33%-C at energy about −5.5 eV to −6 eV and at energy about −4.3 eV due to the creation of a flat band in the band structure; we see a large peak in the DOS (comparison of Fig. 1(e), (f), 2(e), (f) and Fig. S1(e), (f), S2(e), (f) (ESI†) (before HF molecule adsorption) with Fig. 12(a)–(d) and Fig. S10(a)–(d) (ESI†) (after HF molecule adsorption)). Fig. 13(e)–(h) shows the PDOS of nanoribbons after HF molecule adsorption. Although charge transfers increase after HF molecule adsorption on the nanoribbons compared to the other molecules, these amounts are still small, and for this reason, we do not see a contribution of the F (2p) state of the HF molecule around the Fermi level and the valence and conduction band regions. In addition, the comparison of DOS and PDOS of the structures before (Fig. 1(e)–(h) and 2(e)–(h)) and after HF molecule adsorption (Fig. 13(a)–(h)) indicates very slight changes, confirming the physical adsorption of the HF molecule. The band structure, DOS, and PDOS of HF molecule adsorbed on nanoribbons with 25% and 33% carbon is shown in Fig. S10 in the ESI.†
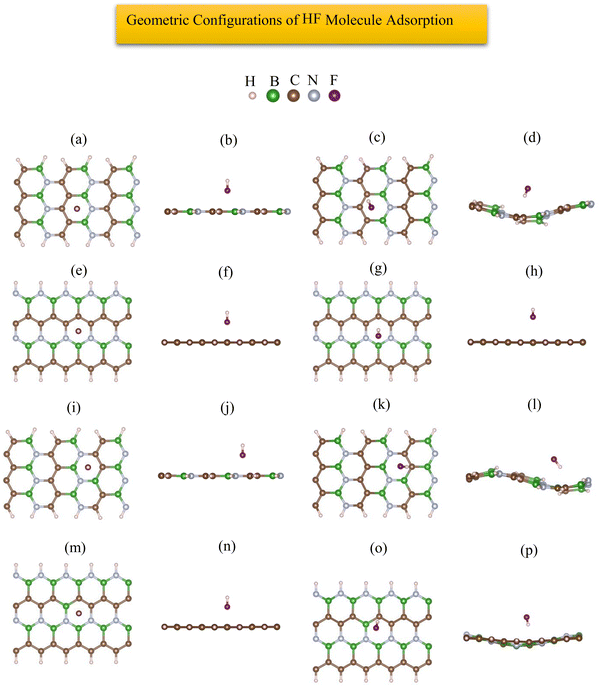 |
| | Fig. 12 Top view and side view of the geometric configurations of HF molecule on 6-ABCNNR with 50%-C before (a) and (b) and after (c) and (d) optimization, 8-ZBCNNR with 50%-C before (e) and (f) and after (g) and (h) optimization, B-rich 6-ABCNNR with 50%-C before (i) and (j) and after (k) and (l) optimization, B-rich 8-ZBCNNR with 50%-C before (m) and (n) and after (o) and (p) optimization. | |
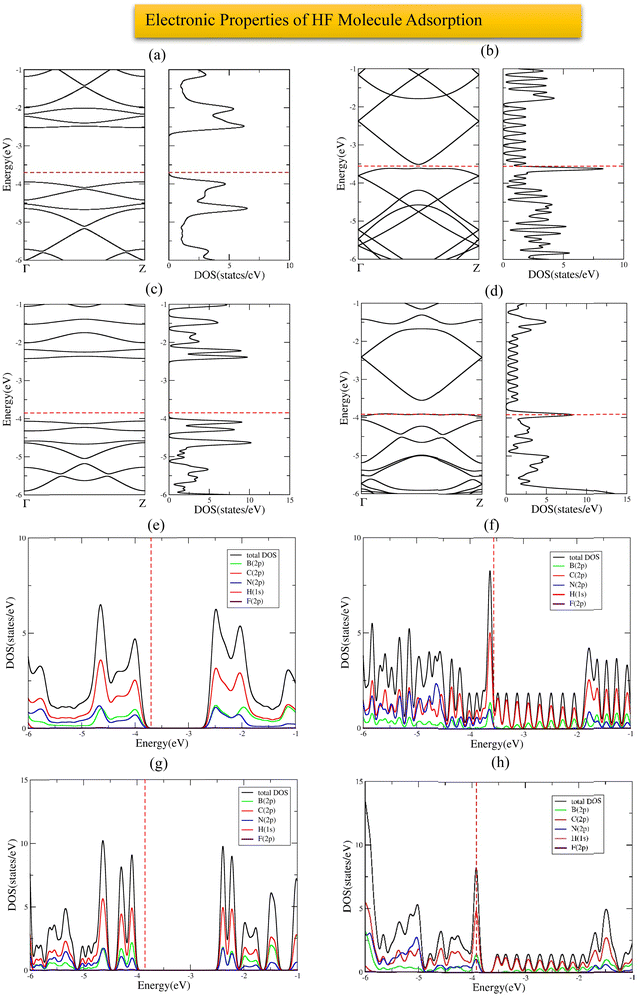 |
| | Fig. 13 Band structure and DOS of HF molecule adsorbed on 6-ABCNNR with 50%-C (a), 8-ZBCNNR with 50%-C (b), B-rich 6-ABCNNR with 50%-C (c), B-rich 8-ZBCNNR with 50%-C (d). PDOS of HF molecule adsorbed on 6-ABCNNR with 50%-C (e), 8-ZBCNNR with 50%-C (f), B-rich 6-ABCNNR with 50%-C (g), and B-rich 8-ZBCNNR with 50%-C (h). The Fermi level is indicated by the red dashed line. | |
3.6. NH3 molecule adsorption
The most stable adsorption configuration of NH3 molecule before and after adsorption is shown in Fig. 14(a)–(p), which is the hollow-center for 6-ABCNNR with 50%-C (Fig. 14(a)–(d)) and B-rich 6-ABCNNR with 50%-C (Fig. 14(i)–(l)), top of B atom for 8-ZBCNNR with 50%-C (Fig. 14(e)–(h)), and top of B atom (B atom replacing C atom) for B-rich 8-ZBCNNR with 50%-C (Fig. 14(m)–(p)). The most stable adsorption configuration of NH3 molecule before and after adsorption on 6-ABCNNR with 33%-C, 8-ZBCNNR with 25%-C, B-rich 6-ABCNNR with 33%-C, and B-rich 8-ZBCNNR with 25%-C is shown in Fig. S11 in the ESI.† The changes in the bond length (the average length of bonds of the molecule), adsorption distance of nearest-neighbor atoms between NH3 molecule and substrate, charge transfer between NH3 molecule and substrate, the angle of NH3 molecule (average angles in the molecule), and adsorption energy after NH3 molecule adsorption are summarized in Table 5, and these parameters after NH3 molecule adsorption on nanoribbons with 25% and 33% carbon are given in Table S11 in the ESI.† Before the NH3 molecule is adsorbed on all the nanoribbons, the average length of bonds is 1.041 Å, and after the adsorption of the NH3 molecule, this value increases, and the highest values are related to the adsorption on B-rich 6-ABCNNR with 50%-C and 8-ZBCNNR with 50%-C. Before NH3 molecule adsorption on all nanoribbons, the average angles in the molecule are equal to 105.506°, and after the adsorption of the NH3 molecule, this value increases, and the highest value is related to the adsorption on B-rich 6-ABCNNR with 50%-C (109.402°, Table 5). NH3 molecule approaches nanoribbons after adsorption except for 6-ABCNNR with 50%-C as the adsorption distance of the nearest-neighbor atoms of the adsorption site and NH3 molecule decreases. The smallest distance is for NH3 molecule adsorbed on B-rich 6-ABCNNR with 50%-C (from 2.440 Å to 1.753 Å, Table 5), while NH3 adsorbed on 6-ABCNNR with 50%-C molecule moves away with increased distance (from 2.486 Å to 2.708 Å, Table 5). The highest (−1.676 eV, Table 5) and lowest (−0.573 eV, Table 5) adsorption energy of NH3 molecule is when the molecule is adsorbed on B-rich 6-ABCNNR with 50%-C and B-rich 8-ZBCNNR with 50%-C, respectively. Table 6 shows the structural deformation of the nanoribbons after the interaction of NH3 molecule with the nanoribbons, similar to CO2 and H2S molecules, the highest one is related to B-rich 6-ABCNNR with 50%-C (1.419 Å) and the lowest one is related to 8-ZBCNNR with 50%-C (0.521 Å). The structural deformation for nanoribbons with 25% and 33% carbon after NH3 molecule adsorption is listed in Table S12 in the ESI.†Fig. 15(a)–(d) presents the band structure and DOS of nanoribbons after NH3 molecule adsorption. It is worth to note that the transition of the semimetal to the semiconductor phase occurs after the interaction of 8-ZBCNNR with 50%-C with the NH3 molecule, where a band gap of 0.131 eV (Table 6) is created; hence, its electrical conductivity decreases. The phase transition is caused by this band gap opening/closing.71,73 The electrical conductivity of 6-ABCNNR with 50%-C also decreases because its band gap increases (1.400 eV, Table 6) after NH3 molecule adsorption. The band gap of B-rich 6-ABCNNR with 50%-C decreases (1.610 eV, Table 6); as a result, its electrical conductivity improves. Table 5 displays the charge transfer between NH3 molecule and nanoribbons. Table 6 data reveals that the charge transfer between NH3 molecule and nanoribbons is much greater than the other molecules (except the charge transfer between NH3 molecule and 6-ABCNNR with 50%-C). The highest charge transfer (+0.389 e) is between NH3 molecule and B-rich 8-ZBCNNR with 50%-C, and the lowest charge transfer (+0.06 e) is between NH3 molecule and 6-ABCNNR with 50%-C. In all structures, NH3 molecule behaves as the electron donor. Fermi energy shift exists for this adsorption system due to charge transfer (Table 6). The adsorption of NH3 on all nanoribbons except B-rich 6-ACBNNR with 33%-C and B-rich 8-ZCBNNR with 25%-C is physical; thus, we do not see many changes in the DOS. But, as we expect, since the adsorption of NH3 on B-rich 6-ACBNNR with 33%-C and B-rich 8-ZCBNNR with 25%-C is chemical, we observe significant changes in the DOS around the Fermi level as a result of orbital mixing and charge transfer between the adsorbate and substrate. Before the adsorption of the molecule in B-rich 6-ACBNNR with 33%-C, there was no gap before the Fermi level (valence region), but after the adsorption, a gap can be seen in the DOS. After the adsorption, the gap after the Fermi energy (conduction region) decreases significantly. Also, at −1.3 eV, due to the creation of a band in the band structure, a relatively high peak is created in the density of electronic states. In the B-rich 8-ZCBNNR with 25%-C, after adsorption at an energy of about −1.2 eV, a significant peak in the DOS is observed due to the creation of a flat band in the band structure. Fig. 15(e)–(h) shows the PDOS of nanoribbons after NH3 molecule adsorption. Due to the insignificant amount of charge transfer between NH3 molecule and 6-ABCNNR with 50%-C, there is no special difference in their PDOS before (Fig. 1(g)) and after (Fig. 15(e)) NH3 molecule adsorption. According to the PDOS of 8-ZBCNNR with 50%-C after NH3 molecule adsorption, its semi-conductivity can be understood because no electronic state can be seen in the Fermi level (Fig. 15(f)). Due to significant charge transfer between NH3 molecule and B-rich 6-ABCNNR with 50%-C, the contribution of the density of states of orbitals in the valence band and conduction band regions varies (Fig. 15(g)), where the contribution of B (2p) states decreases in the region of the valence band compared to before adsorption. Additionally, due to the significant charge transfer that occurs between the NH3 molecule and B-rich 8-ZBCNNR with 50%-C, there are special changes in the contribution of orbitals, especially in the valence band region (Fig. 15(h)), where the contribution of N (2p) and C (2p) states increases in the valence band region. We do not observe significant changes in the band structure and DOS of 6-ABCNNR with 50%-C before (Fig. 1(e)) and after (Fig. 15(a)) NH3 molecule adsorption because the charge transfer between NH3 molecule and 6-ABCNNR with 50%-C is very small. Therefore, NH3 molecule adsorption on 6-ABCNNR with 50%-C is physical. Although the charge transfer between NH3 molecule and B-rich 6-ABCNNR with 50%-C is relatively significant, we do not see obvious changes in the band structure and DOS of B-rich 6-ABCNNR with 50%-C before (Fig. 2(e)) and after (Fig. 15(c)) NH3 molecule adsorption; thus, NH3 molecule adsorption on B-rich 6-ABCNNR with 50%-C is also physical. Though the band structure and DOS of 8-ZBCNNR with 50%-C after NH3 molecule adsorption (Fig. 15(b)) has relatively significant changes compared to before adsorption (Fig. 1(f)) due to almost significant charge transfer, no bond is formed between the NH3 molecule and 8-ZBCNNR with 50%-C; therefore, physical adsorption occurs. This also applies to the comparison of B-rich 8-ZBCNNR with 50%-C before (Fig. 2(g)) and after (Fig. 15(d)) NH3 molecule adsorption. The band structure, DOS, and PDOS of NH3 molecule adsorbed on nanoribbons with 25% and 33% carbon is shown in Fig. S12 in the ESI.†
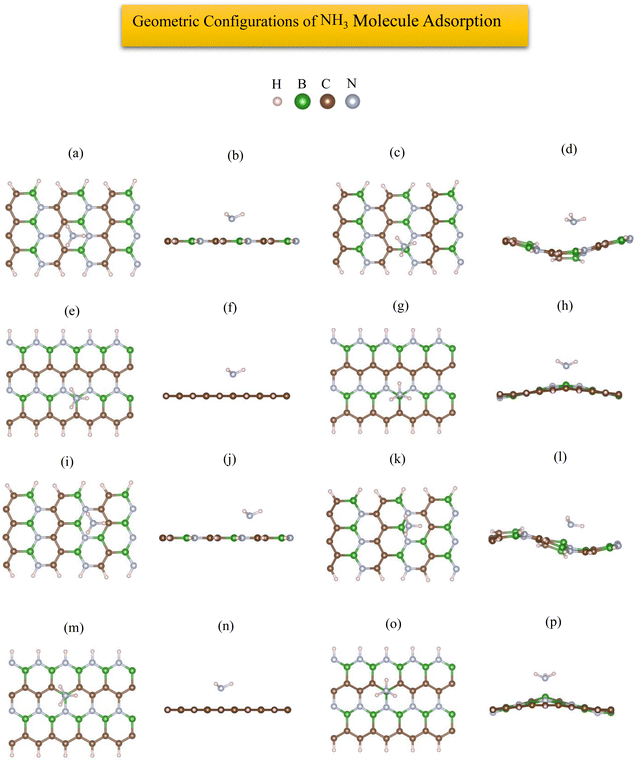 |
| | Fig. 14 Top view and side view of the geometric configurations of NH3 molecule on 6-ABCNNR with 50%-C before (a) and (b) and after (c) and (d) optimization, 8-ZBCNNR with 50%-C before (e) and (f) and after (g) and (h) optimization, B-rich 6-ABCNNR with 50%-C before (i) and (j) and after (k) and (l) optimization, B-rich 8-ZBCNNR with 50%-C before (m) and (n) and after (o) and (p) optimization. | |
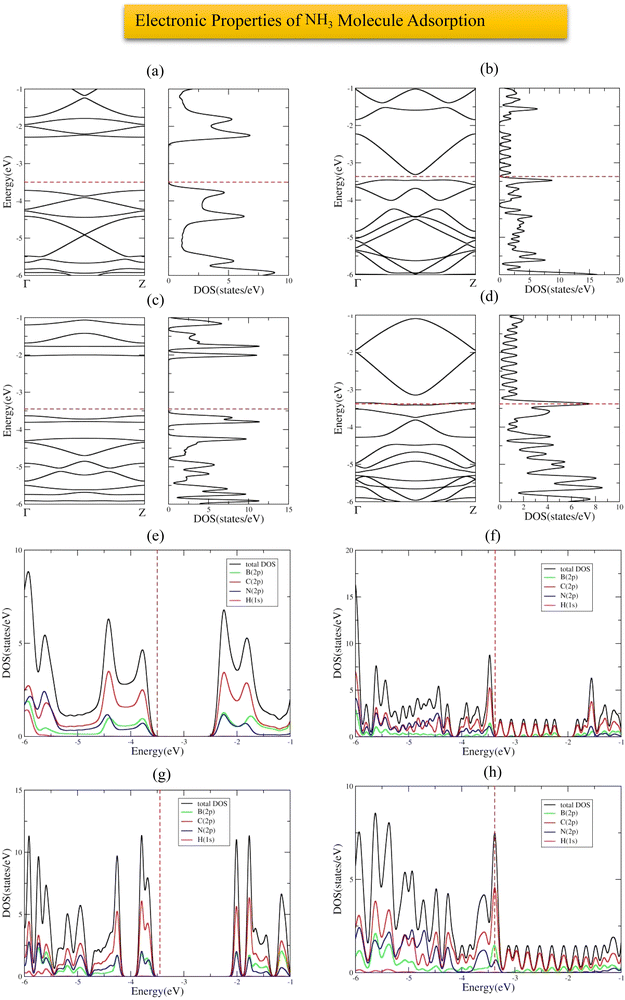 |
| | Fig. 15 Band structure and DOS of the NH3 molecule adsorbed on 6-ABCNNR with 50%-C (a), 8-ZBCNNR with 50%-C (b), B-rich 6-ABCNNR with 50%-C (c), B-rich 8-ZBCNNR with 50%-C (d). PDOS of NH3 molecule adsorbed on 6-ABCNNR with 50%-C (e), 8-ZBCNNR with 50%-C (f), B-rich 6-ABCNNR with 50%-C (g), and B-rich 8-ZBCNNR with 50%-C (h). The Fermi level is indicated by the red dashed line. | |
3.7. Comparison of adsorption of CO, CO2, H2S, HF, and NH3 molecules
Fig. 16 shows the adsorption energy of different gas molecules on each of the introduced nanoribbons. When the molecules are adsorbed on 6-ABCNNR with 50%-C (Fig. 16(a)), 8-ZBCNNR with 50%-C (Fig. 16(c)), B-rich 6-ABCNNR with 50%-C (Fig. 16(e)), B-rich 6-ABCNNR with 33%-C (Fig. 16(f)), and B-rich 8-ZBCNNR with 25%-C (Fig. 16(h)), the highest adsorption energy belongs to the NH3 molecule adsorption. But when the molecules are adsorbed on 6-ABCNNR with 33%-C (Fig. 16(b)) and 8-ZBCNNR with 25%-C (Fig. 16(d)), the highest adsorption energy is related to the CO2 molecule adsorption, and when the HF molecule is adsorbed on B-rich 8-ZBCNNR with 50%-C (Fig. 16(g)), it has the highest adsorption energy. The CO molecule has the lowest adsorption energy when it is adsorbed on 6-ABCNNR with 50%-C (Fig. 16(a)), 6-ABCNNR with 33%-C (Fig. 16(b)), and 8-ZBCNNR with 25%-C (Fig. 16(d)). H2S molecule adsorption on 8-ZBCNNR with 50%-C (Fig. 16(c)), B-rich 6-ABCNNR with 50%-C (Fig. 16(e)), B-rich 8-ZBCNNR with 50%-C (Fig. 16(g)), and B-rich 8-ZBCNNR with 25%-C (Fig. 16(h)) has the lowest adsorption energy. The adsorption energy of each molecule on different nanoribbons can be seen in Fig. 17 (For CO2 molecule, we compared its adsorption energies to its standard free energy (SFE = 0.67 eV) at 300 K51,52 (Fig. 17(b))). The highest adsorption energy of all molecules is when they are adsorbed on B-rich 6-ABCNNR with 33%-C. The lowest adsorption energy of all molecules except NH3 molecule is when they are adsorbed on 8-ZBCNNR with 50%-C (Fig. 17(a)–(d)). The lowest adsorption energy of NH3 molecule is when it is adsorbed on B-rich 8-ZBCNNR with 50%-C (Fig. 17(e)). In addition, what we can see from Fig. 17 is that when molecules are adsorbed on armchair nanoribbons, they have more adsorption energy than when they are adsorbed on zigzag nanoribbons, except when CO (Fig. 17(a)) and NH3 (Fig. 17(e)) molecules are adsorbed on B-rich 8-ZBCNNR with 25%-C; the adsorption energy is higher than when they are adsorbed on 6-ABCNNR with 50%-C because the adsorption of these two molecules on B-rich 8-ZBCNNR with 25%-C is chemical but on 6-ABCNNR with 50%-C is physical. Also, when we check the adsorption energy of the molecule when it is adsorbed on the nanoribbon that is both pristine and boron-rich, we realize that the adsorption energy is enhanced when the molecule is adsorbed on the boron-rich nanoribbons. One plausible explanation takes into account that the boron-rich structure is a double-acceptor72 and acts as an activate site.45 This does not apply to NH3 molecule, and the NH3 molecule adsorption energy when it is adsorbed on 8-ZBCNNR with 50%-C is higher than when it is adsorbed on B-rich 8-ZBCNNR with 50%-C. This exception is attributed to the large structural deformation of NH3 and mixing of orbitals, which affect donation and back-donation between the adsorbate and substrate, in good agreement with previous works.61,69 In the next step, we calculate the sensitivity factor (SF) of different molecules when adsorbed on semiconductor nanoribbons using eqn 3, which is presented in Table 7 (to see the sensitivity factor related to the adsorption of molecules on other nanoribbons investigated in this work, refer to Table S13 in the ESI†). The highest (15.65%, Table 7) and lowest (0%, Table 7) sensitivity factors are related to CO molecule adsorption on B-rich 6-ABCNNR with 50%-C and CO molecule adsorption on 6-ABCNNR with 50%-C, respectively. The highest sensitivity factor is when all molecules except CO molecule are adsorbed on 6-ABCNNR with 33%-C, but when CO molecule is adsorbed on B-rich 6-ABCNNR with 50%-C, it has the highest sensitivity factor.
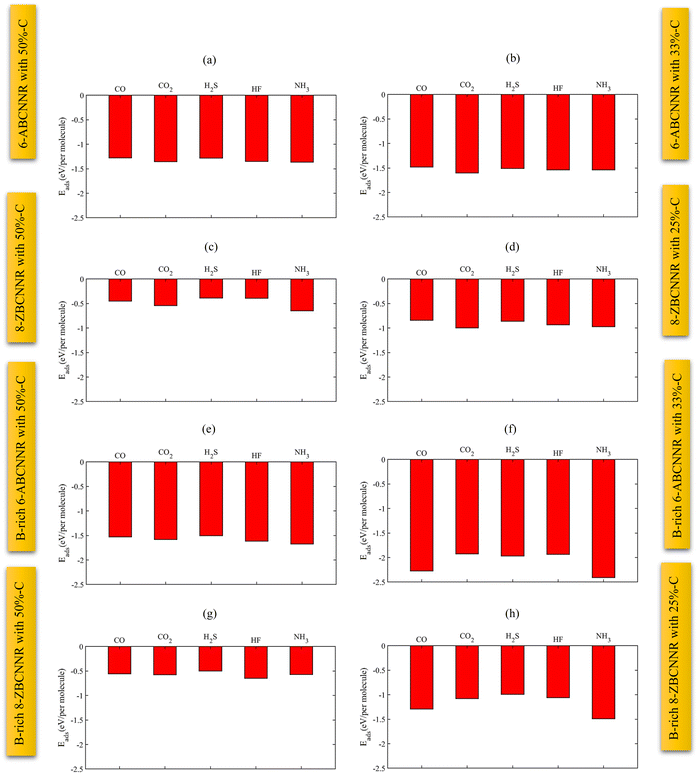 |
| | Fig. 16 Adsorption energies of different gas molecules on 6-ABCNNR with 50%-C (a), 6-ABCNNR with 33%-C (b), 8-ZBCNNR with 50%-C (c), 8-ZBCNNR with 25%-C (d), B-rich 6-ABCNNR with 50%-C (e), B-rich 6-ABCNNR with 33%-C (f), B-rich 8-ZBCNNR with 50%-C (g), and B-rich 8-ZBCNNR with 25%-C (h). | |
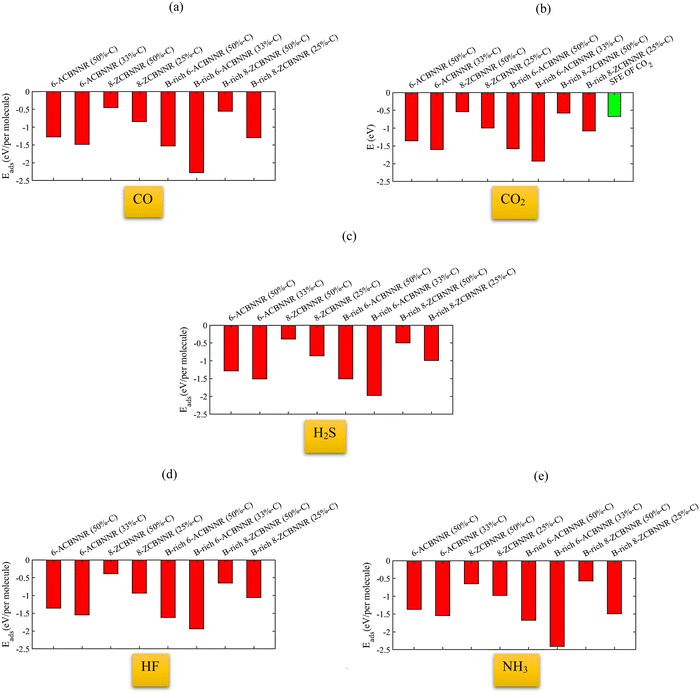 |
| | Fig. 17 Adsorption energy of the CO molecule (a), CO2 molecule (the green column indicates the standard free energy (SFE) of CO2 at 300 K) (b), H2S molecule (c), HF molecule (d), and NH3 molecule (e) on 6-ACBNNR with 50%-C, 6-ACBNNR with 33%-C, 8-ZCBNNR with 50%-C, 8-ZCBNNR with 25%-C, B-rich 6-ACBNNR with 50%-C, B-rich 6-ACBNNR with 33%-C, B-rich 8-ZCBNNR with 50%-C, and B-rich 8-ZCBNNR with 25%-C. | |
Table 7 SF (sensitivity factor) for two semiconductor structures, 6-ABCNNR and B-rich 6-ABCNNR with 50%-C
| System |
SF (sensitivity factor) |
System |
SF (sensitivity factor) |
| 6-ABCNNR + CO |
0% |
B-rich 6-ABCNNR + CO |
15.65% |
| 6-ABCNNR + CO2 |
0.65% |
B-rich 6-ABCNNR + CO2 |
4.71% |
| 6-ABCNNR + H2S |
3.22% |
B-rich 6-ABCNNR + H2S |
5.80% |
| 6-ABCNNR + HF |
3.22% |
B-rich 6-ABCNNR + HF |
0.54% |
| 6-ABCNNR + NH3 |
2.56% |
B-rich 6-ABCNNR + NH3 |
2.66% |
3.8. Effect of temperature and pressure on molecular adsorption
Taib et al.74 investigated the performance of carbon-doped boron nitride nanoribbon (BC2NNR) for hydrogen gas (H2) sensing at high temperatures (298 K, 500 K, and 1000 K). In their work, the adsorption energy, energy band gap, and sensitivity were calculated when H2 was simultaneously attached to carbon, boron, and both boron and nitrogen atoms. They observed marginal differences in adsorption energy at different temperatures. Moreover, they found that the energy band gap openings at all temperatures for the three different positions of H2 gas molecules were similar (approximately 1.83 eV). Also, Kang et al.75 investigated the effect of pressure and temperature on CO2 adsorption on kaolinite; they found that the adsorption capacity of CO2 at different temperatures (283.15 K, 293.15 K, and 313.15 K) increases with increasing pressure. But this increase in adsorption capacity is very small from pressure 10 MPa to 40 MPa (0.75–0.8 cm3 g−1). Herein, we investigated the effect of temperature and pressure when CO molecule is adsorbed on 6-ABCNNR with 50%-C and obtained the adsorption energy, energy band gap, and sensitivity at temperatures of 298 K, 500 K, and 1000 K and pressures of 20 MPa, 30 MPa, and 40 MPa, which are presented in Table 8. Our calculations show that the adsorption energy at temperatures of 298 K, 500 K, and 1000 K are not much different. However, the highest adsorption energy is related to the temperature of 298 K (−2.162 eV, Table 8). This also applies to different pressures, and the adsorption energy at pressures of 20 MPa, 30 MPa, and 40 MPa has a slight difference. The highest adsorption energy is related to the pressure of 40 MPa (−2.165 eV, Table 8). The energy band gap, like the adsorption energy, is not particularly different at different temperatures and pressures. It shows that the changes in the lower conduction band and upper valence band are independent of temperature changes.74 The highest energy band gap is related to a temperature of 1000 K (1.322 eV, Table 8) and pressure of 40 MPa (1.320 eV, Table 8). The sensitivity of 6-ABCNNR with 50%-C to the adsorption of CO molecule at different temperatures and pressures has little difference. The highest sensitivity factor can be observed at a temperature of 1000 K (31.28%, Table 8) and pressure of 40 MPa (32.20%, Table 8).
Table 8 Comparison of adsorption energy (Eads), energy band gap (Eg), and sensitivity factor (SF) of 6-ABCNNR with 50%-C after CO molecule adsorption at three different temperatures and pressures
| Temperature (K) |
E
ads (eV) |
E
g (eV) |
SF (sensitivity factor) |
| 298 |
−2.162 |
1.331 |
31.13% |
| 500 |
−2.161 |
1.304 |
27.34% |
| 1000 |
−2.160 |
1.322 |
31.28% |
| Pressure (MPa) |
| 20 |
−2.162 |
1.313 |
32.09% |
| 30 |
−2.163 |
1.315 |
32.15% |
| 40 |
−2.165 |
1.320 |
32.20% |
4. Conclusions
In summary, DFT calculations were performed to study 5 types of toxic gases (CO, CO2, H2S, HF, and NH3) on pristine and boron-rich hybrid boron–carbon–nitride nanoribbons. The results show that the adsorption of all molecules on all structures is physical, but the exceptions are when CO and NH3 molecules are adsorbed on B-rich 6-ABCNNR with 33%-C and B-rich 8-ZBCNNR with 25%-C because their adsorption is chemical. We found that the adsorption of all molecules on armchair nanoribbons has higher adsorption energy than adsorption zigzag nanoribbons. Also, the two exceptions that exist are that the adsorption (chemisorption) of CO and NH3 molecules on B-rich 8-ZBCNNR with 25%-C has higher adsorption energy than when they are adsorbed (physisorption) on 6-ABCNNR with 50%-C. The comparison of adsorption energies showed that when a molecule is adsorbed on a B-rich nanoribbon, it has more adsorption energy than when the nanoribbon is pristine. However, this does not apply to NH3 molecule adsorption on B-rich 8-ZBCNNR with 50%-C and 8-ZBCNNR with 50%-C. The highest adsorption energy belongs to NH3 molecule adsorption on 6-ABCNNR with 50%-C, 8-ZBCNNR with 50%-C, B-rich 6-ABCNNR with 50%-C, B-rich 6-ABCNNR with 33%-C, and B-rich 8-ZBCNNR with 25%-C, CO2 molecule adsorption on 6-ABCNNR with 33%-C and 8-ZBCNNR with 25%-C, and HF molecule adsorption on B-rich 8-ZBCNNR with 50%-C. The largest charge transfer occurs between NH3 molecule and B-rich 8-ZBCNNR with 25%-C. In general, the largest charge transfer is related to the NH3 molecule adsorption. When the molecules are adsorbed on the nanoribbons, the highest structural deformation is related to B-rich 6-ABCNNR with 33%-C. These new features of hybrid BCN nanoribbons with tunable electronic properties due to the adsorption of gases can be expected to facilitate applications in gas sensor fields.
Data availability
The datasets generated during and/or analyzed during the current study are available from the corresponding author on reasonable request.
Author contributions
F. S. and A. R. designed and supervised the theoretical aspects of this work and F. M. performed computational models; F. M., F. S. and A. R. analyzed the data and wrote the manuscript.
Conflicts of interest
The authors declare no competing financial or non-financial interests.
Acknowledgements
Authors gratefully acknowledge the support and resources from the Center of High-Performance Computing at the Amirkabir University of Technology.
References
- U. Asghar, S. Rafiq, A. Anwar, T. Iqbal, A. Ahmed, F. Jamil, M. S. Khurram, M. M. Akbar, A. Farooq, N. S. Shah and Y. K. Park, J. Environ. Chem. Eng., 2021, 9, 106064 CrossRef CAS
 .
.
- W. Tian, X. Liu and Y. Yu, Appl. Sci., 2018, 7, 1118 CrossRef
 .
.
- Y. Zhang, J. Zhang, Y. Jiang, Z. Duan, B. Liu, Q. Zhao, S. Wang, Z. Yuan and H. Tai, Sens. Actuators, B, 2020, 319, 128293 CrossRef CAS
 .
.
- S. H. Lee, W. Eom, H. Shin, R. B. Ambade, J. H. Bang, H. W. Kim and T. H. Han, ACS Appl. Mater. Interfaces, 2020, 12, 10434–10442 CrossRef CAS PubMed
 .
.
- S. Mahajan and S. Jagtap, Appl. Mater. Today, 2020, 18, 100483 CrossRef
 .
.
- T. Pham, P. Ramnani, C. C. Villarreal, J. Lopez, P. Das, I. Lee, M. R. Neupane, Y. Rheem and A. Mulchandani, Carbon, 2019, 142, 504–512 CrossRef CAS
 .
.
- Y. Zhou, G. Liu, X. Zhu and Y. Guo, Sens. Actuators, B, 2017, 251, 280–290 CrossRef CAS
 .
.
- Y. Wang, Y. Cui, X. Meng, Z. Zhang and J. Cao, Surfaces Interfaces, 2021, 24, 101110 CrossRef CAS
 .
.
- D. W. Kang, S. E. Ju, D. W. Kim, M. Kang, H. Kim and C. S. Hong, Adv. Sci., 2020, 7, 2002142 CrossRef CAS PubMed
 .
.
- J. Zhang, X. Liu, G. Neri and N. Pinna, Adv. Mater., 2016, 28, 795–831 CrossRef CAS PubMed
 .
.
-
J. H. Jeoung, J. Fesseler, S. Goetzl and H. Dobbek, The Metal-Driven Biogeochemistry of Gaseous Compounds in the Environment, 2014, pp. 37–69 Search PubMed
 .
.
- S. Sinthika, E. M. Kumar and R. Thapa, J. Mater. Chem. A, 2014, 2, 12812–12820 RSC
 .
.
- M. Sagynbaeva, T. Hussain, P. Panigrahi, B. Johansson and R. Ahuja, Europhys. Lett., 2015, 109, 57008 CrossRef
 .
.
- S. Létant and M. J. Sailor, Adv. Mater., 2000, 12, 355–359 CrossRef
 .
.
- M. M. Arafat, B. Dinan, S. A. Akbar and A. S. M. A. Haseeb, Sensors, 2012, 12, 7207–7258 CrossRef CAS PubMed
 .
.
- Q. Kuang, C. S. Lao, Z. Li, Y. Z. Liu, Z. X. Xie, L. S. Zheng and Z. L. Wang, J. Phys. Chem. C, 2008, 112, 11539–11544 CrossRef CAS
 .
.
- L. Liao, Z. Zhang, B. Yan, Z. Zheng, Q. L. Bao, T. Wu, C. M. Li, Z. X. Shen, J. X. Zhang, H. Gong and T. Yu, Nanotechnology, 2009, 20, 085203 CrossRef CAS PubMed
 .
.
- X. Zou, J. Wang, X. Liu, C. Wang, Y. Jiang, Y. Wang, X. Xiao, J. C. Ho, J. Li, C. Jiang, Y. Fang, W. Liu and L. Liao, Nano Lett., 2013, 13, 3287–3292 CrossRef CAS PubMed
 .
.
- N. Singh, C. Yan and P. S. Lee, Sens. Actuators, B, 2010, 150, 19–24 CrossRef CAS
 .
.
- L. Wang, R. Chai, Z. Lou and G. Shen, Nano Res., 2018, 11, 1029–1037 CrossRef CAS
 .
.
- H. Gu, Z. Wang and Y. Hu, Sensors, 2012, 12, 5517–5550 CrossRef CAS PubMed
 .
.
- Y. Wang, P. Gao, L. Sha, Q. Chi, L. Yang, J. Zhang, Y. Chen and M. Zhang, Nanotechnology, 2018, 29, 175501 CrossRef PubMed
 .
.
- S. Kumar, A. Singh, R. Singh, S. Singh, P. Kumar and R. Kumar, Sens. Actuators, B, 2020, 325, 128974 CrossRef CAS
 .
.
- P. Seifaddini, R. Ghasempour, M. Ramezannezhad and A. Nikfarjam, Mater. Res. Express, 2019, 6, 045054 CrossRef
 .
.
- S. Cui, H. Pu, G. Lu, Z. Wen, E. C. Mattson, C. Hirschmugl, M. Gajdardziska-Josifovska, M. Weinert and J. Chen, ACS Appl. Mater. Interfaces, 2012, 4, 4898–4904 CrossRef CAS PubMed
 .
.
- A. Nikfarjam, S. Hosseini and N. Salehifar, ACS Appl. Mater. Interfaces, 2017, 9, 15662–15671 CrossRef CAS PubMed
 .
.
- M. Barzegar and T. Bharati, Surface Innovations, 2018, 6, 205–230 CrossRef
 .
.
- G. X. Chen, R. X. Wang, H. X. Li, X. N. Chen, G. An and J. M. Zhang, Appl. Phys. A, 2021, 127, 1–14 CrossRef
 .
.
- J. Yu, L. H. Xie, J. R. Li, Y. Ma, J. M. Seminario and P. B. Balbuena, Chem. Rev., 2017, 117, 9674–9754 CrossRef CAS PubMed
 .
.
- M. Qu, G. Qin, J. Fan, A. Du and Q. Sun, Appl. Surf. Sci., 2021, 555, 149652 CrossRef CAS
 .
.
- N. C. Zhang, J. Ren and X. J. Peng, Fullerenes, Nanotubes Carbon Nanostruct., 2016, 24, 298–304 CrossRef CAS
 .
.
- X. Wei, M. S. Wang, Y. Bando and D. Golberg, ACS Nano, 2011, 5, 2916–2922 CrossRef CAS PubMed
 .
.
- W. Lei, H. Zhang, Y. Wu, B. Zhang, D. Liu, S. Qin, Z. Liu, L. Liu, Y. Ma and Y. Chen, Nano Energy, 2014, 6, 219–224 CrossRef CAS
 .
.
- L. Ju, J. Velasco Jr, E. Huang, S. Kahn, C. Nosiglia, H. Z. Tsai, W. Yang, T. Taniguchi, K. Watanabe, Y. Zhang, G. Zhang, M. Crommie, A. Zettl and F. Wang, Nat. Nanotechnol., 2014, 9, 348–352 CrossRef CAS PubMed
 .
.
- S. Lin, X. Ye, R. S. Johnson and H. Guo, J. Phys. Chem. C, 2013, 117, 17319–17326 CrossRef CAS
 .
.
- Y. J. Liu, B. Gao, D. Xu, H. M. Wang and J. X. Zhao, Phys. Lett. A, 2014, 378, 2989–2994 CrossRef CAS
 .
.
- S. Lin, X. Ye and J. Huang, Phys. Chem. Chem. Phys., 2015, 17, 888–895 RSC
 .
.
- J. Zhao and Z. Chen, J. Am. Chem. Soc., 2017, 139, 12480–12487 CrossRef CAS PubMed
 .
.
- M. Darvishi Gilan and R. Chegel, J. Electron. Mater., 2018, 47, 1009–1021 CrossRef
 .
.
- M. D. Esrafili and F. A. Rad, ChemistrySelect, 2018, 3, 7402–7409 CrossRef CAS
 .
.
- M. D. Esrafili and N. Saeidi, Appl. Surf. Sci., 2018, 444, 584–589 CrossRef CAS
 .
.
- J. Zhao and Z. Chen, J. Phys. Chem. C, 2015, 119, 26348–26354 CrossRef CAS
 .
.
- M. D. Esrafili, J. Mol. Graphics Modelling, 2019, 86, 209–218 CrossRef CAS PubMed
 .
.
- N. C. Zhang, J. Ren and X. J. Peng, Fullerenes, Nanotubes Carbon Nanostruct., 2016, 24, 298–304 CrossRef CAS
 .
.
- M. Qu, G. Qin, J. Fan, A. Du and Q. Sun, Appl. Surf. Sci., 2021, 555, 149652 CrossRef CAS
 .
.
- Y. Cao, R. Zhang, T. Zhou, S. Jin, J. Huang, L. Ye, Z. Huang, F. Wang and Y. Zhou, ACS Appl. Mater. Interfaces, 2020, 12, 9935–9943 CrossRef CAS PubMed
 .
.
- A. Srivastava, C. Bhat, S. K. Jain, P. K. Mishra and R. Brajpuriya, J. Mol. Model., 2015, 21, 1–8 CrossRef PubMed
 .
.
- G. R. Berdiyorov, M. Neek-Amal, I. A. Hussein, M. E. Madjet and F. M. Peeters, J. Mater. Chem. A, 2017, 5, 2110–2114 RSC
 .
.
- J. Shen, Z. Yang, Y. Wang, L. C. Xu, R. Liu and X. Liu, Appl. Surf. Sci., 2020, 504, 144412 CrossRef CAS
 .
.
- F. Marchelli, E. Cordioli, F. Patuzzi, E. Sisani, L. Barelli, M. Baratieri, E. Arato and B. Bosio, Biomass Bioenergy, 2019, 126, 106–116 CrossRef CAS
 .
.
- Y. Xiao, S. Wang, D. Wu and Q. Yuan, J. Hazard. Mater., 2008, 153, 1193–1200 CrossRef CAS PubMed
 .
.
- Y. Luo, H. H. Funke, J. L. Falconer and R. D. Noble, Ind. Eng. Chem. Res., 2016, 55, 9749–9757 CrossRef CAS
 .
.
- S. Couck, J. Cousin-Saint-Remi, S. Van der Perre, G. V. Baron, C. Minas, P. Ruch and J. F. Denayer, Microporous Mesoporous Mater., 2018, 255, 185–191 CrossRef CAS
 .
.
- J. Lan, D. Cao, W. Wang and B. Smit, ACS Nano, 2010, 4, 4225–4237 CrossRef CAS PubMed
 .
.
- J. P. Perdew, K. Burke and M. Ernzerhof, Phys. Rev. Lett., 1996, 77, 3865 CrossRef CAS PubMed
 .
.
- L. Buimaga-Iarinca and C. Morari, Theor. Chem. Acc., 2014, 133, 1–11 Search PubMed
 .
.
- A. C. Bevilacqua, M. H. Köhler, S. Azevedo and R. J. Baierle, Phys. Chem. Chem. Phys., 2017, 19, 5629–5636 RSC
 .
.
- F. Jensen, Wiley Interdiscip. Rev.: Comput. Mol. Sci., 2013, 3, 273–295 CAS
 .
.
- M. Bahrami, F. Shayeganfar, K. Mirabbaszadeh and A. Ramezani, Acta Mater., 2022, 239, 118292 CrossRef CAS
 .
.
- F. Shayeganfar, J. Phys.: Condens. Matter, 2014, 26, 435305 CrossRef CAS PubMed
 .
.
- F. Shayeganfar, J. Phys. Chem. C, 2014, 118, 27157–27163 CrossRef CAS
 .
.
- R. Vargas-Bernal, Sensors, 2019, 19, 1295 CrossRef CAS PubMed
 .
.
- M. S. C. Mazzoni, R. W. Nunes, S. Azevedo and H. Chacham, Phys. Rev. B: Condens. Matter Mater. Phys., 2006, 73, 073108 CrossRef
 .
.
- T. Guerra, L. R. S. Araujo and S. Azevedo, J. Phys. Chem. Solids, 2019, 135, 109085 CrossRef CAS
 .
.
- R. D. Gonçalves, S. Azevedo and M. Machado, Solid State Commun., 2013, 175, 132–138 CrossRef
 .
.
- A. C. Bevilacqua, M. H. Köhler, S. Azevedo and R. J. Baierle, Phys. Chem. Chem. Phys., 2017, 19, 5629–5636 RSC
 .
.
- E. Rezayei, J. Beheshtian, F. Shayeganfar and A. Ramezani, J. Mol. Model., 2022, 28, 158 CrossRef CAS PubMed
 .
.
-
N. Zettili, Quantum mechanics: concepts and applications, 2003 Search PubMed
 .
.
- F. Shayeganfar and A. Rochefort, Langmuir, 2014, 30, 9707–9716 CrossRef CAS PubMed
 .
.
- F. Shayeganfar, J. Beheshtiyan, M. Neek-Amal and R. Shahsavari, Nanoscale, 2017, 9, 4205–4218 RSC
 .
.
- G. Liu, W. W. Luo, X. Wang, X. L. Lei, B. Xu, C. Y. Ouyang and S. B. Liu, J. Mater. Chem. C, 2018, 6, 5937–5948 RSC
 .
.
- H. Choi, Y. C. Park, Y. H. Kim and Y. S. Lee, J. Am. Chem. Soc., 2011, 133, 2084–2087 CrossRef CAS PubMed
 .
.
- T. Saha, D. Golež, G. De Ninno, J. Mravlje, Y. Murakami, B. Ressel, M. Stupar and P. R. Ribič, Phys. Rev. B, 2021, 103, 144304 CrossRef CAS
 .
.
- A. K. Taib, Z. Johari, S. F. A. Rahman, M. F. Mohd Yusoff and A. Hamzah, PLoS One, 2023, 18, e0282370 CrossRef CAS PubMed
 .
.
- G. Kang, B. Zhang, T. Kang, J. Guo and G. Zhao, Materials, 2020, 13, 2851 CrossRef CAS PubMed
 .
.
|
| This journal is © the Owner Societies 2024 |
Click here to see how this site uses Cookies. View our privacy policy here.  *a and
Ali
Ramazani
*b


![[double bond, length as m-dash]](https://www.rsc.org/images/entities/char_e001.gif) O double bond of a CO2 molecule, where this type of interaction is similar to the finding of Choi et al.72 Furthermore, to investigate the effect of B-doping, which leads to an increase in the adsorption energy, we plotted and analyzed the PDOS (Fig. 4) and charge density (Fig. 3), which explains the details of the variation of adsorption energy and orbital contribution.
O double bond of a CO2 molecule, where this type of interaction is similar to the finding of Choi et al.72 Furthermore, to investigate the effect of B-doping, which leads to an increase in the adsorption energy, we plotted and analyzed the PDOS (Fig. 4) and charge density (Fig. 3), which explains the details of the variation of adsorption energy and orbital contribution.
.
.
.
.
.
.
.
.
.
.
.
.
.
.
.
.
.
.
.
.
.
.
.
.
.
.
.
.
.
.
.
.
.
.
.
.
.
.
.
.
.
.
.
.
.
.
.
.
.
.
.
.
.
.
.
.
.
.
.
.
.
.
.
.
.
.
.
.
.
.
.
.
.
.
.


