 Open Access Article
Creative Commons Attribution 3.0 Unported Licence
Bismuth oxybromide nanosheets as an efficient photocatalyst for dye degradation†
Joy N.
Onwumere‡
 a,
Rong
Hua‡
b,
Guojun
Zhou
a,
Haoquan
Zheng
a,
Rong
Hua‡
b,
Guojun
Zhou
a,
Haoquan
Zheng
 b and
Zhehao
Huang
 *a
*a
aDepartment of Materials and Environmental Chemistry, Stockholm University, Stockholm SE-106 91, Sweden. E-mail: zhehao.huang@mmk.su.se
bSchool of Chemistry and Chemical Engineering, Shaanxi Normal University, Xi'an 710119, China
First published on 31st October 2024
Abstract
The contamination of water resources by organic pollutants presents significant environmental and health challenges. Therefore, it is urgent to develop highly efficient and green approach for treating organic water pollutants. Bismuth oxybromide (BiOBr) has gained attention due to its high photoactivity. In this work, we report a modification to improve its photocatalytic activity. BiOBr were prepared using a capping agent, benzene-1,3,5-tricarboxylic acid, to tune the morphology of the compound. The resulting BiOBr shows nanosheet morphology, which provides a high surface-to-volume ratio and a larger conduction band compared to bulk BiOBr. As a result, the BiOBr nanosheets show the highest efficiency for photodegradation of Rhodamine B, compared to benchmark TiO2 and bulk BiOBr catalysts.
Introduction
By imitating the photosynthesis process of green plants in nature, Akira Fujishima and Kenichi Honda created innovative research on titanium dioxide (TiO2) as a photocatalyst for water splitting in 1972 that initially shed light on the photocatalytic phenomenon and paved the way for a new era of study into metal oxide materials.1 Over the years, metal oxides other than TiO2 have been studied, including zinc oxide (ZnO),2,3 tungsten oxide (WO3),4,5 iron oxide (Fe2O3),6,7 and bismuth oxide (BiOx),8etc. These oxides have a variety of band gaps that allow light to be absorbed in the UV, visible, or even near-infrared ranges, giving them the capacity to capture solar energy for catalytic reactions.Bismuth-based photocatalysts like Bi2O3,9,10 BiOX (X = F, Cl, Br and I),11–13 BiVO4,14,15 Bi2MoO6,16,17 BiTi,18,19etc., have been developed for water treatment because of their promising properties, such as high photocatalytic activity,11,20,21 stability, and great electron mobility.22–24 Among the bismuth compounds, bismuth oxybromide (BiOBr) has gained much attention as a photocatalyst due to its visible-light photocatalytic performance, and stable band gap, which ranges from 2.61 to 2.90 eV.25–27
The agglomeration of photocatalysts has been a great concern as it can affect the reactivity. To address this issue, capping agents, which are usually organic ligands, are introduced during the synthesis. They can selectively bind to crystal planes, thereby directing the crystal growth, and control the morphologies and exposed crystal planes.28–30
Herein, we demonstrate the preparation of a BiOBr by using the capping agent benzene-1,3,5-tricarboxylic to control its crystal growth and morphology. The obtained BiOBr material shows an inter-grown nanosheet morphology. After being used as a photocatalyst for degradation of dyes, which is a major organic pollution source in water, we find the BiOBr exhibits excellent performance compared to bulk BiOBr and benchmark photocatalyst TiO2.
Experimental section
Materials
N,N-Dimethylacetamide and potassium bromide were purchased from Merck, titanium isopropoxide (TIPO) was purchased from Thermoscientific, titanium(IV) oxide and ethylene glycol were purchased from VWR, bismuth(III) nitrate pentahydrate, benzene-1,3,5-tricarboxylic acid and bismuth(III) bromide were purchased from Alfa Aesar, and Rhodamine B (RhB) was purchased from Sigma.Synthesis of BiOBr-1
BiOBr-1 was synthesised by dissolving 1 mmol of bismuth(III) bromide and 0.40 mmol of benzene-1,3,5-tricarboxylic acid in a mixture of 60 mL of ethylene glycol and 10 mL of N,N-dimethylacetamide. After which, 5.0 μL of TIPO was added and ultrasonicated until the mixture was completely dissolved. After that, it was transferred into a 100 mL Teflon-lined stainless-steel autoclave and heated at 150 °C for 3 h. The product was centrifuged and washed with ethanol before drying at room temperature.Synthesis of BiOBr-2
5 mL of 0.2 M of potassium bromide was dissolved in 0.5 g of bismuth(III) nitrate pentahydrate and stirred until dissolved. The mixture was transferred to a Teflon-lined stainless-steel autoclave and heated at 150 °C for 12 h. The product was centrifuged and washed with acetone and water before drying at 70 °C for 12 h.Synthesis of BiOBr-3
BiOBr-3 was synthesised by dissolving 1 mmol of bismuth(III) bromide in a mixture of 60 mL of ethylene glycol and 10 mL of N,N-dimethylacetamide. After which, 5.0 μL of TIPO was added and ultrasonicated until the mixture was completely dissolved. After that, it was transferred into a 100 mL Teflon-lined stainless-steel autoclave and heated at 150 °C for 3 h. The product was centrifuged and washed with ethanol before drying at room temperature.Titanium(IV) oxide was used as purchased.
X-ray diffraction (XRD)
XRD pattern was determined on a Panalytical X'Pert Alpha1 using Cu Kα (λ = 1.5406 Å) radiation in the 2θ range from 5.0 to 55.0°.Scanning electron microscopic (SEM)
The SEM images were recorded using a JEOL JSM-7000F, operating at 15 kV.Transmission electron microscopic (TEM)
Samples for transmission electron microscopy observation were loaded onto a carbon-coated copper grid. The observation was performed on a JEOL JEM2100 microscope at 200 kV (Cs 1.0 mm, point resolution 0.23 nm). TEM images were recorded on a Gatan Orius 833 CCD camera (resolution 2048 × 2048 pixels, pixel size 7.4 μm). Electron diffraction patterns were collected with a Timepix pixel detector QTPX-262k (512 × 512 pixels, pixel size 55 μm, Amsterdam Sci. Ins.).X-ray photoelectron spectroscopy (XPS)
The prepared materials were subjected to X-ray photoelectron spectroscopy (XPS) analysis using a Kratos AXIS ULTRA XPS.Continuous rotation electron diffraction (cRED)
The data were collected using the software Instamatic. A single-tilt tomography holder was used for the data collection, which could tilt from −70° to +70° in the TEM. The aperture used for cRED data collection was about 0.6 μm in diameter. The speed of the goniometer tilt was 0.45° s−1, and the exposure time was 0.3 s per frame. The data was collected within 2 min to minimize the beam damage and maximize the data quality (Table S1†). Data sets were processed using XDS packages2 for structure determination.Photocatalytic dye degradation
RhB dye solution of 8 mg L−1 in DI water and 0.013 M hydrogen peroxide was prepared. For the photocatalytic testing, the catalysts were added to the solution and stirred for 20 minutes in the dark before irradiation with light. The photocatalytic tests were performed in the dark to avoid extraneous irradiation on the sample; thus, only the light from the simulator could reach the sample. 4 mL aliquots of the solution were collected for examination at 20 minute intervals. These aliquots’ absorption was measured at various intervals using a UV-3100PC spectrophotometer (VWR, USA). UV-Vis spectra were first obtained from solutions with known concentrations of RhB solution. Calibration curves were formed by fitting the known concentrations and their UV-Vis absorption. By using the calibration curves, unknown concentrations of RhB solution after photocatalytic tests were determined from their UV-Vis absorption. The resulting absorbance value was then converted to mg L−1, and the observed concentrations were plotted against time to calculate the degradation rate.Results and discussion
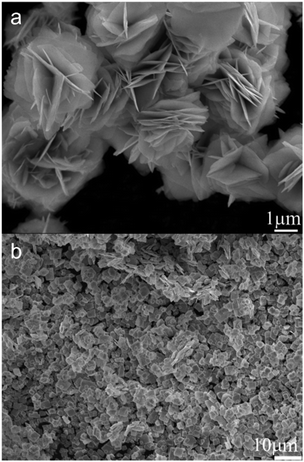
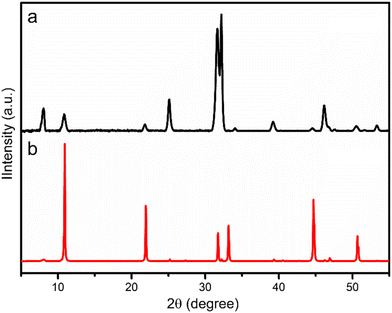
BiOBr typically has a layered structure, which are built by strong electrovalent bonds between [Bi2O2]2+ slab and double Br-slabs.31–35 To control the crystal growth and the resulting morphology, we used benzene-1,3,5-tricarboxylic acid, a capping agent,36 during the synthesis. As a consequence, the morphology of BiOBr changed to aggregated nanosheets (BiOBr-1) from bulk particles (BiOBr-2 and BiOBr-3) (Fig. 1 and S1†). Comparing the PXRD patterns of BiOBr-1 and BiOBr-2 (Fig. 2), profile changes can be observed when the morphology was changed to nanosheets, e.g., peaks at ca. 11°, 22°, and 26°.We applied continuous rotation electron diffraction (cRED) to analyse the single-crystal structure of BiOBr-1 due to its nanosheet morphology. From the 3D reciprocal lattice reconstructed from the cRED data (Fig. 3a), the unit cell parameters can be determined as a = 4.19 Å, b = 4.19 Å, c = 8.41 Å, α = 87.89°, β = 88.89°, and γ = 88.36°, indicating the crystal system could be tetragonal. The two-dimensional (2D) slice cuts of the 3D reciprocal lattice exhibit reflection condition as hk0: h + k = 2n, 0k0: k = 2n (Fig. 3b–d). Thus, the possible space groups for BiOBr-1 are P4/n (no. 85) and P4/nmm (no. 129). The dataset has a high signal-to-noise ratio within the resolution of 0.80 Å, and the structure was solved ab initio by direct methods in the space group P4/nmm. The final refinement was performed by using Shelxl-2018, and the R1 value converged to 0.284 (Table S2†). The structural model shows the same atomic arrangement as the bulk BiOBr in the database37 (Fig. 4). Therefore, the intensities difference in the PXRD patterns (Fig. 2) of BiOBr-1 and BiOBr-2 is due to the preferred orientation of BiOBr-1.
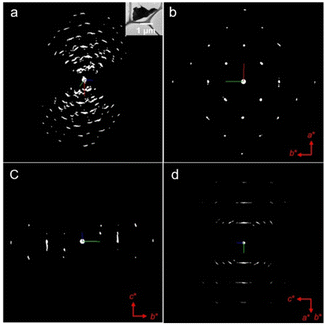 | ||
| Fig. 3 The reconstructed 3D reciprocal lattice of BiOBr-1 (an inset is an image of the crystal from which the cRED data was collected) and 2D slice cuts show the hk0 (b), 0kl (c), and the (d) planes. | ||
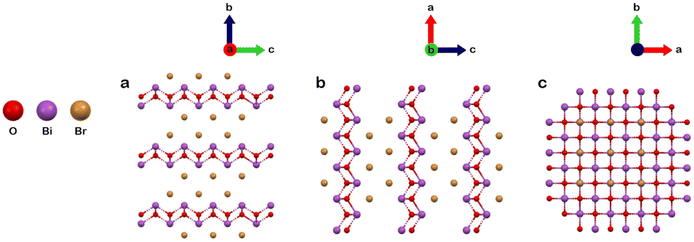 | ||
| Fig. 4 The structural model of BiOBr-1 determined by cRED, viewed from the (a) a-axis, (b) b-axis, and (c) c-axis. | ||
We further performed Pawley fitting to refine the unit cell parameters of BiOBr-1 (Fig. S2†). The unit cell parameters were refined to a = 3.9280(3) Å, c = 8.128(1) Å, and the R-values were converged to Rp = 0. 031, Rwp = 0. 044, and Rexp = 0. 012 (Table S3†). To further validate the structure of BiOBr-1, the PXRD pattern was simulated using the structural model obtained from single crystal analysis and unit cell parameters refined by Pawley fitting (Fig. S3†). It shows that all the peaks match well with the observed pattern, except for the peak at ca. 7.6°. The Bragg conditions calculated from the structural model of BiOBr-1 does not include the peak at ca. 7.6°. Thus, it indicates the peak belongs to a minor phase of impurity in the samples.
We evaluated the photocatalytic performances of BiOBr-1 and compared it to BiOBr-1 and TiO2 by photocatalytic degradation of Rhodamine B (RhB) aqueous solution under simulated solar irradiation. We first submerged the catalysts in RhB aqueous solution and in darkness for 20 minutes to reach adsorption equilibrium to exclude the influence of adsorption (Fig. 5). The photocatalytic degradation baseline is represented by the black and red curves with and without hydrogen peroxide (H2O2), measured without a catalyst. After 100 minutes, TiO2 and BiOBr-2 showed 55% and 36% degradation of RhB, respectively. In a sharp performance improvement, using BiOBr-1 showed 100% degradation after 20 minutes.
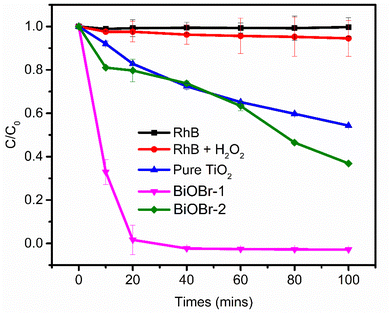 | ||
| Fig. 5 Photocatalytic degradation of RhB. Degradation was carried out using a solar simulator with hydrogen peroxide. | ||
This excellent photocatalytic performance results from the morphological change.39,40 Because the catalytic reaction occurs on the surface of the catalyst, the high surface-to-volume ratio of BiOBr-1 provide high accessible reaction sites. Moreover, we analyzed the exposed facet of BiOBr-1 by electron diffraction. The observed and simulated ED patterns show a good agreement for the preferred orientation along the [001] direction (Fig. 6).
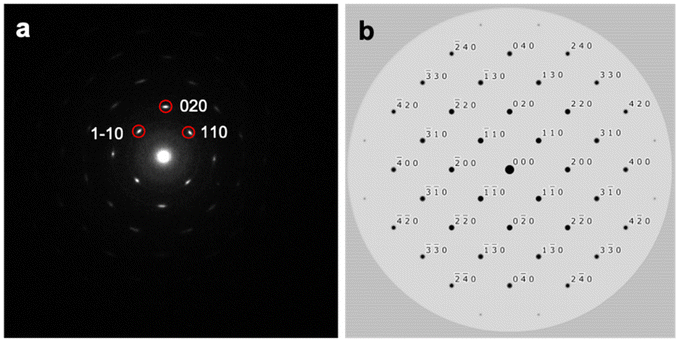 | ||
| Fig. 6 (a) Experimental electron diffraction pattern of BiOBr-1. (b) Simulated electron diffraction pattern by using the obtained BiOBr-1 along the [001] direction. | ||
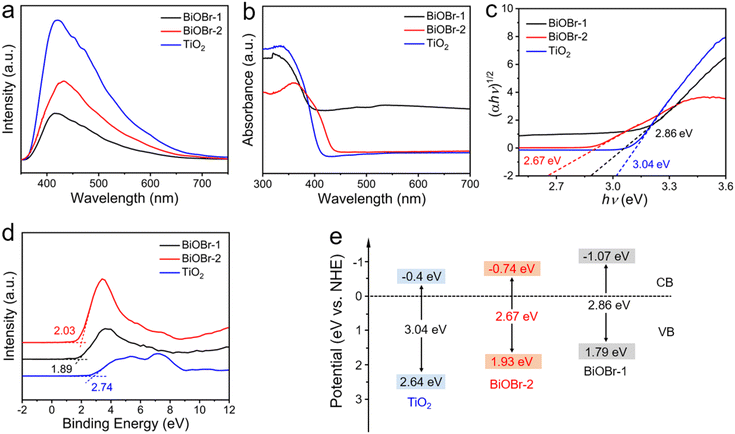
The photocatalytic performance is influenced by the separation and transfer of photogenerated carriers. According to the principle of photoluminescence spectroscopy (PL), the fluorescence peak is produced by the recombination of photoluminescent carriers. Therefore, we further examined the PL spectra to explore the reasons for the enhanced photocatalytic performance. Fig. 7a shows the PL fluorescence peaks of different catalytic materials. The BiOBr-1 exhibited a lower fluorescence peak intensity, indicating a higher carrier separation efficiency. Additionally, solid UV-visible diffuse reflectance spectroscopy (UV-vis DRS) was conducted to determine the electronic band structure of these materials (Fig. 7b). BiOBr-1 showed excellent light absorption in the UV region at about 380 nm. Compared to bulk BiOBr-2, the nanosheet BiOBr-1 showed a shift on the absorption band. The change is due to the dimensionality change from 3D to 2D, the quantum effect and surface effect affected the electronic structures of the materials.38 Subsequently, the band gap energy (Eg) is estimated according to Tauc equation below: (αhv)1/2 = A(hv − Eg), where α, hν, A, and Eg represent the absorption coefficient, photon energy, a constant, and band gap, respectively. As shown in Fig. 7c, the calculated band gaps are 2.86 eV, 2.67 eV, and 3.04 eV for BiOBr-1, BiOBr-2, and TiO2, respectively. The BiOBr-1 and BiOBr-2 exhibit a narrower band gap compared to TiO2, suggesting a wider light absorption range.
In addition to the band gap, the conduction band (CB) and valence band (VB) potentials of the material are critical factors in determining its photocatalytic activity. The VB XPS spectra were carried out to explore the VB energy. The results indicate that the VB energies of BiOBr-1, BiOBr-2, and TiO2 are 1.79 eV, 1.93 eV, and 2.64 eV (vs. NHE), respectively (Fig. 7d). Correspondingly, the CB energy is calculated to be −1.07, −0.74, and −0.4 eV (using the equation ECB = Eg − EVB), respectively. Based on the above results, the band structures of BiOBr-1, BiOBr-2, and TiO2 are shown in Fig. 7e. It is evident that BiOBr-1 presents a lower CB value of about −1.07 eV, indicating its strong oxidation ability and can retain more highly active electrons, which can provide enough active free radicals for the degradation reaction of RhB. Consequently, combined with its high surface-to-volume ratio and preferred orientation, BiOBr-1 showed enhanced activity of photocatalytic degradation of RhB although it has a narrower visible-light absorption.
Conclusion
We synthesized BiOBr-1 with controlled nanosheet morphology by using benzene-1,3,5-tricarboxylic acid as a capping agent. cRED was used to determine the structure of BiOBr-1, which indicates the same structure as BiOBr-2. Nevertheless, BiOBr-1 shows a superior catalytic performance for photodegradation of RhB compared to BiOBr-2, indicating the advantage from the tuned nanosheet morphology. We believe the BiOBr-1 catalyst can be used for photodegradation of other organic pollutants in water.Data availability
The authors confirm that the data supporting the findings of this study are available within the article and its ESI.† Electronic supplementary information (ESI) available: SEM, PXRD analysis, and details of crystallographic analysis.Conflicts of interest
There are no conflicts to declare.Acknowledgements
We acknowledge the Swedish Research Council Formas (2020-00831), and the Swedish Research Council (VR, 2022-02939) for funding support.References
- L. Finegold and J. L. Cude, Nature, 1972, 238, 38–40 CrossRef.
- Y. Wan, J. Li, J. Ni, C. Wang, C. Ni and H. Chen, J. Hazard. Mater., 2022, 435, 129073 CrossRef CAS PubMed.
- M. Dimitropoulos, C. A. Aggelopoulos, L. Sygellou, S. T. Tsantis, P. G. Koutsoukos and S. N. Yannopoulos, J. Environ. Chem. Eng., 2024, 12, 112102 CrossRef CAS.
- X. Fang, M. Yao, L. Guo, Y. Xu, W. Zhou, M. Zhuo, C. Shi, L. Liu, L. Wang, X. Li and W. Chen, ACS Sustainable Chem. Eng., 2017, 5, 10735–10743 CrossRef CAS.
- Y. Shang, C. Wang, C. Yan, F. Jing, M. Roostaeinia, Y. Wang, G. Chen and C. Lv, J. Colloid Interface Sci., 2023, 634, 195–208 CrossRef CAS.
- M. F. Al-Hakkani, G. A. Gouda, S. H. A. Hassan, M. S. Saddik, M. A. El-Mokhtar, M. A. Ibrahim, M. M. A. Mohamed and A. M. Nagiub, Sci. Rep., 2022, 12, 1–20 CrossRef.
- P. C. L. Muraro, S. R. Mortari, B. S. Vizzotto, G. Chuy, C. dos Santos, L. F. W. Brum and W. L. da Silva, Sci. Rep., 2020, 10, 1–9 CrossRef.
- Z. Wu, T. Liao, S. Wang, J. A. Mudiyanselage, A. S. Micallef, W. Li, A. P. O'Mullane, J. Yang, W. Luo, K. Ostrikov, Y. Gu and Z. Sun, Nano-Micro Lett., 2022, 14, 1–17 CrossRef.
- T. Kanagaraj, P. S. Murphin Kumar, R. Thomas, R. Kulandaivelu, R. Subramani, R. N. Mohamed, S. Lee, S. W. Chang, W. J. Chung and D. D. Nguyen, Environ. Res., 2022, 205, 112439 CrossRef CAS.
- H. Li, D. Hu, Z. Li and Y. Qu, Sustainable Energy Fuels, 2020, 4, 5378–5386 RSC.
- Q. Yuan, S. Wei, T. Hu, Y. Ye, Y. Cai, J. Liu, P. Li and C. Liang, J. Phys. Chem. C, 2021, 125, 18630–18639 CrossRef CAS.
- T. Dong, G. Jiang, Y. He, L. Yang, G. Wang and Y. Li, J. Hazard. Mater., 2022, 428, 128207 CrossRef CAS.
- S. M. Fu, G. S. Li, X. Wen, C. M. Fan, J. X. Liu, X. C. Zhang and R. Li, Trans. Nonferrous Met. Soc. China, 2020, 30, 765–773 CrossRef.
- K. Fuku, R. Takioka, K. Iwamura, M. Todoroki, K. Sayama and N. Ikenaga, Appl. Catal., B, 2020, 272, 119003 CrossRef.
- H. Wu, R. Irani, K. Zhang, L. Jing, H. Dai, H. Y. Chung, F. F. Abdi and Y. H. Ng, ACS Energy Lett., 2021, 6, 3400–3407 CrossRef.
- H. Li, W. Hou, X. Tao and N. Du, Appl. Catal., B, 2015, 172–173, 27–36 CrossRef.
- J. Yang, T. Xie, Y. Mei, J. Chen, H. Sun, S. Feng, Y. Zhang, Y. Zhao, J. Wang, X. Li, J. He and H. Chen, Appl. Catal., B, 2023, 339, 123149 CrossRef.
- G. Zaccariello, M. Back, A. Benedetti, P. Canton, E. Cattaruzza, H. Onoda, A. Glisenti, A. Alimonti, B. Bocca and P. Riello, J. Colloid Interface Sci., 2019, 549, 1–8 CrossRef PubMed.
- H. Wang, H. Gang, D. Wei, Y. He, S. Issaka Alhassan, L. Yan, B. Wu, Y. Cao, L. Jin and L. Huang, Sep. Purif. Technol., 2022, 296, 121375 CrossRef.
- T. O. Ajiboye, O. A. Oyewo and D. C. Onwudiwe, Surf. Interfaces, 2021, 23, 100927 CrossRef CAS.
- L. Zhang, Y. Li, Q. Li, J. Fan, S. A. C. Carabineiro and K. Lv, Chem. Eng. J., 2021, 419, 129484 CrossRef CAS.
- G. A. Kallawar, D. P. Barai and B. A. Bhanvase, J. Cleaner Prod., 2021, 318, 128563 CrossRef CAS.
- S. Wu, Z. Xu, J. Zhang and M. Zhu, Sol. RRL, 2021, 5, 1–27 Search PubMed.
- T. O. Ajiboye, O. A. Oyewo and D. C. Onwudiwe, Surf. Interfaces, 2021, 23, 100927 CrossRef CAS.
- P. Intaphong, A. Phuruangrat, K. Karthik, P. Dumrongrojthanath, T. Thongtem and S. Thongtem, J. Inorg. Organomet. Polym. Mater., 2020, 30, 714–721 CrossRef CAS.
- S. S. Imam, R. Adnan and N. H. Mohd Kaus, J. Environ. Chem. Eng., 2021, 9, 105404 CrossRef CAS.
- T. Senasu, T. Chankhanittha, K. Hemavibool and S. Nanan, Catal. Today, 2022, 384–386, 209–227 CrossRef CAS.
- P. Basnet and S. Chatterjee, Nano-Struct. Nano-Objects, 2020, 22, 100426 CrossRef CAS.
- S. Fakhri-Mirzanagh, K. Ahadzadeh-Namin, G. Pirgholi Givi, J. Farazin and Y. Azizian-Kalandaragh, Physica B: Condens. Matter, 2020, 583, 1–7 CrossRef.
- S. R. Yousefi, A. Sobhani, H. A. Alshamsi and M. Salavati-Niasari, RSC Adv., 2021, 11, 11500–11512 RSC.
- J. Zhao, Z. Miao, Y. Zhang, G. Wen, L. Liu, X. Wang, X. Cao and B. Wang, J. Colloid Interface Sci., 2021, 593, 231–243 CrossRef PubMed.
- L. Meng, Y. Qu and L. Jing, Chin. Chem. Lett., 2021, 32, 3265–3276 CrossRef.
- M. Shi, G. Li, J. Li, X. Jin, X. Tao, B. Zeng, E. A. Pidko, R. Li and C. Li, Angew. Chem., 2020, 132, 6652–6657 CrossRef.
- J. Meng, Y. Duan, S. Jing, J. Ma, K. Wang, K. Zhou, C. Ban, Y. Wang, B. Hu, D. Yu, L. Gan and X. Zhou, Nano Energy, 2022, 92, 106671 CrossRef.
- Y. Liu, Y. Zhou, P. Zhu, X. Luo, J. Chen, Y. Li, Q. Qiu and T. Xie, J. Mol. Liq., 2023, 378, 121621 CrossRef.
- M. H. Rosnes, F. S. Nesse, M. Opitz and P. D. C. Dietzel, Microporous Mesoporous Mater., 2019, 275, 207–213 CrossRef.
- J. Ketterer and V. Krämer, Acta Crystallogr., Sect. C: Cryst. Struct. Commun., 1986, 42, 1098–1099 CrossRef.
- L. Li, H. Gao, Z. Yi, S. Wang, X. Wu, R. Li and H. Yang, Colloids Surf., A, 2022, 644, 128758 CrossRef.
- W. He, L. Liu, T. Ma, H. Han, J. Zhu, Y. Liu, Z. Fang, Z. Yang and K. Guo, Appl. Catal., B, 2022, 306, 121107 CrossRef.
- H. Dong, X. Zhang, J. Li, P. Zhou, S. Yu, N. Song, C. Liu, G. Che and C. Li, Appl. Catal., B, 2020, 263, 118270 CrossRef.
Footnotes |
| † Electronic supplementary information (ESI) available. See DOI: https://doi.org/10.1039/d4dt02180k |
| ‡ These authors contributed equally. |
| This journal is © The Royal Society of Chemistry 2024 |

