 Open Access Article
Systems-chart approach to the design of spin relaxation times in molecular qubits
Kathleen R.
Mullin
*a,
Dane
Johnson
b,
Danna E.
Freedman
 b and
James M.
Rondinelli
 a
a
aDepartment of Materials Science and Engineering, Northwestern University, Evanston, Illinois 60208, USA. E-mail: jrondinelli@northwestern.edu; Fax: +1 847 491 7820; Tel: +1 847 491-3198
bDepartment of Chemistry, Massachusetts Institute of Technology, Cambridge, Massachusetts 02139, USA
First published on 24th September 2024
Abstract
Molecular qubits are a promising platform for future quantum information science technologies; however, to find success in novel devices requires that the molecules exhibit long spin relaxation times. Understanding and optimizing these relaxation times has been shown to be challenging and much experimental work has been done to understand how various chemical features of the molecular qubit influence relaxation times. Here we have curated a data set of relaxation times of metal complex molecular qubits and formulated systems design charts to provide a hierarchical organization of how chemical variables affect relaxation times via known physical processes. We demonstrate the utility of the systems charts by combining examples from the literature with calculated descriptors for molecules in the dataset. This approach helps reduce the complexity associated with de novo molecular design by providing a map of interdependencies and identifying features to prioritize during synthesis.
Introduction
Electronic spin molecular qubits show potential as a platform for quantum information science (QIS). While many types of qubits exist, such as superconductors,1,2 trapped ions,3,4 and solid state electron spins qubits,5,6 the flexibility in both structure and chemistry give molecular qubits the unique opportunity to be tailored to a variety of technologies.7,8 To be useful as a qubit, a molecule must fulfill three criteria:1. Be paramagnetic, with each individual ion hosting one or more unpaired electrons;
2. Have an addressable electron spin, allowing for initialization of the molecule's spin state; and
3. Have a long lasting spin state to allow for initialization, necessary operations, and read out of the quantum state.
Most commonly, microwaves are used to address the molecules with electron paramagnetic resonance (EPR) spectroscopy. Some molecular qubits are also optically addressable, allowing optically detected magnetic resonance (ODMR) to be used to probe the molecule's spin state,9 making them promising candidates for quantum sensing. To further develop molecular qubits into functional sensors, long relaxation times are critical. The spin–spin relaxation time (T2) places an upper limit on the interactions that can be detected by the qubit and also represents how long information can be stored in the qubit. The spin–lattice relaxation (T1) describes the impact vibrational-mode-mediated processes have on decoherence.10,11T1 represents how long the molecular spins remain initialized and, when prohibitively short, can also put a limit on T2. Owing to their importance, we focus on relaxation times below as the objective function for molecular design.
The inherent flexibility in molecular qubit design has led to a significant amount of experimental and theoretical work aimed at elucidating how changes in the structure and composition govern molecular properties.12,13 However, the primary focus of these works has been examining how changes to a particular chemical or structural feature in a small family of molecules affects a specific property, e.g. the spin–lattice relaxation time.14,15 Although this is a useful approach to achieve local optimization within a family of molecules, it can limit comprehensive understanding of how to tune multiple molecular properties to achieve a globally optimized design when there are many interacting contributions defining T1 and T2.
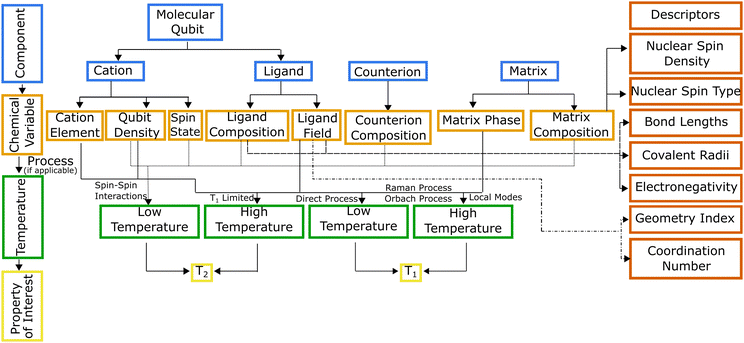
Hierarchical dependencies may be represented visually using a systems chart (Fig. 1). This systems-based method16,17 addresses the information-management challenge that can be mathematically formulated with sufficient data. Generating the data necessary to establish the numerous structure-properties links can be achieved through focused simulations and experiments. The use of this systems approach has led to transformative advances in high-temperature and structural alloys.18 They have found widespread use by DARPA, beginning with its accelerated insertion of materials (AIM) program in the early 2000s leading to what is known today as ICME (integrated computational materials engineering).19 Systems charts, especially when augmented with informatics based approaches,20 then become a robust materials design tool linking roles of processing and structure to a material's performance.21 To that end, data-driven design of molecules offers an alternative approach for optimizing the properties of a molecule for QIS. To illustrate the molecular design process employing a systems-chart approach, we curated a data set of relaxation times from literature and featurized the molecules. We then work through examples of published relaxation times for metal complex molecular qubits, an important figure of merit in qubit performance.22,23 This allows us to understand the microscopic origins of the qubit relaxation times by identifying how changes in their components lead to their performance.
Systems charts for molecular qubit design
We use the systems-chart approach to relate changes in the components of the molecular qubit and its chemistry to changes in relaxation times and relaxation processes. Fig. 2 shows the molecular qubit consists of a central metal cation bonded to one or more ligands. The ligands vary in number and formation and exert a ligand field on the central cation. Ligands are usually organic. A few examples of ligands included in the dataset are mononitrotoluene, trithioxodithiole, and phthalocyanine. Some molecular qubits have a net charge, requiring a counterion to maintain charge balance. The counterion can be located at very short distances to the molecule, where inter-molecular interactions can have strong effects on the qubits performance. Additionally, the molecules are used dilute in a matrix and are either co-crystallized with a diamagnetic analogue of the molecular qubit or mixed with an organic solvent (Fig. 2). As an example, the molecular qubit Cu(acacen) has been studied in solution with the organic solvent O-terphenyl and crystallized in its diamagnetic analogue, Ni(acacen).24 Each component, i.e., the ligand, cation, and matrix, has chemical variables which tune qubit properties like relaxation times. Chemical variables included in these systems charts include the composition of the cation, ligand, matrix, and counterion; density of the qubit in the matrix; matrix phase; and the ligand field.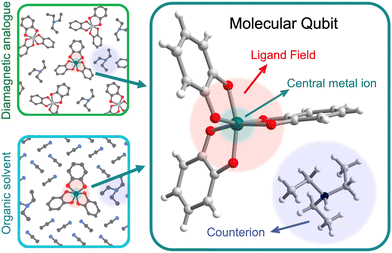 | ||
| Fig. 2 Anatomy of a molecular qubit, prepared in either a diamagnetic host crystal (top left) or glassed in an organic solvent (bottom left). This example of [V(C6H4O2)3][Et3NH]25 illustrates the central metal ion, organic ligands, and counterion that often constitute molecular qubits. V (dark green), carbon (gray), hydrogen (white), oxygen (red), nitrogen (blue). | ||
The linkages in Fig. 1 show the interdependencies among components and specific chemical variables of the molecule and which relaxation times they control. The chemical variables are related to relaxation times through temperature dependent relaxation processes. The systems chart reflects this by including two different temperature regimes. Within these two temperature regimes, different processes control T1 and T2. T2 is impacted by spin–spin interactions, or interactions between the electronic spin of the central cation and neighboring electronic or nuclear spins.26 As temperature increases, T2 is limited by T1 (where 2T1 ≥ T2), so at high temperature, the behavior of T2 is described by the same processes used to describe T1.27T1 is impacted by four processes, all of which are mediated by vibrational modes of the system and allow for energy transfer, relaxing a nonequilibrium spin population to an equilibrium state. Three scattering processes, known as the direct, Raman, and Orbach processes, involve a phonon interacting with the spin causing the release of energy.27 The direct process is limited to low temperatures as the phonon must have the same energy as the spin,28 while any phonon can participate in the Raman or Orbach processes, allowing both processes to occur over a much broader range of temperatures. Like its counterpart for electromagnetic radiation, the Raman process involves excitation to a virtual state, while the Orbach process involves excitation to a real state.29 The local modes process occurs at high temperatures, and like the Raman process, is mediated via specific vibrational modes that cause the geometry of the molecule to distort, impacting T1 through changes to the Zeeman splitting.26,30,31
To better understand these interdependencies, we examined the literature and created a database of relaxation times for rare earth and transition metal complexes with spins from S = 1/2 to S = 5/2 (Fig. 3). At the time, of publication we have included all known literature examples for which relaxation times are reported that we could find. The complete dataset, including all temperature dependent T1 and T2 data and information about the molecule's composition, matrix, and where possible, structural descriptors derived from available crystallographic information (CIF) files are available online.32 A live database is maintained at: https://mtd.mccormick.northwestern.edu/molecular-qubit-database. Submission or updates to the dataset can be made via email as described on the website. We use several literature examples from this dataset to illustrate how the systems chart can be used to understand differences in relaxation times across molecular qubits. We then examine how quantitative descriptors used to featurize the data can be used to understand relaxation times. Finally, we highlight several areas of opportunity where future study is needed to create qubits with longer relaxation times.
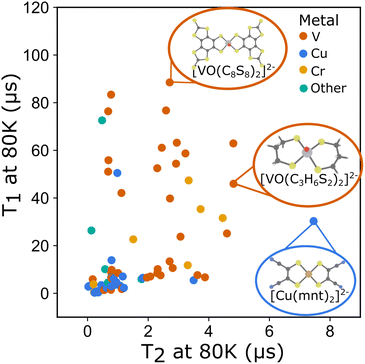 | ||
| Fig. 3 T 1 at 80 K and T2 at 80 K plotted for all molecular qubits included in the dataset. (Inset) Molecular structures of select qubits with long relaxation times. | ||
S = 1/2 paramagnetic molecules
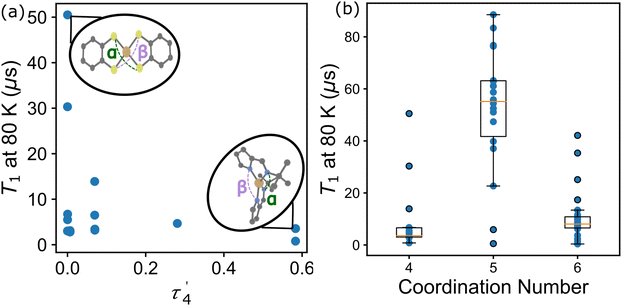
In the first example, Amdur et al. studied a series of four coordinate copper, S = 1/2 complexes.24 Ligands of similar elemental composition were used but the ligand geometry was varied between square planar and tetrahedral, maintaining a 4-fold coordination environment. The results show that changing the ligand field from nearly perfectly square planar to closer to tetrahedral decreases T1 significantly. These changes happen at low temperatures and are mostly related to the direct process. Small deviations from square planar geometry cause small changes to T1, which is caused by the higher temperature local modes process. These changes can be expressed through descriptors like the geometry index, τ′4 which quantifies where a structure is on a scale from 0 (square planar) to 1 (tetrahedral).33τ′4 is calculated aswhere β and α are the two greatest valence angles of the coordination center and β > α. We calculated this descriptor for all S = 1/2 four coordinate complexes in the dataset and plotted the results with T1 at 80 K (Fig. 4a). We only include the data for copper compounds, as there are only 6 non-copper 4-coordinate molecules in the data set. τ′4 lacks a specific trend with T1, but all high performing qubits have near zero values, suggesting that the more rigid square planar geometries lead to longer relaxation times than less rigid tetrahedral geometries.
Atzori et al. examined the effect of the ligand environment and the matrix composition on both square pyramidal oxovanadium and octahedral vanadium complexes.34 The compounds share the same 1,3-dithiole-2-thione-4,5-dithiolate (dmit) ligand, limiting the changes to only the coordination environment and a small change in chemistry (the addition of the oxygen). Atzori et al. found that T1 is longer for the square pyramidal complex, compared to the octahedral complex, and that while T2 is similar for both complexes at lower temperatures, T2 is also longer for the square pyramidal complex at higher temperatures. For T1 this illustrates the effect that the ligand field geometry has on relaxation times, changing the available vibrational modes for the relaxation processes. This effect can be viewed in the data through a simple coordination number descriptor. Across the whole data set, we find that the average T1 at 80 K is highest for 5-coordinate compounds, while 4 and 6-coordinate compounds show both lower average and maximum T1 values at 80 K (Fig. 4b). While the mean and maximum T1 of the 5-coordinate compounds are much higher than other coordination numbers, this value is not a perfect discriminator, as other chemical variables can contribute to T1.
Fataftah et al. studied a series of octahedrally coordinated vanadium complexes and square planar copper complexes.35 The change in coordination environment relates to the ligand field linkages in the systems chart. Shifting from a more rigid environment (like square planar) to a less rigid one decreases T1. Using these same molecules, we can also see the impact of the cation element. Those molecules with copper have longer relaxation times than those with vanadium. Lastly, this experiment looked at changes in ligand chemistry, exchanging a sulfur atom for selenium. The change in chalcogen leads to changes in T1 due to changes in the vibrational modes of the molecule.
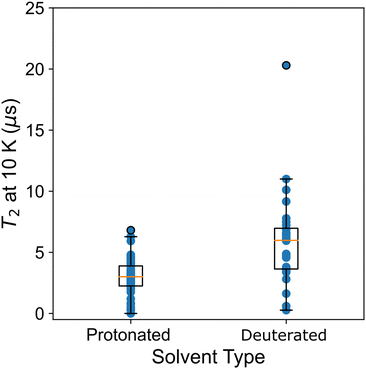
Atzori et al.34 also examined T2 and the effect of matrix composition. Two matrices were considered, a diamagnetic analogue to the molecular qubit that is either deuterated or protonated. The deuterated matrix increases T2 times particularly at low temperature, as the nuclear spin decreases and impacts T2via spin–spin coupling.36 This change has little effect on T1, which is not sensitive to spin–spin coupling. A solvent-type descriptor allows this effect to be quantitatively assessed across the data set. In Fig. 5 we plot T2 at 10 K and the solvent type (protonated or deuterated). We see a significantly higher mean and maximum for deuterated solvents. However, the range in relaxation times for both of these solvents shows significant overlap, showing that other chemical variables, like ligand composition, contribute significantly to T2.
Amdur et al. also examined the effects of hosting the S = 1/2 qubits in different matrices. Both a diamagnetic crystal and an organic solvent were studied. Changing from a diamagnetic analogue to an organic solvent was found to decrease both relaxation times at higher temperature through changing the lattice vibrational modes available for phonon mediated processes.
Jackson et al. showed how counterion composition impacts T2 at low temperature via spin–spin coupling in a series of compounds with a [V(C6H4O2)3]2− molecular qubit and different counterions.37 Four different (R3NH2) counterions were considered where R = Et, 1; n-Bu, 2; n-Hex, 3; n-Oct. This series of ligands allows for increased distance between the molecule and methyl groups in the counterion. In compounds with bulkier counterions and increased distance to the methyl groups, such as n-Oct3NH2−, longer relaxation times are observed compared to those with less bulky counterions.
Bader et al. investigated a series of transition metal phthalocyanines looking at the impact of four different cations (Cu2+, VO2+, Mn2+, Co2+) on T1 and T2.38 Their results showed that VOPc has the longest T1 followed closely by CuPc with MnPc and CoPc having much shorter relaxation times. Changing the cation element, while holding the ligand consistent, creates changes in the spin orbit coupling (SOC), the character of the spin occupied molecular orbital (SOMO), and the spin state of the molecule. VOPc has the smallest SOC of all studied compounds and the longest T1. VOPc and CuPc both have SOMOs that lie in the plane of the molecule whereas the SOMOs for MnPc and CoPc are out of plane and interact more strongly with an applied magnetic field. This same change in cation element that leads to changes in SOMO character also is shown to impact T2 with CuPc and VOPc, showing longer T2 values compared with CoPc and MnPc.
S > 1/2 paramagnetic molecules
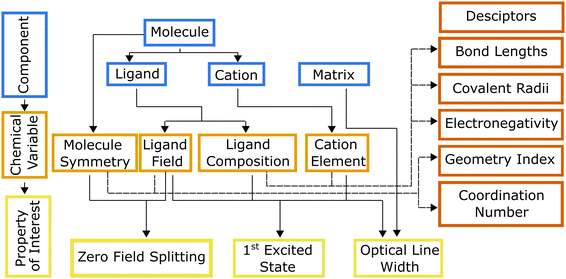
Although a significant amount of literature has been published on S = 1/2 molecules, only 11% of the molecules in our curated dataset have S > 1/2. Exploring molecules with S > 1/2 is particularly interesting owing to recently discovered S = 1 optically addressable qubits.9 Optically addressable qubits must have zero field splitting within the optical range, a first excited state with energy in the optical range, and a narrow optical line width. Optical addressability has been used in solid state spin defect qubits and has been shown to be a more effective interface for qubit control than microwave accessibility.39 Currently discovered optically addressable molecules are all tetrahedral Cr4+R4 complexes except for one trigonal bipyramidal V3+ compound.9,40From this available data, we created a systems chart illustrating how changes in the cation and ligand influence properties of interest (Fig. 6). The descriptors included in Fig. 6 are shared with Fig. 1 and relate to the chemical variables as discussed above. Work on tetrahedral Cr4+R4 systems have shown that changes to the ligand field that alter the molecule's symmetry affect the zero field splitting and relaxation times. Additionally, changes to the matrix have been shown to affect the optical line width. Cr(o-tolyl)4 in a Sn(o-tolyl)4 matrix has an optical inhomogeneous linewidth of ≈150 GHz, while a non-isostructural fluorinated Sn(o-tolyl)4 host matrix has a much smaller optical inhomogeneous line width of ≈3 GHz.41 The V3+ compound, (C6F5)3trenVCNtBu, is an optically addressable molecular qubit candidate but has C3v symmetry, differing substantially from the S4 symmetry in Cr(o-tolyl)4. This change, from 3-fold to 4-fold roto-inversion symmetry, alters the molecule's ligand field and increase zero field splitting values, while still keeping the values in the optically addressable range.
Design opportunities
One future challenge for molecular qubits is realizing supramolecular structures where the placement of qubits can be tightly controlled. For this reason, there is much interest in using metal organic frameworks (MOFs) for future qubit applications. Little research is available on MOFs as molecular qubits, but what is available suggests that their crystal chemistry can have a significant impact on relaxation times. Two studies both use a metal porphyrin as a node in an MOF to understand the role of the molecular framework on the properties of molecular qubits.Yu et al. synthesized a copper(II) porphyrinic framework Zr-Cu-NU-1102 and Cu-PCN-224 to show how MOFs can be used to create arrays with precise qubit–qubit distances and what impact these distances have on relaxation times.42 Zr-Cu-NU-1102 has a 4.5 Å greater qubit–qubit distance compared with Cu-PCN-224 which yields a small increase in T2 for Zr-Cu-NU-1102. A similar effect is seen at low temperatures with T1.
MOFs are also of interest as quantum sensors due to their large surface area. While these structures have not been studied for quantum sensing applications with transition metal qubits, a Mg-based MOF, MgHOTP, has been used to host organic radical qubits and successfully quantitatively sensed lithium ion concentrations.43
Yamabayashi et al. compared relaxation times for [VO(TCPP-Zn2-bpy)], a porous vanadyl-based 3D MOF, and its building block molecule, [VO(TPP)].44 They showed that the molecule in solvent has longer T1 and T2 at low temperature, but that this relationship reverses at higher temperatures when local modes have a larger role in T1. Specifically, the MOF suppressed an important vibrational mode at 67 cm−1, allowing for longer relaxation times.
Heteroleptic molecules, where the metal center is coordinated to multiple types of ligands,45 represent another promising avenue for molecular qubits. Asymmetry in the qubit's ligand environment could enable control of the molecule's orientation when tethered to analytes during sensing experiments. For optically addressable molecules, a low-symmetry ligand field becomes even more important, as the compound could exhibit higher zero field splitting and consequentially higher fidelity during optical initialization. The inclusion of diverse ligands can also alter molecular symmetry and potentially enhance the qubit's sensitivity to electric fields, as seen in solid-state qubits in polar point groups. The dataset presented in this work exclusively features homoleptic molecules due to the lack of experimental data on heteroleptic variants in the literature, highlighting the need to quantify the impact of heterolepticity on the relaxation times of these molecular spins.
Summary
Our analysis reveals that numerous factors contribute to the spin–lattice and spin–spin relaxation processes in molecular systems. The systems-chart approach we propose offers a systematic method for synthesizing the extensive literature data to identify key characteristics of molecular qubits and their environments that predominantly influence T1 and T2. Our curated database demonstrates that while substantial experimental data exists on relaxation times of S = 1/2 molecular qubits, understanding of higher S > 1/2 spin systems remains limited.Developing molecular qubits suitable for practical quantum information science (QIS) applications necessitates an interdisciplinary collaboration among synthetic chemists, theorists, and physicists. This collaborative effort should focus on: (1) identifying niche areas where molecular qubits excel, (2) determining the requisite relaxation parameters for specific applications, and (3) selecting optimal molecular classes to achieve these objectives. Systems charts not only guide the selection of promising molecular classes but also highlight underexplored chemical spaces. Extending this approach to emerging classes of molecular qubits, such as molecular color centers or spin-bearing frameworks, will strategically direct future efforts of synthetic chemists interfacing with quantum information science and technology.
Author contributions
K. R. M. – conceptualization, data curation, formal analysis, investigation, writing – original draft, writing – review & editing, visualization. D. J. – writing – review & editing, visualization. D. E. F. – supervision, writing – review & editing, funding acquisition. J. M. R. – conceptualization, writing – review & editing, supervision, project administration, funding acquisition.Data availability
Data for this article are available at GitHub at https://github.com/MTD-group/Molecular_Qubit_Dataset.Conflicts of interest
There are no conflicts to declare.Acknowledgements
We thank Preston Ngo and Euro Kim for assistance in constructing the dataset. We thank Dr Jerermy Amdur and Dr Daniel Laorenza for insightful discussions. This work was supported by the U.S. Department of Energy, Office of Science, Basic Energy Sciences under award DE-SC0019356.References
- J. Clarke and F. K. Wilhelm, Nature, 2008, 453, 1031–1042 CrossRef CAS PubMed.
- I. Siddiqi, Nat. Rev. Mater., 2021, 6, 875–891 CrossRef.
- A. H. Myerson, D. J. Szwer, S. C. Webster, D. T. C. Allcock, M. J. Curtis, G. Imreh, J. A. Sherman, D. N. Stacey, A. M. Steane and D. M. Lucas, Phys. Rev. Lett., 2008, 100, 200502 CrossRef CAS PubMed.
- C. D. Bruzewicz, J. Chiaverini, R. McConnell and J. M. Sage, Appl. Phys. Rev., 2019, 6, 021314 Search PubMed.
- M. Veldhorst, J. C. C. Hwang, C. H. Yang, A. W. Leenstra, B. de Ronde, J. P. Dehollain, J. T. Muhonen, F. E. Hudson, K. M. Itoh, A. Morello and A. S. Dzurak, Nat. Nanotechnol., 2014, 9, 981–985 CrossRef CAS PubMed.
- T. Kennedy, F. Charnock, J. Colton, J. Butler, R. Linares and P. Doering, Phys. Status Solidi B, 2002, 233, 416–426 CrossRef CAS.
- M. J. Graham, J. M. Zadrozny, M. S. Fataftah and D. E. Freedman, Chem. Mater., 2017, 29, 1885–1897 CrossRef CAS.
- M. Atzori and R. Sessoli, J. Am. Chem. Soc., 2019, 141, 11339–11352 CrossRef CAS PubMed.
- S. L. Bayliss, D. W. Laorenza, P. J. Mintun, B. D. Kovos, D. E. Freedman and D. D. Awschalom, Science, 2020, 370, 1309–1312 CrossRef CAS PubMed.
- A. J. Fielding, S. Fox, G. L. Millhauser, M. Chattopadhyay, P. M. H. Kroneck, G. Fritz, G. R. Eaton and S. S. Eaton, J. Magn. Reson., 2006, 179, 92–104 CrossRef CAS.
- S. K. Hoffmann and S. Lijewski, J. Magn. Reson., 2013, 227, 51–56 CrossRef CAS.
- D. Aravena and E. Ruiz, Dalton Trans., 2020, 49, 9916–9928 RSC.
- M. R. Wasielewski, M. D. E. Forbes, N. L. Frank, K. Kowalski, G. D. Scholes, J. Yuen-Zhou, M. A. Baldo, D. E. Freedman, R. H. Goldsmith, T. Goodson, M. L. Kirk, J. K. McCusker, J. P. Ogilvie, D. A. Shultz, S. Stoll and K. B. Whaley, Nat. Rev. Chem., 2020, 4, 490–504 CrossRef CAS.
- A. J. Fielding, S. Fox, G. L. Millhauser, M. Chattopadhyay, P. M. H. Kroneck, G. Fritz, G. R. Eaton and S. S. Eaton, J. Magn. Reson., 2006, 179, 92–104 CrossRef CAS PubMed.
- M. J. Graham, C.-J. Yu, M. D. Krzyaniak, M. R. Wasielewski and D. E. Freedman, J. Am. Chem. Soc., 2017, 139, 3196–3201 CrossRef CAS PubMed.
- G. B. Olson, Science, 1997, 277, 1237–1242 CrossRef CAS.
- D. L. McDowell and G. B. Olson, in Concurrent design of hierarchical materials and structures, Springer Netherlands, 2008, pp. 207–240 Search PubMed.
- N. R. Council, Accelerating Technology Transition: Bridging the Valley of Death for Materials and Processes in Defense Systems, The National Academies Press, Washington, DC, 2004 Search PubMed.
- N. R. Council, Integrated Computational Materials Engineering: A Transformational Discipline for Improved Competitiveness and National Security, The National Academies Press, Washington, DC, 2008 Search PubMed.
- S. Ramakrishna, T.-Y. Zhang, W.-C. Lu, Q. Qian, J. S. C. Low, J. H. R. Yune, D. Z. L. Tan, S. Bressan, S. Sanvito and S. R. Kalidindi, J. Intell. Manuf., 2018, 30, 2307–2326 CrossRef.
- E. A. Lass, M. R. Stoudt and C. E. Campbell, Integr. Mater. Manuf. Innovation, 2018, 7, 52–69 CrossRef PubMed.
- M. N. Leuenberger and D. Loss, Nature, 2001, 410, 789–793 CrossRef CAS PubMed.
- A. Gaita-Ariño, F. Luis, S. Hill and E. Coronado, Nat. Chem., 2019, 11, 301–309 CrossRef PubMed.
- M. J. Amdur, K. R. Mullin, M. J. Waters, D. Puggioni, M. K. Wojnar, M. Gu, L. Sun, P. H. Oyala, J. M. Rondinelli and D. E. Freedman, Chem. Sci., 2022, 13, 7034–7045 RSC.
- C. Milsmann, A. Levina, H. H. Harris, G. J. Foran, P. Turner and P. A. Lay, Inorg. Chem., 2006, 45, 4743–4754 CrossRef CAS.
- L. Escalera-Moreno, J. J. Baldoví, A. Gaita-Ariño and E. Coronado, Chem. Sci., 2018, 9, 3265–3275 RSC.
- Y. Zhou, B. E. Bowler, G. R. Eaton and S. S. Eaton, J. Magn. Reson., 1999, 139, 165–174 CrossRef CAS PubMed.
- A. Lunghi and S. Sanvito, Sci. Adv., 2019, 5, eaax7163 CrossRef CAS PubMed.
- J. H. Van Vleck, Phys. Rev., 1940, 57, 426–447 CrossRef CAS.
- A. H. Follmer, R. D. Ribson, P. H. Oyala, G. Y. Chen and R. G. Hadt, J. Phys. Chem. A, 2020, 124, 9252–9260 CrossRef CAS PubMed.
- L. Escalera-Moreno, N. Suaud, A. Gaita-Ariño and E. Coronado, J. Phys. Chem. Lett., 2017, 8, 1695–1700 CrossRef CAS.
- K. Mullin and J. M. Rondinelli, Molecular Qubit Dataset, 2024, https://github.com/MTD-group/Molecular_Qubit_Dataset Search PubMed.
- A. Okuniewski, D. Rosiak, J. Chojnacki and B. Becker, Polyhedron, 2015, 90, 47–57 CrossRef CAS.
- M. Atzori, E. Morra, L. Tesi, A. Albino, M. Chiesa, L. Sorace and R. Sessoli, J. Am. Chem. Soc., 2016, 138, 11234–11244 CrossRef CAS.
- M. S. Fataftah, M. D. Krzyaniak, B. Vlaisavljevich, M. R. Wasielewski, J. M. Zadrozny and D. E. Freedman, Chem. Sci., 2019, 10, 6707–6714 RSC.
- J. Rumble , NIST 38. NIST Spectroscopic Properties of Atoms and Atomic Ions Database, 14:10:54 2008.
- C. E. Jackson, T. Ngendahimana, C.-Y. Lin, G. R. Eaton, S. S. Eaton and J. M. Zadrozny, J. Phys. Chem. C, 2022, 126, 7169–7176 CrossRef CAS.
- K. Bader, M. Winkler and J. van Slageren, Chem. Commun., 2016, 52, 3623–3626 RSC.
- Quantum Computing with Defects—PNAS, https://www.pnas.org/doi/full/10.1073/pnas.1003052107.
- M. S. Fataftah, S. L. Bayliss, D. W. Laorenza, X. Wang, B. T. Phelan, C. B. Wilson, P. J. Mintun, B. D. Kovos, M. R. Wasielewski, S. Han, M. S. Sherwin, D. D. Awschalom and D. E. Freedman, J. Am. Chem. Soc., 2020, 142, 20400–20408 CrossRef CAS PubMed.
- S. L. Bayliss, P. Deb, D. W. Laorenza, M. Onizhuk, G. Galli, D. E. Freedman and D. D. Awschalom, Phys. Rev. X, 2022, 12, 031028 CAS.
- C.-J. Yu, S. von Kugelgen, M. D. Krzyaniak, W. Ji, W. R. Dichtel, M. R. Wasielewski and D. E. Freedman, Chem. Mater., 2020, 32, 10200–10206 CrossRef CAS.
- L. Sun, L. Yang, J.-H. Dou, J. Li, G. Skorupskii, M. Mardini, K. O. Tan, T. Chen, C. Sun, J. J. Oppenheim, R. G. Griffin, M. Dincă and T. Rajh, J. Am. Chem. Soc., 2022, 144, 19008–19016 CrossRef CAS PubMed.
- T. Yamabayashi, M. Atzori, L. Tesi, G. Cosquer, F. Santanni, M.-E. Boulon, E. Morra, S. Benci, R. Torre, M. Chiesa, L. Sorace, R. Sessoli and M. Yamashita, J. Am. Chem. Soc., 2018, 140, 12090–12101 CrossRef CAS PubMed.
- H. Kageyama, K. Hayashi, K. Maeda, J. P. Attfield, Z. Hiroi, J. M. Rondinelli and K. R. Poeppelmeier, Nat. Commun., 2018, 9, 772 CrossRef PubMed.
| This journal is © The Royal Society of Chemistry 2024 |

