High-performance electromagnetic wave absorption in FeS2/SnS2@multi-walled carbon nanotube composites with honeycomb-shaped structure
Weiao
Kong†
a,
Xiaohan
Lin†
b,
Chuanhe
Wang
a,
Gen
Li
a,
Zhiqiang
Xue
a,
Shoubing
Wang
a,
Yani
Zhang
a,
Zhidong
Liu
a,
Huanian
Zhang
 a,
Min
Zhang
c,
Wei
Ding
d,
Liping
Guo
*a and
Shugang
Tan
 *a
*a
aSchool of Physics and Optoelectronic Engineering, Shandong University of Technology, Zibo 255000, People's Republic of China. E-mail: guoliping@sdut.edu.cn; tanshugang@sdut.edu.cn
bSchool of Ocean, Yantai University, Yantai 264005, People's Republic of China
cAnhui Province Key Laboratory of Pollutant Sensitive Materials and Environmental Remediation, School of Physics and Electronic Information, Huaibei Normal University, Huaibei 235000, People's Republic of China
dInstitutes of Physical Science and Information Technology, Anhui University, Hefei 230601, People's Republic of China
First published on 21st October 2024
Abstract
In this work, we synthesized composites of ferrous disulfide and tin disulfide with multi-walled carbon nanotubes (MWCNTs) using a straightforward hydrothermal method. The incorporation of carbon nanotubes significantly enhanced the dielectric loss capability of the composites. When the filling ratio of FeS2/SnS2@CNTs (20 wt%) in paraffin was 40%, the effective absorption bandwidth was 3.28 GHz, while the minimum reflection loss (RL) value was as high as −39.2 dB, which corresponded to a thickness of only 1.4 mm. This work reveals the potential research value of this material in terms of thin thickness, strong absorption and light mass.
Introduction
With the rapid development of contemporary industry and society, the demand for electronic devices has significantly increased. The advent of the big data era, the internet of things (IoT) and advanced AI computing models have further amplified this demand across various industries.1–3 Consequently, microwave absorption technology, which supports these electronic devices, has become increasingly critical for enhancing device performance and ensuring human health and safety.4–7 Generally, key performance indicators for these materials mainly include wide bandwidth, thin thickness, light mass and strong absorption.8,9Classical wave-absorbing materials include metal powders,10,11 metal oxides,12,13 spinel ferrite14,15 and silicon carbide ceramics.16,17 These materials benefit from well-established production processes and high stability. However, they often exhibit limitations such as narrow bandwidths, substantial thicknesses and low absorption rates, making them inadequate for meeting higher and more specialized contemporary requirements. In contrast, new materials for electromagnetic wave absorption, such as transition metal sulfides,18 biomass carbon materials,19 carbon-based materials,20 nanomaterials,21 and the complexes between them, have emerged as prominent research directions. These materials have yielded excellent results in recent years. For instance, Zhao et al. developed CuS hollow microspheres that achieved a maximum reflection loss value of −31.5 dB at 16.7 GHz, with an effective absorption bandwidth of 3.6 GHz (from 14.4 to 18.0 GHz) at a thickness of only 1.8 mm.22 Su et al. investigated iron/nickel sulfide nanostructures-filled carbon nanotubes with reflection loss (RL) of −29.58 dB at a thickness of 2.0 mm.23
According to previous studies, SnS2 and FeS2 have been reported in applications such as electrodes, energy storage and photocatalysis. Carbon nanotubes (CNTs), known for their electrical conductivity and high mechanical strength, are widely recognized as versatile nanomaterials. According to previous practical experience, SnS2 is characterized by its two-dimensional sheet structure material, CNTs by their filamentary nanostructures, and FeS2 by its nano-microsphere form, which has a smaller particle size compared to the former two. This led to the development of a concept to construct a basic network structure using filamentary CNTs, leveraging their high mechanical strength. SnS2 2D materials are laid on the mesh structure to form a honeycomb-like configuration with cavities. Subsequently, smaller FeS2 particles are particle sizes are attached to both the surface and interior of this structure. The primary objective of this design is to increase the specific surface area, thereby enhancing dielectric loss and reflection loss. Additionally, while a two-phase material may exhibit a single interfacial polarization, a three-phase material can potentially demonstrate three interfacial polarizations, among other advantageous properties. With these aims and expectations, we have conducted a series of studies to explore the potential of this innovative material structure.
In this work, FeS2/SnS2 composites and FeS2/SnS2@CNTs composites were synthesized using a simple hydrothermal method. By varying the amount of CNTs added, we successfully obtained FeS2/SnS2@CNTs with a honeycomb structure. The microwave absorption properties of these composites were then systematically studied. Ultimately, this work could reveal the potential research value of FeS2/SnS2@CNTs in terms of thin thickness, strong absorption and light mass.
Experimental details
Materials
Thioacetamide (TAA, C2H5NS, 98%) was purchased from Aladdin Reagent Co. Ethanol (99.8%), nitric acid (HNO3) and acetic acid (HAC, CH3COOH) were purchased from Shanghai Sinopharm Chemical Reagent Co. Ferrous chloride hexahydrate (FeCl3·6H2O, 99%), tin chloride pentahydrate (SnCl4·5H2O, 99%) and multi-walled carbon nanotube (the purity >95%) were purchased from Shanghai Macklin Biochemical Co.Synthesis of FeS2/SnS2@CNTs
The acid-treated multi-walled carbon nanotubes (MWCNTS) were prepared in advance through an acidification process. Deionized water and nitric acid were mixed in equal volumes in a beaker, followed by the addition of MWCNTs. The beaker was sealed and sonicated for 1 hour at room temperature. The mixture was then transferred to a hydrothermal kettle and heated in an oven at 120 °C for 10 hours. After cooling to room temperature, the product was washed multiple times with anhydrous ethanol and deionized water. Finally, the product was dried under a vacuum environment with a freeze dryer for 24 hours to obtain MWCNT powder. For the synthesis of composites, 0.45 g of thioacetamide, 0.525 g of ferrous chloride hexahydrate, 0.405 g tin chloride pentahydrate and 2 mL acetic acid were dispersed in a 2![[thin space (1/6-em)]](https://www.rsc.org/images/entities/char_2009.gif) :
:![[thin space (1/6-em)]](https://www.rsc.org/images/entities/char_2009.gif) 1 volume ratio of deionized water to ethanol. Different masses of acidified carbon nanotubes (0 wt%, 5 wt%, 10 wt%, 15 wt%, 20 wt%) were added to the solution, based on the total mass of the final composite. The mixture was stirred with a magnetic stirrer for 1 hour at room temperature. The solutions were then divided among five 100 ml hydrothermal kettles, which were placed in an oven and heated at 160 °C for 16 hours. After cooling to room temperature, each sample was washed with deionized water several times. The final products were dried under a vacuum environment using a freeze-dryer for 24 hours. They were labelled as FeS2/SnS2, FeS2/SnS2@CTNs (5 wt%), FeS2/SnS2@CTNs (10 wt%), FeS2/SnS2@CTNs (15 wt%) and FeS2/SnS2@CTNs (20 wt%) respectively.
1 volume ratio of deionized water to ethanol. Different masses of acidified carbon nanotubes (0 wt%, 5 wt%, 10 wt%, 15 wt%, 20 wt%) were added to the solution, based on the total mass of the final composite. The mixture was stirred with a magnetic stirrer for 1 hour at room temperature. The solutions were then divided among five 100 ml hydrothermal kettles, which were placed in an oven and heated at 160 °C for 16 hours. After cooling to room temperature, each sample was washed with deionized water several times. The final products were dried under a vacuum environment using a freeze-dryer for 24 hours. They were labelled as FeS2/SnS2, FeS2/SnS2@CTNs (5 wt%), FeS2/SnS2@CTNs (10 wt%), FeS2/SnS2@CTNs (15 wt%) and FeS2/SnS2@CTNs (20 wt%) respectively.
Material characterizations
The crystal structure of each material was determined and the composition was analyzed using an X-ray diffractometer (XRD, Bruker Avance D8). The materials FeS2/SnS2 and FeS2/SnS2@CNTs (20 wt%) were characterized using X-ray photoelectron spectroscopy (XPS) to obtain information on the chemical states and bonding modes of each element. The morphology of each material was observed and photographed using a field emission scanning electron microscope (SEM, SU-8226) after conductive gold spray treatment. The elemental composition of FeS2/SnS2@CNTs (20 wt%) was analyzed using an energy spectrometer (EDS, JME 2100). The electromagnetic parameters of each sample, prepared with the same paraffin filling ratio were analyzed by using a vector network analyzer (VNA, AV3629D). The synthesized composite was homogeneously mixed with paraffin wax in a mass ratio of 4![[thin space (1/6-em)]](https://www.rsc.org/images/entities/char_2009.gif) :
:![[thin space (1/6-em)]](https://www.rsc.org/images/entities/char_2009.gif) 6, melted, compressed in a mold (inner diameter = 3.04 mm, outer diameter = 7 mm, thickness <2 mm), and polished with fine-pitch sandpaper to form coaxial annular samples.
6, melted, compressed in a mold (inner diameter = 3.04 mm, outer diameter = 7 mm, thickness <2 mm), and polished with fine-pitch sandpaper to form coaxial annular samples.
Results and discussion
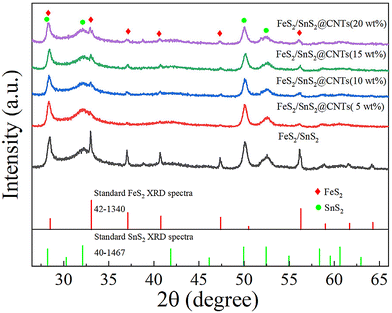
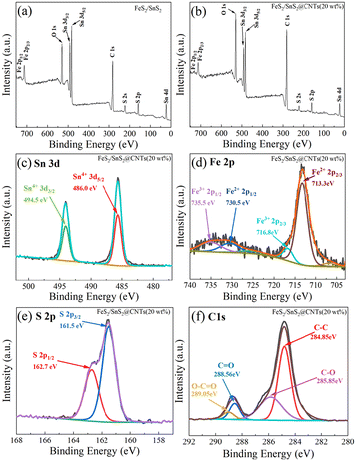
As shown in Fig. 1, the XRD patterns illustrate the presence of FeS2 (JCPDS card no. 42-1340) and SnS2 (JCPDS card no. 40-1467). The six major peaks of FeS2 are located around 28.51°, 33.08°, 37.10°, 40.78°, 47.41° and 56.27°, corresponding to the (111), (200), (210), (211), (220) and (311) crystal planes, respectively. The four major peaks of SnS2 are located around 28.22°, 32.11°, 49.96° and 52.45°, corresponding to the (100), (101), (110) and (111) crystal planes, respectively. No carbon peaks were detected by XRD due to the low content of CNTs in these samples. However, subsequent analyses using XPS, SEM and EDS confirm the presence of CNTs.Fig. 2(a) and (b) show the XPS survey spectra of FeS2/SnS2 and FeS2/SnS2@CNTs (20 wt%), revealing the presence of three elements Sn, Fe and S. Due to the presence of substances like oxygen and carbon dioxide in the air, the detection of elemental oxygen was unavoidable.24,25
 | ||
| Fig. 2 (a) XPS survey spectra of FeS2/SnS2, (b) XPS survey spectra of FeS2/SnS2@CTNs (20 wt%); XPS spectra of (c) Sn 3d, (d) Fe 2p, (e) S 2p and (f) C 1s of FeS2/SnS2@CTNs (20 wt%). | ||
As shown in Fig. 2(c–f), the binding energies corresponding to each peak and companion peak are clearly labeled. In the Sn 3d spectrum (Fig. 2(c)), the peak centered at ∼494.5 eV belongs to Sn 3d3/2, and the Sn 3d5/2 in the peak centered at ∼486.0 eV are both Sn4+ corresponding to SnS2. In the Fe 2p spectrum (Fig. 2(d)), the peaks at ∼713.3 and ∼730.5 eV correspond to Fe2+, while the peaks at ∼716.8 and ∼735.5 eV correspond to Fe3+. In the S 2p spectrum (Fig. 2(e)), the peaks at ∼161.5 eV and ∼162.7 eV are attributed to FeS2 and SnS2, respectively. The XPS analysis incorporates relevant findings from prior research.26Fig. 2(f) shows the C 1s spectrum with four peaks: C–C (∼284.85 eV), C![[double bond, length as m-dash]](https://www.rsc.org/images/entities/char_e001.gif) O (∼288.56 eV), C–O (∼285.85 eV) and O–C
O (∼288.56 eV), C–O (∼285.85 eV) and O–C![[double bond, length as m-dash]](https://www.rsc.org/images/entities/char_e001.gif) O (∼289.05 eV).
O (∼289.05 eV).
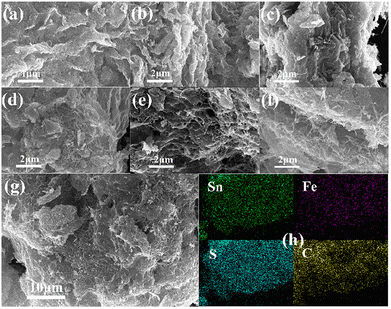
The key factors affecting the microwave absorption properties of the composites can be found through the micromorphology of the composites. Fig. 3(a) and (b) show the structure features of FeS2/SnS2, where FeS2/SnS2 appears in a highly aggregated state with a scaly morphology. Previous studies have indicated that FeS2 exists as microscopic particles under similar conditions.26
In Fig. 3(c) and (d), due to the low content of CNTs, only a small fraction of the CNTs is visible amidst the abundant FeS2/SnS2.
In contrast, Fig. 3(e) and (f) show that the morphology of the sample becomes more scattered and porous. Fig. 3(g) clearly reveals a honeycomb structure. As described earlier, SnS2 flakes are attached to the carbon nanotube mesh structure, where the strong mechanical strength of the CNTs supports the SnS2 flakes. This results in numerous cavities within the material, maintaining the FeS2/SnS2@CNTs composites in a fluffy state and increasing the specific surface area. As the mass ratio of CNTs increases, the material transitions from an agglomerated to a dispersed porous structure, ultimately forming a honeycomb-like configuration.
Fig. 3(h) illustrates the elemental mapping of FeS2/SnS2@CNTs (20 wt%). Different elements are marked with different colors, clearly showing the uniform distribution of Sn, Fe, S and C within the FeS2/SnS2@CNTs (20 wt%) composite.
The real part of the permittivity (ε′) of FeS2/SnS2@CNTs composites, as shown in Fig. 4(a), decreases over the frequency range of 2 to 18 GHz. The real part of the permittivity (ε′) and the imaginary part of the permittivity (ε′′) represent the electrical storage capacity and dielectric loss capacity of the material, respectively. As shown in Fig. 4(a) and (b), both ε′ and ε′′ values increase with the addition of carbon nanotubes. This increase may be attributed to the strong mechanical strength of the CNTs, which causes the initially aggregated FeS2/SnS2 to become more dispersed as the CNTs content increases, thereby enhancing the formation of a conductive network.27
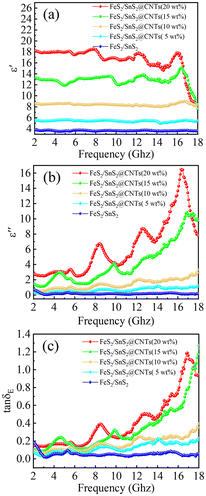 | ||
Fig. 4 (a) Real part of complex dielectric constant (ε′), (b) imaginary part of the real part of complex dielectric constant (ε′′), and (c) tangent of dielectric loss (tan![[thin space (1/6-em)]](https://www.rsc.org/images/entities/char_2009.gif) δε) for each sample. δε) for each sample. | ||
Additionally, the curves for FeS2/SnS2@CNTs (15 wt%) and FeS2/SnS2@CNTs (20 wt%) in Fig. 4 show prominent resonance peaks. The interfacial polarization and dipole effects of the nanohybrid materials contribute to the enhancement, as well as to the defects and disorder within the materials.28 A critical value for these effects, produced by the hybridization, might be reached when the CNTs content is around 15 wt%. Observing Fig. 4(b) and (c), the ε′′ and tan![[thin space (1/6-em)]](https://www.rsc.org/images/entities/char_2009.gif) δε (tan
δε (tan![[thin space (1/6-em)]](https://www.rsc.org/images/entities/char_2009.gif) δε = ε′′/ε′) of the FeS2/SnS2@CNTs (15 wt%) composite are comparable to those of the FeS2/SnS2@CNTs (20 wt%) composite in certain frequency ranges of electromagnetic waves. However, overall, the FeS2/SnS2@CNTs (20 wt%) composite demonstrates superior performance across most frequency ranges. Moreover, the dielectric loss capability of the FeS2/SnS2@CNTs (20 wt%) composite is superior to that of the other four samples in the majority of cases.
δε = ε′′/ε′) of the FeS2/SnS2@CNTs (15 wt%) composite are comparable to those of the FeS2/SnS2@CNTs (20 wt%) composite in certain frequency ranges of electromagnetic waves. However, overall, the FeS2/SnS2@CNTs (20 wt%) composite demonstrates superior performance across most frequency ranges. Moreover, the dielectric loss capability of the FeS2/SnS2@CNTs (20 wt%) composite is superior to that of the other four samples in the majority of cases.
In conclusion, varying the mass fraction of carbon nanotubes in the composite material revealed critical thresholds and underlying trends in dielectric constants. This approach facilitated the identification of the composite with the most favorable dielectric properties for enhanced microwave absorption.
Previous studies have demonstrated that the incorporation of carbon nanotubes (CNTs) can enhance the interfacial and polarization charges within composites.29
The dielectric loss mechanisms encompass both conductivity loss and polarization loss. Polarization loss includes electronic polarization, ionic polarization, interfacial polarization and dipole polarization. The discussion of electronic polarization and ionic polarization has been excluded from this work due to their relevance solely to high-frequency electromagnetic waves, which fall completely outside the frequency range (2–18 GHz) investigated in this work.
Nanomaterials typically exhibit defects.30 This is one of the inherent properties of the materials. The same material may possess diversified defects. Take the two-dimensional material SnS2 as an example, where vacancies exist.31 As depicted in Fig. 9, they have multiple forms. Various forms of defects will generate a large number of dipoles. When subjected to electromagnetic waves, these dipoles become polarized.
FeS2/SnS2@CNTs is a heterogeneous medium. The dielectric properties of FeS2, SnS2 and CNTs are distinct from each other. The Schottky barrier is formed at the interface between materials with different dielectric properties. A large amount of free charge accumulates at the interface under the influence of an applied electric field. The large amount of accumulated charge and the heterogeneous interface form a capacitive-like structure, resulting in interfacial polarization.
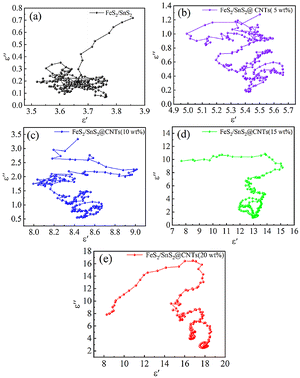
The Debye relaxation is associated with dipole polarization and interface polarization, whereby each form of polarization signifies the occurrence of a Debye relaxation. Each semicircle observed in the Cole–Cole plot corresponds to a Deby relaxation phenomenon. Debye theory can be expressed in the following equation:32,33
 | (1) |
In addition to the real (ε′) and imaginary (ε′′) parts of the dielectric constant mentioned above, there are the static dielectric constant at the limiting frequency (εs) and the dielectric constant at the limiting frequency (ε∞) in the above equation.
In combination with the above theories, Fig. 5 can be explained. Observing Fig. 5(a)–(c), almost no clear Cole–Cole semicircles can be found. This indicated that the phenomenon of Debye relaxation due to interfacial polarization and dipole polarization in FeS2/SnS2 composites was not appreciable. Fig. 5(d) and (e) can clearly observe some Cole–Cole semicircles. With the addition of CNTs, the intensity of relaxation increases significantly. The increase in Debye relaxation signifies an augmentation in polarization, thereby indicating a rise in dielectric loss. From this point of view, the incorporation of CNTs was beneficial for the improvement of microwave absorption performance.
 | ||
| Fig. 5 Cole semicircle curves of (a) FeS2/SnS2, (b) FeS2/SnS2@CNTs (5 wt%), (c) FeS2/SnS2@CNTs (10 wt%), (d) FeS2/SnS2@CNTs (15 wt%), (e) FeS2/SnS2@CNTs (20 wt%). | ||
Reflection loss (RL) is an essential way to evaluate the microwave absorption capacity, combined with transmission line theory, the relevant calculation formulas are as follows:34–36
 | (2) |
 | (3) |
Fig. 6 shows the reflection loss (RL) of FeS2/SnS2@CNTs composites with different mass percentages of CNTs at different thicknesses in the frequency range from 2 to 18 GHz. Typically, an RL value below −10 dB signifies the effective microwave absorption capacity of the absorber. Furthermore, we employ this criterion to ascertain the absorber's bandwidth range.
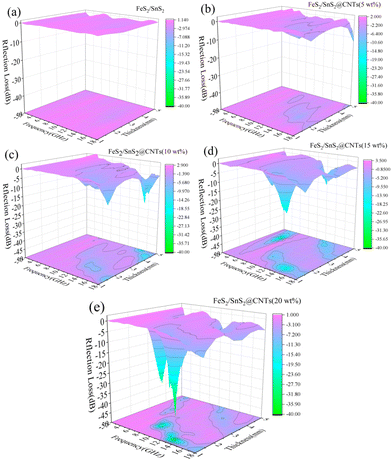 | ||
| Fig. 6 Reflection loss 3D projection of (a) FeS2/SnS2, (b) FeS2/SnS2@CNTs (5 wt%), (c) FeS2/SnS2@CNTs (10 wt%), (d) FeS2/SnS2@CNTs (15 wt%), (e) FeS2/SnS2@CNTs (20 wt%). | ||
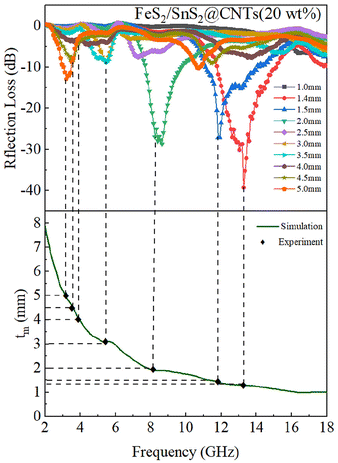
Fig. 6(a) shows the RL of FeS2/SnS2, and the RL value is above −10 dB over the whole frequency range, which can be considered as no performance. As shown in Fig. 6(b), there are some insignificant changes in the RL values. Fig. 6(c) shows the RL of FeS2/SnS2@CNTs (10 wt%) composites, which exhibit a reflection loss of −21.6 dB at 15.2 GHz, corresponding to a thickness of 5 mm. The reflection loss of FeS2/SnS2@CNTs (15 wt%) is depicted in Fig. 6(d), exhibiting a significant alteration in the material, with a remarkable −30.3 dB reflection loss observed at 4 mm thickness and 4.9 GHz frequency. The RL of FeS2/SnS2@CNTs (20 wt%) composites, as depicted in Fig. 6(e), exhibits a complete transformation of the material. The effective absorption bandwidth of FeS2/SnS2@CNTs (20 wt%) is measured to be 3.28 GHz from 11.84 GHz to 15.12 GHz, and the reflection loss (RL) at 13.28 GHz is measured to be −39.2 dB, corresponding to a thickness of merely 1.4 mm. It is obvious that the FeS2/SnS2@CNTs (20 wt%) shows excellent microwave absorption performance in this work.
The quarter-wavelength matching theory (λ/4) corresponds to the following relational equation:37,38
 | (4) |
By observing the simulation results of Fig. 7, it can be understood that most of the experimental points fall very accurately on the λ/4 analog curve. This shows that the experimental results were consistent with the λ/4 theory, corroborating the plausibility of the experimental results.
When the incident electromagnetic wave enters the inside of the absorber material, the less electromagnetic wave is reflected out, the less electromagnetic wave is transmitted out, the better the microwave absorption effect. Impedance matching generally reflects this ability. So good impedance matching is necessary.
The impedance matching degree is expressed as Δ:38
| Δ = |sinh2(Kfd) − M| | (5) |
 | (6) |
 | (7) |
δ e and δm represent the tangent values of the dielectric and magnetic losses, respectively.
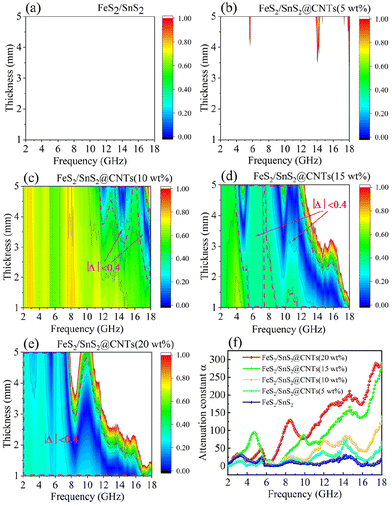
The more Δ tends to 0, the better the impedance matching of the material. In most cases, the absorption of electromagnetic waves is achieved very effectively when |Δ| ≤ 0.4. Based on this criterion, the range of |Δ| ≤ 0.4 is delineated by the dashed line in the impedance matching diagram of Fig. 8.39
Fig. 8 illustrates the impedance matching plots (|Δ|) for each sample in the same frequency and thickness range. FeS2/SnS2 does not exhibit any corresponding |Δ| value within the range of 0 to 1, indicating poor performance, as depicted in Fig. 8(a). Almost the same is true for Fig. 8(b), which does not have any region that reaches |Δ| ≤ 0.4. The impedance matching of FeS2/SnS2@CNTs improves gradually with the addition of more CNTs. Compared with other sample materials, it can be clearly seen that the impedance matching image of FeS2/SnS2@CNTs (20 wt%) material has a darker color and a larger area within |Δ| ≤ 0.4. This proved that the FeS2/SnS2@CNTs (20 wt%) composites had better impedance matching compared to the other sample materials in Fig. 8.
The performance of microwave absorbing materials is not judged exclusively on the basis of impedance matching, so the analysis of attenuation constants (α, ability of energy conversion) was mentioned next.40
The attenuation constant can be calculated as follows:
 | (8) |
Observing Fig. 8(f), it can be clearly seen that the attenuation constant of FeS2/SnS2@CNTs (20 wt%) composite is basically superior to the other sample materials in this article.
Generally speaking, the strong microwave absorption ability of a sample is not necessarily strong in every aspect, and a comprehensive evaluation is needed. However, the FeS2/SnS2@CNTs (20 wt%) composite material is mainly superior to the other sample materials in this article in terms of impedance matching, attenuation constant and sample morphology. Therefore, this article does not provide additional explanations on this aspect.
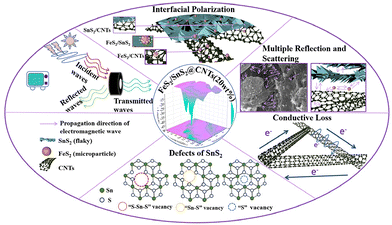
There are some electromagnetic waves in nature. The electromagnetic waves that reach the surface of the absorber from the external environment are called incident waves. The electromagnetic waves reflected from the surface of the absorber into the air are called reflection waves. The remaining electromagnetic waves enter the absorber and effectively attenuate in the form of heat through conduction loss, dielectric loss and magnetic loss, which are called absorption waves. The unlost electromagnetic wave will penetrate the absorber and form a transmitted wave after repeated reflection. The ideal microwave-absorbing material should have the characteristics of absorbing and losing incident waves and suppressing reflected waves and transmitted waves.
Fig. 9 shows the cause of microwave absorption in the materials of the sample of this work. First, the incorporation of CNTs facilitates the dispersion of the FeS2/SnS2 composite material, resulting in the formation of a honeycomb-like structure with pores due to the mesh structure provided by the CNTs themselves. This porous structure enhances the reflection and scattering of incident waves and provides a greater number of active sites for electromagnetic waves. Second, the dispersed scale-like FeS2/SnS2 and the reticulated CNTs synergistically establish a sophisticated and extensive conductive network, resulting in an augmented conduction loss. Third, the interfaces between FeS2, SnS2 and CNTs with different dielectric properties increase the interfacial polarization. Fourth, the defects in nanomaterials can cause dipole polarization. Ultimately, the incorporation of CNTs improves the impedance matching and dielectric loss capabilities of the absorber, thereby enhancing its microwave absorption performance.
Conclusions
In summary, FeS2/SnS2 and FeS2/SnS2@CNTs (5 wt%, 10 wt%, 15 wt%, 20 wt%) composites were prepared by a simple hydrothermal method, respectively. The FeS2/SnS2 composites were attached to a mesh structure composed of carbon nanotubes. A special shape resembling a honeycomb structure was eventually formed. This porous structure enhances the reflection and scattering of incident waves, provides a greater number of active sites for electromagnetic waves, and increases the capacity for conduction loss. As the mass percentage of carbon nanotubes (CNTs) varies, the material's properties undergo corresponding changes. Compared to other composites in this work, FeS2/SnS2@CNTs (20 wt%) exhibits superior microwave absorption properties. The effective absorption bandwidth (EBA) of FeS2/SnS2@CNTs (20 wt%) is measured to be 3.28 GHz and the minimum reflection loss (RLmin) is measured to be −39.2 dB, corresponding to a thickness of merely 1.4 mm. This work reveals the potential research value of this material in terms of thin thickness, strong absorption and light mass.Author contributions
Weiao Kong: writing – original drafts, research experiments. Xiaohan Lin: writing – original drafts, research experiments. Chuanhe Wang: formal analysis. Gen Li: formal analysis. Zhiqiang Xue: formal analysis. Shoubing Wang: formal analysis. Yani Zhang: formal analysis. Zhidong Liu: formal analysis. Huanian Zhang: methodology. Min Zhang: methodology. Wei Ding: methodology. Liping Guo: methodology. Shugang Tan: writing – review & editing, supervision.Data availability
All data supporting the findings of this study are available within the main text. All relevant data are available from the corresponding authors upon reasonable request.Conflicts of interest
There are no conflicts to declare.Acknowledgements
This work was supported by the National Nature Science Foundation of China under contract no. 51802177, the Key Natural Science Research Project for Colleges and Universities of Anhui Province (2022AH050403 and 2022AH050401) and Support Program for Outstanding Young Talents in Colleges and Universities of Anhui Province (gxyq2022023).References
- P. Liu, S. Gao, X. Liu, Y. Huang, W. He and Y. Li, Composites, Part B, 2020, 192, 107992 CrossRef CAS.
- R. Verganti, L. Vendraminelli and M. Iansiti, J. Prod. Innovation Manage., 2020, 37, 212–227 CrossRef.
- N. Jayaraju, M. Pramod Kumar, G. Sreenivasulu, T. Lakshmi Prasad, B. Lakshmanna, K. Nagalaksmi and M. Madakka, Sustainable Technol. Entrepreneurship, 2023, 2, 100031 CrossRef.
- Y. Li, X. Li, Q. Li, Y. Zhao and J. Wang, J. Alloys Compd., 2022, 909, 164627 CrossRef CAS.
- M. Chang, Z. Jia, S. He, J. Zhou, S. Zhang, M. Tian, B. Wang and G. Wu, Composites, Part B, 2021, 225, 109306 CrossRef CAS.
- W. Gu, J. Zhang, Q. Sun and Z. P. Xu, Mater. Today Sustainability, 2024, 25, 100624 CrossRef.
- M. Dong, M. Peng, W. Wei, H. Xu, C. Liu and C. Shen, J. Mater. Chem. C, 2021, 9, 2178–2189 RSC.
- Z. Wang, L. Wu, J. Zhou, W. Cai, B. Shen and Z. Jiang, J. Phys. Chem. C, 2013, 117, 5446–5452 CrossRef CAS.
- X. Wang, C. Zhao, C. Li, Y. Liu, S. Sun, Q. Yu, B. Yu, M. Cai and F. Zhou, J. Mater. Sci. Technol., 2024, 180, 207–225 CrossRef CAS.
- F. Wen, W. Zuo, H. Yi, N. Wang, L. Qiao and F. Li, Phys. B, 2009, 404, 3567–3570 CrossRef CAS.
- Z. Jia, D. Lan, K. Lin, M. Qin, K. Kou, G. Wu and H. Wu, J. Mater. Sci.: Mater. Electron., 2018, 29, 17122–17136 CrossRef CAS.
- H. Pang, Y. Duan, L. Huang, L. Song, J. Liu, T. Zhang, X. Yang, J. Liu, X. Ma, J. Di and X. Liu, Composites, Part B, 2021, 224, 109173 CrossRef CAS.
- T. Hou, B. Wang, Z. Jia, H. Wu, D. Lan, Z. Huang, A. Feng, M. Ma and G. Wu, J. Mater. Sci.: Mater. Electron., 2019, 30, 10961–10984 CrossRef CAS.
- C. Ge, C. Lei, B. Wang, Z. Peng, Z. Wang and X. Ge, Solid State Commun., 2023, 372, 115306 CrossRef CAS.
- A. Houbi, Z. A. Aldashevich, Y. Atassi, Z. Bagasharova Telmanovna, M. Saule and K. Kubanych, J. Magn. Magn. Mater., 2021, 529, 167839 CrossRef CAS.
- W. Duan, X. Yin, Q. Li, L. Schlier, P. Greil and N. Travitzky, J. Eur. Ceram. Soc., 2016, 36, 3681–3689 CrossRef CAS.
- W. Duan, X. Yin, Q. Li, X. Liu, L. Cheng and L. Zhang, J. Eur. Ceram. Soc., 2014, 34, 257–266 CrossRef CAS.
- B. Li, F. Wang, K. Wang, J. Qiao, D. Xu, Y. Yang, X. Zhang, L. Lyu, W. Liu and J. Liu, J. Mater. Sci. Technol., 2022, 104, 244–268 CrossRef CAS.
- Y. Jiang, P. Yin, L. Zhang and L. Zhang, Powder Technol., 2021, 394, 853–862 CrossRef CAS.
- H. Guan, Q. Wang, X. Wu, J. Pang, Z. Jiang, G. Chen, C. Dong, L. Wang and C. Gong, Composites, Part B, 2021, 207, 108562 CrossRef CAS.
- M. Green and X. Chen, J. Materiomics, 2019, 5, 503–541 CrossRef.
- B. Zhao, G. Shao, B. Fan, W. Zhao, Y. Xie and R. Zhang, J. Mater. Chem. A, 2015, 3, 10345–10352 RSC.
- Q. Su, J. Li, G. Zhong, G. Du and B. Xu, J. Phys. Chem. C, 2011, 115, 1838–1842 CrossRef CAS.
- W. Zhang, X. Jiang, X. Wang, Y. V. Kaneti, Y. Chen, J. Liu, J. S. Jiang, Y. Yamauchi and M. Hu, Angew. Chem., Int. Ed., 2017, 56, 8435–8440 CrossRef CAS PubMed.
- Z. Li, X. Han, Y. Ma, D. Liu, Y. Wang, P. Xu, C. Li and Y. Du, ACS Sustainable Chem. Eng., 2018, 6, 8904–8913 CrossRef CAS.
- Y. Chen, H. Liu, X. Guo, S. Zhu, Y. Zhao, S. Iikubo and T. Ma, ACS Appl. Mater. Interfaces, 2021, 13, 39248–39256 CrossRef CAS PubMed.
- Z. Sun, Z. Yan, K. Yue, A. Li and L. Qian, Appl. Surf. Sci., 2021, 538, 147943 CrossRef CAS.
- C. Liu, B. Wang, C. Zhang, C. Mu, F. Wen, J. Xiang, A. Nie and Z. Liu, J. Alloys Compd., 2019, 810 CAS.
- R. Peymanfar, E. Selseleh-Zakerin and A. Ahmadi, J. Alloys Compd., 2021, 867, 159039 CrossRef CAS.
- T. Qiang and Y. Xia, J. Alloys Compd., 2020, 845, 156155 CrossRef CAS.
- S.-Q. Guo, B. Yang, Z. Hu, M. Zhen, B. Gu and B. Shen, Nano Res., 2022, 16, 2102–2110 CrossRef.
- X. Sun, Z. Wang, S. Wang, Y. Ning, M. Yang, S. Yang, L. Zhou, Q. He and Y. Li, Chem. Eng. J., 2021, 422, 130142 CrossRef CAS.
- R. Peymanfar and N. Khodamoradipoor, Phys. Status Solidi A, 2019, 216, 1900057 CrossRef.
- Y. Wu, R. Shu, X. Shan, J. Zhang, J. Shi, Y. Liu and M. Zheng, J. Alloys Compd., 2020, 817, 152766 CrossRef CAS.
- A. Garg, S. Goel, A. K. Dixit, M. K. Pandey, N. Kumari and S. Tyagi, Mater. Chem. Phys., 2021, 257, 123771 CrossRef CAS.
- G. Chen, L. Zhang, B. Luo and H. Wu, J. Colloid Interface Sci., 2022, 607, 24–33 CrossRef CAS PubMed.
- M. Qiao, X. Lei, Y. Ma, L. Tian, W. Wang, K. Su and Q. Zhang, J. Alloys Compd., 2017, 693, 432–439 CrossRef CAS.
- D. Ding, Y. Wang, X. Li, R. Qiang, P. Xu, W. Chu, X. Han and Y. Du, Carbon, 2017, 111, 722–732 CrossRef CAS.
- D. Liu, Y. Du, F. Wang, Y. Wang, L. Cui, H. Zhao and X. Han, Carbon, 2020, 157, 478–485 CrossRef CAS.
- W. Uddin, S. u. Rehman, M. A. Aslam, S. u. Rehman, M. Wu and M. Zhu, Mater. Res. Bull., 2020, 130, 110943 CrossRef CAS.
Footnote |
| † The authors contributed equally to the article. |
| This journal is © The Royal Society of Chemistry 2024 |

