 Open Access Article
Creative Commons Attribution 3.0 Unported Licence
High-pressure synthesis and crystal structure analysis of PbTeO4, a UV transparent material†
Michael
Hladik
a,
Armin
Penz
 a,
Felix R. S.
Purtscher
 a,
Thomas S.
Hofer
 a,
Gunter
Heymann
 *a and
Matthias
Weil
 *b
*b
aDepartment of General, Inorganic and Theoretical Chemistry, Universität Innsbruck, Center for Chemistry and Biomedicine, Innrain 80-82, 6020 Innsbruck, Austria. E-mail: Gunter.Heymann@uibk.ac.at
bInstitute for Chemical Technologies and Analytics, Division of Structural Chemistry, TU Wien, Getreidemarkt 9/E164-05-1, 1060 Vienna, Austria. E-mail: Matthias.Weil@tuwien.ac.at
First published on 31st October 2024
Abstract
Using the additional parameter pressure (Walker-type multianvil device), the lead(II) oxidotellurate(VI) PbTeO4 was synthesized at conditions of 8 GPa and 750 °C, and for the first time its crystal structure was determined using single-crystal X-ray diffraction data. PbTeO4 crystallizes with four formula units in the monoclinic space group I2/a with unit cell parameters a = 5.4142(4), b = 4.9471(4), c = 12.0437(11) Å, β = 99.603(3)°, and V = 318.07(5) Å3. UV-Vis measurements revealed UV transparency down to 200 nm. From the diffuse reflectance data experimental band gaps (Eg(direct) = 2.9 eV/Eg(indirect) = 2.8 eV) were determined and compared with calculated values. Temperature-dependent X-ray powder diffraction and complementary thermal analysis measurements revealed a stability range of PbTeO4 up to 625 °C. Additionally, theoretical calculations at DFT level of theory were carried out to obtain the electronic band structure, X-ray powder diffraction patterns, IR/Raman vibrational spectra and Mulliken partial charges. The electron localization function (ELF) was visualized to emphasize the presence of the electron lone pair E in the coordination sphere of the PbII atom.
Introduction
PbTe is a narrow gap semiconductor and an important thermoelectric material for mid-range temperature (600–800 K) applications.1,2 Its function is diminished by surfacial oxidation products that can form under atmospheric working conditions.3 Hence, it is of importance to have knowledge on the formation conditions, stability ranges and crystal structures of phases in the system Pb–Te–O,4–7 for which the following ternary compounds have been structurally determined so far: three polymorphs of PbIITeIVO3 (α-,8,9 β-,10,11 γ-12), PbIITeIV5O11,13 PbII2TeIV3O8,14,15 PbII2TeVIO5![[thin space (1/6-em)]](https://www.rsc.org/images/entities/char_2009.gif) 16 and PbII5TeVIO8.16 PbTeO4 has been reported previously.17–19 It is considered as the thermodynamically most stable compound that forms by oxidizing PbTe under a low-pressure oxygen atmosphere at 623 K,20 and was identified as one of the possible oxidation products by cathodoluminescence, TOF-SIMS and Rutherford backscattering spectroscopy.21 Nevertheless, structural details of PbTeO4 are limited to unit cell parameters.22
16 and PbII5TeVIO8.16 PbTeO4 has been reported previously.17–19 It is considered as the thermodynamically most stable compound that forms by oxidizing PbTe under a low-pressure oxygen atmosphere at 623 K,20 and was identified as one of the possible oxidation products by cathodoluminescence, TOF-SIMS and Rutherford backscattering spectroscopy.21 Nevertheless, structural details of PbTeO4 are limited to unit cell parameters.22
Apart from the necessity to identify possible oxidation products of PbTe, compounds of divalent lead are in general interesting from a crystal-engineering point of view. The presence of the 6s2 free electron pair E located at the PbII atom is in the majority of cases stereochemically active23 and consequently promotes an asymmetrical coordination sphere. The resulting off-centred coordination polyhedra exhibit either holo- or hemidirected ligands24 and are considered as the driving force for the possible formation of crystal structures without an inversion center. The latter is a pre-condition for physical phenomena like piezoelectricity or non-linear optical properties. Moreover, materials with non-centrosymmetric and polar crystal structures are qualified to show pyroelectricity and/or ferroelectricity.25 Thus, new PbII compounds are possible candidates to comply with the required crystallographic criteria for such materials.
The two points mentioned above motivated us to study formation conditions and the crystal structure of PbTeO4, under special attention whether the synthesized material corresponds to PbIITeVIO4 or to PbIVTeIVO4, a point that remained open since the first but preliminary structural study of this material.22
Experimental
High-pressure/high-temperature synthesis
PbTeO4 was synthesized by high-pressure/high-temperature multianvil synthesis starting from a stoichiometric mixture of PbO2 (purity >95%, Honeywell Fluka) and TeO2 (purity >98%, TCI Deutschland GmbH). A platinum capsule containing the finely ground reaction mixture (approx. 65 mg per experiment) was placed in the 18/11-assembly crucible made of hexagonal boron nitride (HeBoSint® P100, Henze BNP GmbH, Kempten, Germany). The crucible was embedded in a MgO octahedron (18 mm MgO octahedra doped with 5% Cr2O3, Ceramic Substrates & Components Ltd, Newport Isle of Wight, United Kingdom) surrounded by eight tungsten carbide cubes (HM-type ha-7% Co, Hawedia, Marklkofen, Germany) and was placed inside the Walker-type module. After compression to the final pressure of 8.0 GPa (250 bar oil-pressure) with a ramp of 72 bar oil-pressure per hour, the sample was heated to 750 °C within 10 minutes. Subsequently, the corresponding temperature was kept constant for 15 min and then continuously lowered to 600 °C for 45 min in order to obtain a better crystal quality. As soon as the heating process was terminated by a quenching step, the decompression of the press took place with a ramp of 24 bar oil-pressure per hour. The recovered MgO octahedron was broken apart, and the sample was carefully separated from the surrounding crucible and capsule materials. PbTeO4 was gained as colorless to light yellow air-stable crystals. Further information about the multianvil technique and constructions of the various assemblies can be found in numerous references.26–28X-ray powder diffraction
X-ray powder diffractometry (XRPD) of PbTeO4 was carried out both at ambient temperature and temperature-dependent up to maximum temperatures of 950 °C on a STOE Stadi P powder diffractometer (STOE & Cie GmbH, Darmstadt, Germany) in transmission geometry using the WinXPOW software package.29 Ge(111) monochromatized Mo-Kα1 X-rays (λ = 0.7093 Å) were applied to the sample mounted between two thin acetate foils with vacuum grease; diffraction intensities were collected from a Mythen-2 1K microstrip detector with 1280 strips (Dectris AG, Baden-Daettwil, Switzerland). The data collection was performed in the 2Theta range of 2.0–70° with a step size of 0.015° and an exposure time of 25 s per step. Fig. 1 shows the Rietveld refinement plot performed with Diffracplus-Topas (Bruker AXS, Karlsruhe, Germany). As a starting model, the structure data from the single-crystal structure analysis reported here was used, and the peak shapes were modelled using modified Thompson-Cox-Hastings pseudo-Voigt profiles.30,31 Instrumental contributions on reflection profiles were corrected from the refinement of a LaB6 standard.32 The background was fitted with Chebychev polynomials up to the 8th order. Unit cell parameters comparable to those determined by single-crystal X-ray diffraction were obtained (see Table 1). For temperature-dependent measurements, the sample was filled in open 0.3 mm Mark capillaries and placed in a STOE high-temperature furnace. The furnace was heated with 50 °C min−1 from room temperature to 950 °C with steps of 50 °C (100–300 °C) and 25 °C (300–950 °C). After each temperature step, a pattern was recorded in the region 9–32° 2Theta.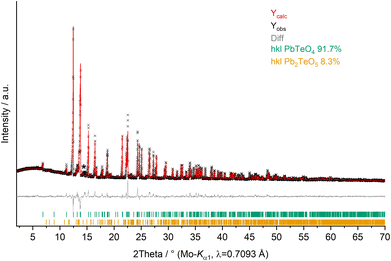 | ||
Fig. 1 XRPD pattern (Mo-Kα1 radiation) and Rietveld refinement of PbTeO4 (Rexp = 1.91%, Rwp = 3.68%, Rp = 2.46% and GoF = 1.92). Pb2TeO5![[thin space (1/6-em)]](https://www.rsc.org/images/entities/char_2009.gif) 16 was refined as side phase, and an asterisk marks an unassignable reflection. 16 was refined as side phase, and an asterisk marks an unassignable reflection. | ||
| Formula | PbTeO4 | μ/mm−1 | 61.861 |
| M r | 398.79 | X-ray density/g cm−3 | 8.328 |
| Temp./°C | 25 | θ min − θmax/° | 3.431–42.471 |
| Crystal dimension/mm3 | 0.03 × 0.02 × 0.005 | h | −10 to 10 |
| Crystal color | Light-yellow | k | −9 to 9 |
| Crystal form | Plate | l | −22 to 22 |
| Space group, No. | I2/a, 15 | Measured reflections | 10![[thin space (1/6-em)]](https://www.rsc.org/images/entities/char_2009.gif) 641 641 |
| Formula units Z | 4 | Independent reflections | 1243 |
| Powder data | |||
| a/Å | 5.41173(10) | ||
| b/Å | 4.94608(9) | Observed reflections (I > 2σ(I)) | 1073 |
| c/Å | 12.0324(2) | R int | 0.0556 |
| β/° | 99.5935(12) | T min; Tmax | 0.4690; 0.7483 |
| V/Å3 | 317.565(10) | No. of parameters | 31 |
| Single-crystal data | R 1 (F2 > 2σ(F2)) | 0.0259 | |
| a/Å | 5.4142(4) | wR2 (F2 all) | 0.0484 |
| b/Å | 4.9471(4) | GOF | 1.051 |
| c/Å | 12.0437(11) | Δρmax/min/e Å−3 | 1.62/−2.43 |
| β/° | 99.603(3) | CSD deposition number | 2380686 |
| V/Å3 | 318.07(5) |
Single-crystal X-ray diffraction
For the single-crystal X-ray diffraction study, crystals were optically pre-selected under a polarizing microscope and positioned at the tip of Kapton micro mounts with the help of perfluorinated oil. The diffraction data were recorded at room temperature with graphite-monochromatized Mo-Kα radiation using a Bruker KAPPA APEX II diffractometer (Bruker AXS, Wisconsin, Madison, USA) equipped with a CCD detector. Optimization of the measurement strategy and integration were done with the diffractometer software,33 absorption correction with the semi-empirical method of SADABS,34 structure solution with SHELXT35 and structure refinement with SHELXL.36 The setting I2/a (cell choice 3) of space group No. 15 (standard setting C2/c; cell choice 1)‡ was chosen to emphasize the relation of the unit cell determined by Sleight et al. (a = 5.4129, b = 4.9471, c = 6.0185 Å, β = 99.596° with assumed space groups C2, Cm or C2/m)22 with the unit cell determined from the material synthesized in our study, where c is doubled.Details of structure and refinement data are gathered in Table 1. Further details of the crystal structure investigation may be obtained from the joint CCDC/FIZ Karlsruhe online deposition service: https://www.ccdc.cam.ac.uk/structures/ by quoting the deposition number specified at the end of Table 1.
Bond valence sums (BVS)37 were calculated using the bond valence parameters provided by Krivovichev & Brown for the PbII–O pair38 and by Mills & Christy for the TeVI–O pair39 under consideration of all oxygen atoms within a distance of 3.55 Å. Results of the BVS calculation are compiled in Table 2 together with selected bond lengths.
| Symmetry codes: (i) −x + 1, y + 1/2, −z + 1/2; (ii) x + 1/2, y + 1/2, z + 1/2; (iii) −x + 3/2, −y + 1/2, −z + 1/2; (iv) x, −y + 1/2, z + 1/2; (v) −x + 1, −y, −z; (vi) x + 1/2, −y, z + 1; (vii) −x + 3/2, y, −z; (viii) x, y, z + 1; (ix) x + 1/2, y − 1/2, z + 1/2; (x) −x + 1, y − 1/2, −z + 1/2; (xiii) −x + 1/2, −y + 1/2, −z + 1/2; (xiv) x − 1/2, −y, z + 1. | |||||
|---|---|---|---|---|---|
| Pb1–O1i | 2.330(3) | Pb1–O1 | 3.388(3)ix | BVS | |
| Pb1–O1ii | 2.330(3) | Pb1–O1 | 3.388(3)x | Pb1 (CN 10) | 2.26 |
| Pb1–O1iii | 2.476(3) | Pb1–E | 0.583 | Te1 (CN 6) | 5.89 |
| Pb1–O1iv | 2.476(3) | Te1–O1 | 1.867(3)xiii | O1 (CN 4; 1 Te, 3 Pb) | 1.98 |
| Pb1–O2v | 2.956(3) | Te1–O1 | 1.867(3)viii | O2 (CN 4; 2 Te, 2 Pb) | 2.09 |
| Pb1–O2vi | 2.956(3) | Te1–O2 | 1.966(2)xiv | ||
| Pb1–O2vii | 3.004(3) | Te1–O2 | 1.966(2)i | ||
| Pb1–O2viii | 3.004(3) | Te1–O2 | 1.968(3)xiii | ||
| Te1–O2 | 1.968(3)viii | ||||
Isotypic structures were quantitatively compared using the compstru software40 available at the Bilbao crystallographic server.41
The position of the 6s2 electron lone pair of the PbII atom was calculated with the LPLoc software;42 its coordinates are given in the discussion of the crystal structure.
Energy dispersive X-ray spectroscopy (EDX)
Several crystals of PbTeO4 were subjected to semiquantitative EDX measurements using a field emission scanning electron microscope (Clara Ultra High Resolution, TESCAN GmbH, Dortmund, Germany) with an energy-dispersive Ultim Max (65 mm2) X-ray detector-system (OXFORD Instruments NanoAnalysis, Wiesbaden, Germany) for elemental identification. The crystals were placed on a carbon plate on an aluminum holder and sputtered with carbon. Imaging and EDX measurements were performed in analysis mode at an acceleration voltage of 20 keV and a beam current of 3 nA at a working distance of 9 mm. Regarding the Pb/Te/O ratio, the values from ten measurement points were arithmetically averaged. The ESI† provides electron micrographs of the crystals with the positions of the measurement spots indicated as well as selected EDX spectra and determined compositions (Fig. S1, S2 and Table S1‡).Thermal analysis
Simultaneous thermal analysis (STA) measurements (thermogravimetry/differential scanning calorimetry; TG/DSC) were conducted on a Netzsch STA 449F3 instrument (Netzsch GmbH, Selb, Germany) with a ∼15 mg sample in the temperature range 25 ⇌ 725 °C (corundum crucibles, flowing argon atmosphere (3 ml min−1), heating/cooling rate 20 °C min−1). A base line correction of the TG curve was carried out by measuring the empty crucible and subtracting the data from the measurement data.UV/Vis spectroscopy
A diffuse reflectance spectrum of powdered PbTeO4 was recorded in the range of 200 to 2550 nm, using an Agilent Cary 5000 UV-Vis spectrometer equipped with an integrating sphere (DRA-2500), a D65 as standard illuminant and a 10° complementary observer. A scan rate of 600 nm min−1 and a data interval of 1 nm were applied and BaSO4 was used as white standard. The Kubelka–Munk (K–M) function was used to calculate the optical absorbance from the generated reflectance data, and the band gap was determined using Tauc-plots.43,44IR spectroscopy
Infrared spectra from powdered samples of PbTeO4 were collected in the spectral range of 400–1500 cm−1 using a Bruker Alpha Platinum FTIR-ATR spectrometer (Bruker, Billerica, USA) equipped with a 2 × 2 mm diamond ATR-crystal. A DTGS detector collected the intensity during 24 scans, and atmospheric influences were corrected via a reference measurement using the Opus software.45Raman spectroscopy
Raman spectra of PbTeO4 were recorded in the spectral range 0–1000 cm−1 (spectral resolution 1 cm−1) on a WITec 300 RAS system (WITec, Ulm, Germany) coupled with a Peltier-cooled CCD camera using the 532 nm green laser line with 0.59 mW power. For the final spectrum, 60 scans were accumulated in order to get a better signal-to-noise ratio.Quantum chemical calculations
The Crystal23 program package46,47 was used for the theoretical investigation of PbTeO4 utilizing the HSEsol hybrid functional for solids48 in combination with the Pb_pob_TZVP_rev2 basis set for lead,49 the Te_m-pVDZ-PP_Heyd_2005 basis set for tellurium50 and the O_8-411d11f_mahmoud_2013 basis set for oxygen.51 The Monkhorst–Pack integration scheme52 with a shrinking factor of the reciprocal lattice vectors of 18 was employed to ensure the correct treatment of the compact irreducible part of the Brillouin Zone (BZ). The self-consistent field (SCF) convergence criterion was set to 10−8 Hartree and 4.5 × 10⁻⁴ Hartree per Bohr for the energy and forces, respectively. The theoretically calculated crystal structure was compared with experimental data by computing X-ray powder diffraction patterns with the RIETAN-FP53 module as implemented in the program VESTA.54 A Mulliken population analysis was performed to access the partial charges of the investigated lead tellurate. The electronic band structure and the associated density of states (DOS) have been calculated at the optimized geometry in the standard C2/c setting of space group No. 15. To visualize the local electron pair distributions in the crystal structure, the electron localization function (ELF) has been calculated using the program Multiwfn55 and visualized using the free program package Visual Molecular Dynamics (VMD).56 To determine the intensities fully analytically, harmonic infrared (IR) and Raman vibrational spectra were computed through the coupled-perturbed Hartree–Fock/Kohn–Sham approach57–59 within Crystal23, providing a detailed analysis of associated normal modes in the crystal environment.60 For improved comparison, a weighted Gaussian kernel density estimation was applied to the IR bands obtained from the calculation.Results and discussion
Preparation
The formation of “lead tellurate” (=PbTeO4) has first been described by Mathers and Graham. For the synthesis, they used a thoroughly ground mixture of TeIVO2 and PbIVO2 (stoichiometric ratio of 1![[thin space (1/6-em)]](https://www.rsc.org/images/entities/char_2009.gif) :
:![[thin space (1/6-em)]](https://www.rsc.org/images/entities/char_2009.gif) 1.1) heated for about two hours at 170 °C, leading to a conversion rate of TeIVO2 into the tellurate of 99.8%.17 However, the yield of the material supposedly produced in this way was not determined directly, but via telluric acid obtained by reacting the as-synthesized product with sulfuric acid in an aqueous medium and subsequent crystallization. During the present study, we have reproduced the experimental procedure (heating a 1
1.1) heated for about two hours at 170 °C, leading to a conversion rate of TeIVO2 into the tellurate of 99.8%.17 However, the yield of the material supposedly produced in this way was not determined directly, but via telluric acid obtained by reacting the as-synthesized product with sulfuric acid in an aqueous medium and subsequent crystallization. During the present study, we have reproduced the experimental procedure (heating a 1![[thin space (1/6-em)]](https://www.rsc.org/images/entities/char_2009.gif) :
:![[thin space (1/6-em)]](https://www.rsc.org/images/entities/char_2009.gif) 1.1 mixture of TeIVO2 and PbIVO2 at 170 °C for two hours) and examined the resulting solid material by XRPD. All reflections could be assigned solely to the two starting materials TeIVO2 and PbIVO2, which means that a direct reaction according to eqn (1) does not take place under these conditions.
1.1 mixture of TeIVO2 and PbIVO2 at 170 °C for two hours) and examined the resulting solid material by XRPD. All reflections could be assigned solely to the two starting materials TeIVO2 and PbIVO2, which means that a direct reaction according to eqn (1) does not take place under these conditions.| PbO2 (s) + TeO2 (s) → PbTeO4 (s) | (1) |
The apparently observed oxidation of TeO2 by PbO2 as the oxidizing agent to yield telluric acid, however, can be achieved in a highly acidic aqueous medium.
A phase of composition PbTeO4 obtained under ambient pressure conditions was mentioned by Young.5 This phase is said to have been formed when 1![[thin space (1/6-em)]](https://www.rsc.org/images/entities/char_2009.gif) :
:![[thin space (1/6-em)]](https://www.rsc.org/images/entities/char_2009.gif) 1 mixtures of PbO and TeO2 were heated to 530 °C in an argon atmosphere. Apart from the reference to an earlier work18 and specifications of interplanar spacings, there was no further crystallographic information given on this phase.5
1 mixtures of PbO and TeO2 were heated to 530 °C in an argon atmosphere. Apart from the reference to an earlier work18 and specifications of interplanar spacings, there was no further crystallographic information given on this phase.5
It was also claimed by Gaitán et al. to have obtained a phase of composition PbTeO4 under ambient pressure conditions.19 This report is somewhat confusing, as its title mentions an orthorhombic PbTeO4 phase, whereas the discussion refers to a tetragonal PbTeO4 phase. In any case, the indication of the corresponding d values of the observed reflections and the given unit cell parameters (a = 5.132, c = 12.862 Å) suggest that the described phase in fact is tetragonal PbTeO3, the composition and crystal structure of which had been determined previously (a = 5.304, c = 11.900 Å).9
The only reliable data on the preparation of PbTeO4 come from Sleight et al.22 who used a 1![[thin space (1/6-em)]](https://www.rsc.org/images/entities/char_2009.gif) :
:![[thin space (1/6-em)]](https://www.rsc.org/images/entities/char_2009.gif) 1 mixture of PbO2 and TeO2 treated at a pressure of 3000 atm and a temperature of 700 °C. In our study, we likewise used high-pressure conditions for the successful preparation of PbTeO4.
1 mixture of PbO2 and TeO2 treated at a pressure of 3000 atm and a temperature of 700 °C. In our study, we likewise used high-pressure conditions for the successful preparation of PbTeO4.
Based on the partly contradictory information regarding the preparation of crystalline PbTeO4 given so far, it can be concluded that this phase most probably can only be obtained under high-pressure conditions.
Composition, crystal structure and thermal behavior
The elemental composition was confirmed by EDX as PbTeO4 with a determined Pb/Te/O ratio of 16 ± 2 at%, 15 ± 2 at%, and 69 ± 3 at%, being close to the theoretical values of 16.67 at%, 16.67 at%, and 66.67 at% (Pb/Te/O). No other additional elements could be detected.Whether the doubling of the unit cell relative to the previous study of PbTeO4![[thin space (1/6-em)]](https://www.rsc.org/images/entities/char_2009.gif) 22 results from the different preparation conditions (700 °C and 3000 atm for 8 hours versus 750 °C and 8 GPa), or from superstructure reflections unrecognized in the original study, cannot be evidenced. XRPD analysis and Rietveld refinements on PbTeO4 clearly revealed superstructure reflections in the low-angle area (see Fig. 1) leading to a doubling of the c axis. In addition, the sample composition was refined to a purity of 92%wt, and a minor side-phase of Pb2TeO5
22 results from the different preparation conditions (700 °C and 3000 atm for 8 hours versus 750 °C and 8 GPa), or from superstructure reflections unrecognized in the original study, cannot be evidenced. XRPD analysis and Rietveld refinements on PbTeO4 clearly revealed superstructure reflections in the low-angle area (see Fig. 1) leading to a doubling of the c axis. In addition, the sample composition was refined to a purity of 92%wt, and a minor side-phase of Pb2TeO5![[thin space (1/6-em)]](https://www.rsc.org/images/entities/char_2009.gif) 16 was identified. A single reflection of a yet unknown phase has been marked with an asterisk in Fig. 1.
16 was identified. A single reflection of a yet unknown phase has been marked with an asterisk in Fig. 1.
PbTeO4 belongs to the family of metatellurates(VI) with general formula MIITeVIO4, for which only a few other representatives are known, viz. the first-row transition compounds CuTeO4,61 dirutile-type CoTeO4![[thin space (1/6-em)]](https://www.rsc.org/images/entities/char_2009.gif) 62 and NiTeO4,63 as well as the alkaline earth compounds CaTeO4,64 SrTeO4
62 and NiTeO4,63 as well as the alkaline earth compounds CaTeO4,64 SrTeO4![[thin space (1/6-em)]](https://www.rsc.org/images/entities/char_2009.gif) 64,65 and BaTeO4.66 Although the ionic radius of 1.4 Å for PbII with CN = 1067 is comparable with that of 1.36 and 1.52 Å for SrII and BaII, respectively, PbTeO4 adopts neither the SrTeO4 nor the BaTeO4 structure.
64,65 and BaTeO4.66 Although the ionic radius of 1.4 Å for PbII with CN = 1067 is comparable with that of 1.36 and 1.52 Å for SrII and BaII, respectively, PbTeO4 adopts neither the SrTeO4 nor the BaTeO4 structure.
The crystal structure of PbTeO4 comprises four atoms in the asymmetric unit, viz. Pb1 on a site with site symmetry 2 (multiplicity 4, Wyckoff letter e), Te1 with site symmetry ![[1 with combining macron]](https://www.rsc.org/images/entities/char_0031_0304.gif) (4 d), and two O atoms (O1, O2), each on a general position (8 f) of space group I2/a.
(4 d), and two O atoms (O1, O2), each on a general position (8 f) of space group I2/a.
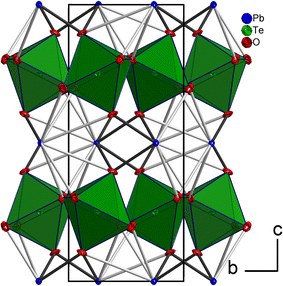
The tellurium atom has an oxidation state of +VI and shows the characteristic coordination number of six within a slightly distorted octahedral coordination environment by oxygen atoms.68 The mean TeVI–O bond length of 1.934 Å is in good agreement with literature data of 1.923(30) Å.69 In the crystal structure, [TeO6] octahedra share corners to build 2∝[TeO4/2O2/1] layers extending parallel to (001) (Fig. 2 and 3). The PbII cations are located between adjacent 2∝[TeO4/2O2/1] layers with short Pb–O bonds to the terminal O atoms and with long bonds to the bridging O atoms of the 2∝[TeO4/2O2/1] layer.
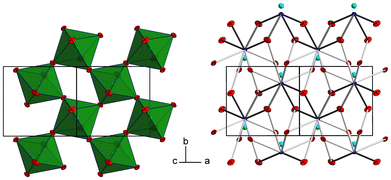 | ||
| Fig. 3 2 ∝[TeO4/2O2/1] layers and the intermediate PbII atoms with the coordinating oxygen atoms. Colors and displacement ellipsoids are as in Fig. 2. | ||
For the definition of the first coordination sphere around the PbII cation in the crystal structure of PbTeO4, a threshold of 3.55 Å for the Pb–O bond length was used12 that is based on the sum of the van der Waals radii of Pb and O (2.02 and 1.52 Å, respectively).70 Owing to the broad Pb–O bond lengths distribution between 2.3 and 3.4 Å (Table 2), a partition into “short” Pb–O bonds less than 2.7 Å and “long” Pb–O bonds greater than this boundary up to 3.5 Å is reasonable. Consequently, the PbII cation in PbTeO4 shows two pairs of short and three pairs of long Pb–O bonds, resulting in a hemidirected arrangement24 of the ten O2− ligand atoms. The mean Pb–O bond length for the [PbO10] polyhedron is 2.821 Å, a value that conforms with literature data (2.789(212) Å) for PbII with a coordination number of 10.69
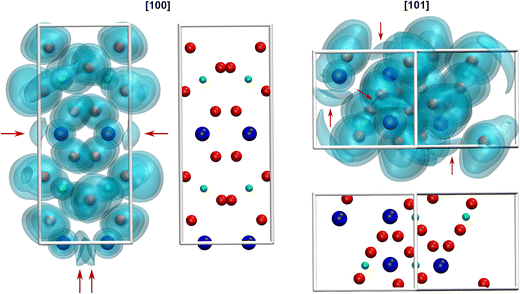
Due to the space requirement of the electron lone pair E (fractional coordinates in the unit cell: x = 0.75, y = 0.12336, z = 0.5 assuming a radius of 1.30 Å for E), it is directed towards the part of the ligand sphere with the long Pb–O bonds (Fig. 2, right), with a calculated Pb–E distance of 0.58 Å as obtained from the LPLoc software.42 The orientation of the PbII lone pair E was also confirmed and visualized by the computed ELF within the PbTeO4 unit cell. The ELF viewed along the [100] and the [101] directions is shown in Fig. 4 for isosurface values of 0.45, 0.6 and 0.75. The spatial extension of the electron lone pairs at the PbII atoms are indicated via red arrows. In accordance with chemical intuition and the data given above, the lone pair is oriented towards the volume of the coordination sphere where the oxygen atoms are found at longer distances.
PbTeO4 crystallizes isotypically with structures where the stereoactivity of the lone-pair electrons is prevalent, or which have a peculiar crystal chemistry: BiIIIBiVO4 (=Bi2O4),71 BiIIISbVO4,72 HgIIMoVIO4,73 HgIIWVIO4,74 β-SbIIISbVO4 (=β-Sb2O4)75 and LiAuF4.76 It is noted that in literature there is no clear classification with respect to the designation of the corresponding structure type. Hence, BiIIISbVO4, β-Sb2O4 or HgIIMoVIO4 are synonymously used as such.
The similarity parameters of PbTeO4 and its isotypic crystal structures, as determined with the compstru program,40 are listed in Table 3. On the one hand, the greatest similarity in terms of S and Δ is ascribed to Bi2O4, BiSbO4 and β-Sb2O4. Common to all of these four crystal structures is the presence of large cations with a stereochemically active lone-pair electron E (PbII, SbIII, BiIII) at the same site, accompanied with cations having the formal electronic configuration of a noble gas (TeVI, SbV, BiV) at the other metal site. On the other hand, the lowest similarities in terms of S and Δ pertain to HgMoO4, HgWO4, and LiAuF4. In case of HgMoO4 and HgWO4, the larger differences can be ascribed to the peculiar crystal chemistry of HgII with its clear preference for a linear [2 + x] coordination,77 which results in high displacements of the anions relative to TeVI that prefers a more or less undistorted octahedral coordination sphere.68 In case of the only fluoride compound in this isotypic series, the high displacements are caused by the different ionic radii of LiI and PbII and the peculiar crystal chemistry of AuIII with a preference for a square-planar coordination.78
| PbTeO4 | Bi2O4 | BiSbO4 | β-Sb2O4 | HgMoO4 | HgWO4 | LiAuF4 | Site symmetry |
|---|---|---|---|---|---|---|---|
| a Prior to the comparison, all structures were standardized with the program STRUCTURE-TIDY.79 | |||||||
| |u| Pb1/atom | Bi2 0.1316 | Bi1 0.1044 | Sb2 0.2232 | Mo1 0.3493 | W1 0.3498 | Li1 1.1942 | 2 |
| |u| Te1/atom | Bi1 0 | Sb1 0 | Sb1 0 | Hg1 0 | Hg1 0 | Au1 0 | ![[1 with combining macron]](https://www.rsc.org/images/entities/char_0031_0304.gif) |
| |u| O1/atom | O2 0.2993 | O1 0.2402 | O2 0.2467 | O1 0.5408 | O1 0.5258 | F1 0.6237 | 1 |
| |u| O2/atom | O1 0.2358 | O2 0.1272 | O1 0.0799 | O2 1.3575 | O2 1.3205 | F2 1.1144 | 1 |
| S | 0.0155 | 0.0108 | 0.0124 | 0.0813 | 0.0824 | 0.0813 | |
| d av./Å | 0.2003 | 0.1399 | 0.1461 | 0.6910 | 0.6737 | 0.7784 | |
| Δ | 0.108 | 0.078 | 0.054 | 0.641 | 0.598 | 0.546 | |
Calculated BVS values (Table 2) support the formation of PbIITeVIO4 and are in expected ranges for divalent lead and hexavalent tellurium. With respect to the results of the BVS calculation, the global instability index GII80,81 can be used as a measure of the crystal structure strain. Hence, the GII index is an indicator of the stability and validity of a crystal structure, although its information value is not absolute but can be used as a computationally inexpensive bond valence-based metric for assigning general trends.82 If the GII index is smaller than 0.1 v.u., it is generally accepted that a well-balanced and stable structure is present; for strained structures a GII index between 0.1 and 0.2 v.u. is obtained, whereas a crystal structure with a GII index greater than 0.2 v.u. is considered as unstable. For the present case of PbTeO4, GII was computed as 0.148, revealing that the crystal structure is strained and stable. It might be speculated that the comparatively high value of GII for PbTeO4 is due to the fact that this phase only forms under high pressure. This assumption is also supported by the results of temperature-dependent PXRD measurements given in Fig. 5, which revealed that PbTeO4 shows no temperature-induced structural phase transition from a metastable high-pressure modification to a possible thermodynamically stable ambient pressure modification from room-temperature up to the end of its stability range at ∼630 °C. The non-occurrence of this transformation can also be interpreted as an indication that PbTeO4 cannot be produced under ambient pressure conditions and that the pressure parameter is essential for the synthesis of the lead tellurate with composition PbTeO4.
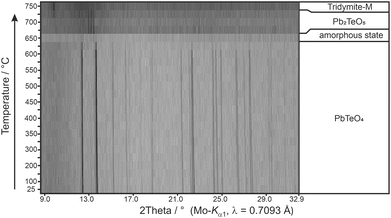 | ||
| Fig. 5 Temperature-dependent XRPD pattern of PbTeO4 with assigned phases and their stability ranges. | ||
The decomposition temperature is corroborated by complementary STA measurements (Fig. 6), which indicate the beginning of the decomposition with an onset of 625 °C. The subsequent mass loss is ≈3.5% until the end of the measurement at 725 °C and can be related to the release of oxygen according to eqn (2), which is accompanied by two endothermal effects (onset 628 °C, peak maximum 667 °C; onset 690 °C, peak maximum 706 °C). Re-cooling the sample from 725 °C to room temperature showed a sharp exothermic effect (onset 455 °C, peak maximum 452 °C), which is caused by recrystallization to the tetragonal β-modification of PbTeO3,12 as shown by subsequent XRPD measurements of the remaining sample at room temperature (Fig. S3 in the ESI†).
 | (2) |
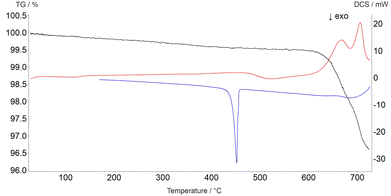 | ||
| Fig. 6 Thermal analysis curves of PbTeO4 (TG curve black, DSC curve on heating red, DSC curve on cooling blue). | ||
Heating the sample above 625 °C under the conditions of the high-temperature camera leads to complete amorphization at 650 °C (Fig. 5). As the temperature increases further, a significantly raised background is present and weak reflections of Pb2TeO5![[thin space (1/6-em)]](https://www.rsc.org/images/entities/char_2009.gif) 16 appear in the temperature range from 675 to 725 °C. This phase was already observed in the synthesis of PbTeO4 with a proportion of approx. 8%wt (see Fig. 1) and appears to form again from the amorphous sample material at high temperatures. The corresponding reaction equation is given in eqn (3).
16 appear in the temperature range from 675 to 725 °C. This phase was already observed in the synthesis of PbTeO4 with a proportion of approx. 8%wt (see Fig. 1) and appears to form again from the amorphous sample material at high temperatures. The corresponding reaction equation is given in eqn (3).
 | (3) |
The formation of Pb2TeO5 at temperatures >675 °C as determined by temperature-dependent PXRD is not represented by the complementary STA measurement, which we attribute to the different heating rates and atmospheres used in the two measurement procedures (slow heating and holding times, atmospheric conditions for PXRD versus fast heating times, Ar atmosphere for STA).
Above 675 °C, TeO2 suggested as another decomposition product, shows no reflections, because it either forms as an amorphous phase or is already molten (melting point 733 °C).83 At even higher temperatures (>725 °C), only reflections of tridymite are visible, which indicates a reaction with the mark capillary and ultimately led to the breakage of the latter.
The evolution of unit cell parameters of PbTeO4 with temperature is depicted in Fig. 7a in form of regression lines and shows a linear increase of the unit-cell volume from room temperature up to the end of its stability region. All unit cell axes linearly increase as well with temperature, and only the monoclinic angle decreases slightly.
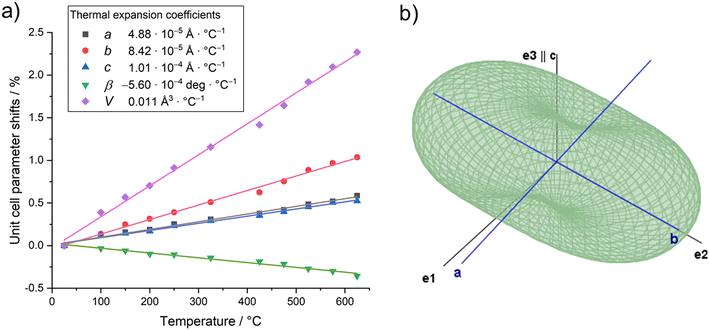 | ||
| Fig. 7 (a) Evolution of unit cell parameters with temperature; (b) three-dimensional surface of the thermal expansion tensor for PbTeO4 (300 °C data). | ||
Based on the formalism for the infinitesimal temperature limit introduced by Paufler and Weber,84 the TEV software85 was used to calculate the components of the thermal expansion tensor αij. For the definition of the second rank tensor within the TEV program, the following orthogonalized coordinate system was used: e3 is parallel to c, e2 is parallel to b* and e1 = e2 × e3. The resulting symmetrical tensor has six independent components (α11, α22, α33, α12, α13, α23); the symmetry constraints of the monoclinic crystal system with unique axis b result in the components α12 and α23 being zero. After transformation to principal axes, the tensor can be simplified and is described by only three independent components (α1, α2, α3). Whereas each individual expansion coefficient shows only subtle changes with temperature, the expansion coefficient α2 has about twice the absolute value of the smallest eigenvalue α1, making the thermal expansion in PbTeO4 anisotropic. The dependence of eigenvalues of the thermal expansion are compiled in Fig. S4 in the ESI.† The representation of the tensor and its anisotropy in form of a surface in three-dimensional space is shown in Fig. 7b. It can be seen that the strongest expansion is along the b axis that exactly coincides with eigenvalue α2 and the corresponding eigenvector. The lowest expansion is perpendicular to this direction.
UV-Vis spectroscopy
The UV range usually extends over the wavelength range from 380–100 nm. From around 200 nm and below, the absorption by oxygen becomes so strong that the measuring range for standard laboratory devices usually ends here. In Fig. 8 the reflectance UV-Vis spectrum of PbTeO4 in the range from 200–2550 nm is depicted. As can be seen, PbTeO4 shows a transmittance for UV light down to the lowest experimentally accessible wavelength of 200 nm. This suggests that the transmittance is also given at wavelengths shorter than 200 nm. In the range below 500 nm, there is a clear drop in reflectance and an increase in absorption. This drop also agrees very well with the calculated band gap of 2.9 eV or 427 nm. However, as the measurement clearly shows, there is no complete absorption in the UV range, so that PbTeO4 continues to transmit UV light. The exact mechanisms are still unclear and need to be investigated further. Highly UV-permeable materials are extremely important for technical applications such as UV/deep-UV lasers or the treatment of ultra-pure water.86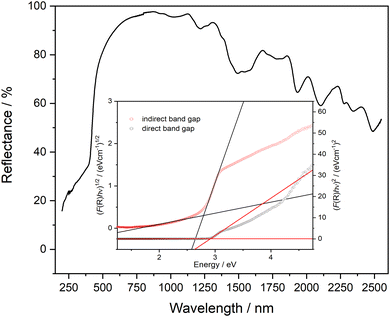 | ||
| Fig. 8 UV-Vis reflectance spectrum of PbTeO4. As insertion, Tauc plots to estimate the direct (2.9 eV) and indirect (2.8 eV) bandgap are given. | ||
Additionally, the optical band gap was determined from the diffuse reflectance UV-Vis spectra via the Kubelka–Munk (K–M) function44 and Tauc plots.43 The K–M function (F(R)) is calculated according to F(R)K–M = K/S = (1 − R)2/2R, in which R is the reflectance, S the scattering coefficient and K the absorption coefficient. To generate the Tauc plots, the factor (F(R)·hν)n was plotted against photon energy. For direct and indirect band gaps, n was set to 0.5 and 2, respectively. By the tangent methods as shown in Fig. 8 (inset), the bandgap values Eg were determined to Eg(direct) = 2.9 eV and Eg(indirect) = 2.8 eV. Compared with the bandgap determined on basis of quantum chemical calculation (see next section) the values are almost identical.
Quantum chemical calculations
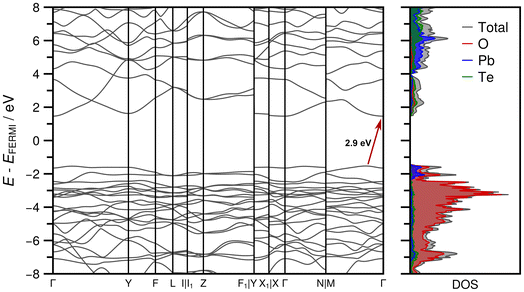
The optimized crystal structure exhibits excellent agreement with the experimentally determined crystal structure in terms of unit cell parameters (Table S2 in the ESI†). The observed deviations are less than 1%, which can be attributed to the inherent thermal expansion of PbTeO4, while the energy minimization corresponds in a strict sense to a 0 K treatment. Optimized atom positions are given in Table S3 in the ESI.† The comparison of the XRPD pattern calculated from the experimentally determined structure and the optimized one also demonstrates excellent agreement as depicted in Fig. S5 in the ESI.† The partial charges (in units of the elementary charge e) of the irreducible atoms obtained from the Mulliken population analysis exhibit values of +1.432 e for Pb1, +2.876 e for Te1, −1.096 e for O1 and −1.058 e for O2.Fig. 9 shows the band structure and the associated DOS obtained at HSEsol level. The band path through the BZ was chosen according to the convention proposed by Setyawan and Curtarolo87 for the standard C2/c setting. From the DOS it is evident that the bands in the valence region between −8 and −2 eV are almost exclusively formed from Pb and O orbital contributions, while only a sparse occupation is identified for Te. In the −2 eV region-bands resulting from Pb and O densities dominate and characterize the lower bound of the band gap region. The first conduction bands are more or less equally derived from unoccupied Pb, Te, and O states. The indirect band gap of 2.9 eV indicates that PbTeO4 is a wide band gap semiconductor, analogous to the first row metatellurate(VI) CoTeO4.62
The calculated IR and Raman vibrational spectra on basis of the energy minimized crystal structure are depicted in Fig. 10 and show good agreement with the recorded spectra. A full set of calculated vibrational modes is compiled in the ESI, Table S3.† In the IR spectrum, two areas of overlapping strong bands are clearly distinguishable. The first region is located between 400 and 500 cm−1, where the ν5 vibrations of the [TeO6] octahedra and lattice vibrations are typically located. The second region between 500 and 800 cm−1 typically covers the ν2–4 vibrations, which are not clearly resolved. The total symmetric ν1 mode is of low intensity and not observed in the IR spectrum but very prominent in the Raman spectrum at ∼740 cm−1. In general, the Raman spectrum of PbTeO4 between 400 and 800 cm−1 is similar to that of CoTeO4,88 which is not surprising since the octahedral [TeO6] units are arranged in the same type of 2∝[TeO4/2O2/1] layers in both crystal structures. The ν1 mode in CoTeO4 likewise shows the strongest intensity but is redshifted to 705 cm−1. Values of 710 and 763 cm−1 were reported for the corresponding bands in the Raman spectrum of the rare mineral xocomecatlite.89 Although no crystal structure determination has yet been carried out for this mineral so far, the chemical composition of Cu3(TeVIO4)(OH)4 suggests the existence of similarly structured metatellurate TeO42− anions.
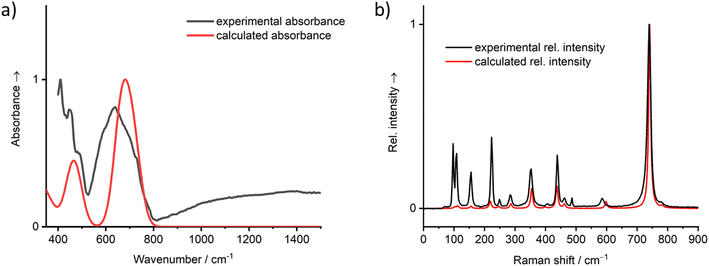 | ||
| Fig. 10 Vibrational spectra (a) IR, (b) Raman of PbTeO4 calculated on basis of the coupled-perturbed Hartree–Fock/Kohn–Sham approach in comparison with the measured spectra. | ||
Conclusion
Lead telluride and the importance of knowing about possible surface oxidation layers are of great importance, as described in the introduction. In this context, we were able to determine and analyze the crystal structure of PbTeO4 from single-crystal X-ray diffractometer data for the first time. From these data it was possible to clearly assign the oxidation states as PbII and TeVI. Previously, the only reliable data on the preparation of PbTeO4 came from the study of Sleight et al.,22 who produced the material at a pressure of 3000 atm. In our study, we used multianvil high-pressure conditions for the successful preparation of well-crystallized PbTeO4. Additional evaluation of the global instability index GII and temperature-dependent powder X-ray analysis confirmed the assumption that the parameter pressure is required for the formation of crystalline PbTeO4. The compound is a UV transparent material down to a wavelength of 200 nm and below, as indicated by UV-Vis measurements. From Tauc plots, the experimental band gap was determined to be Eg(direct) = 2.9 eV and Eg(indirect) = 2.8 eV. The property measurements were supplemented by quantum chemical calculations at DFT level. As suggested by previous studies90–93 and supported by the optimized unit cell parameters as well as the calculated powder diffraction patterns, the range-separated hybrid functional HSEsol exhibits exceptional performance in the treatment of solid-state oxide systems and enables the characterization of the Mulliken partial charges, the electronic band structure, the density of states as well as the vibrational properties of PbTeO4. The centrosymmetric crystal structure of PbTeO4 precludes an application regarding SHG, piezo-, pyro- or ferroelectric properties.Data availability
Crystallographic data for PbTeO4 has been deposited at the joint CCDC/FIZ Karlsruhe online deposition service: https://www.ccdc.cam.ac.uk/structures/ and can be obtained by quoting the deposition number 2380686.‡Author contributions
Matthias Weil: conceptualization, formal analysis, investigation, visualization, and writing – original draft. Gunter Heymann: conceptualization, formal analysis, investigation, funding acquisition, supervision, visualization, and writing. Thomas S. Hofer: formal analysis, investigation, supervision, visualization, and writing. Michael Hladik, Felix R. S. Purtscher, Armin Penz: formal analysis, investigation, visualization, and writing.Conflicts of interest
There are no conflicts to declare.Acknowledgements
The X-ray Center of TU Wien is acknowledged for providing free access to the X-ray diffraction instruments. We thank Stefan Schwarzmüller for collecting the EDX data, Markus Rödl and Heidi A. Schwartz for measuring the UV-Vis spectrum and preparing the DSC/TG graph, Benjamin Pullicino for STA measurements, and Hinrich Grothe for recording the Raman spectrum. Further, we acknowledge Hubert Huppertz for continuous support and usage of all the facilities of the Institute of General, Inorganic and Theoretical Chemistry, Universität Innsbruck. The Austrian Science Fund (FWF) is thanked for its financial support in the scope of the project P 35602-NBL.References
- M. G. Kanatzidis, Chem. Mater., 2010, 22, 648–659 CrossRef CAS.
- A. D. LaLonde, Y. Pei, H. Wang and G. J. Snyder, Mater. Today, 2011, 14, 526–532 CrossRef CAS.
- G. Liu, C. Yan, Z.-J. Xue, C. Liu, G. Xu and T. Wang, Nanoscale, 2018, 10, 12284–12290 RSC.
- O. I. Tananaeva, Z. K. Latypova and A. V. Novoselova, Izv. Akad. Nauk SSSR, Neorg. Mater., 1977, 13, 386–387 CAS.
- I. M. Young, J. Mater. Sci., 1979, 14, 1579–1585 CrossRef CAS.
- D. Stavrakieva, Y. Ivanova and J. Pyrov, J. Mater. Sci., 1988, 23, 1871–1876 CrossRef CAS.
- N. Berchenko, S. Fadeev, V. Savchyn, K. Kurbanov, M. Trzyna and J. Cebulski, Thermochim. Acta, 2014, 579, 64–69 CrossRef CAS.
- L. I. Kosse, E. D. Politova, A. A. Bush, A. V. Astaf'ev, S. Y. Stefanovich, E. A. Myzgin and Y. N. Venevtsev, Kristallografiya, 1983, 28, 510–513 CAS.
- P. Sciau, J. Lapasset and J. Moret, Acta Crystallogr., Sect. C: Cryst. Struct. Commun., 1986, 42, 1688–1690 CrossRef.
- K. Mariolacos, Anz. Akad. Wiss. Wien, Math.-Naturwiss. Kl., 1969, 106, 129–130 Search PubMed.
- V. E. Zavodnik, S. A. Ivanov and A. I. Stash, Acta Crystallogr., Sect. E: Struct. Rep. Online, 2008, 64, i16 CrossRef CAS PubMed.
- M. Weil, M. Shirkhanlou, E. Füglein and E. Libowitzky, Crystals, 2018, 8, 51 CrossRef.
- A. Oufkir, M. Dutreilh, P. Thomas, J. C. Champarnaud-Mesjard, P. Marchet and B. Frit, Mater. Res. Bull., 2001, 36, 693–703 CrossRef CAS.
- J. C. Dewan, A. J. Edwards, G. R. Jones and I. M. Young, J. Chem. Soc., Dalton Trans., 1978, 1528–1532, 10.1039/DT9780001528.
- J.-C. Champarnaud-Mesjard, P. Thomas, M. Colas-Dutreilh and A. Oufkir, Z. Kristallogr. – New Cryst. Struct., 2001, 216, 195–196 Search PubMed.
- C. Artner and M. Weil, J. Solid State Chem., 2013, 199, 240–247 CrossRef CAS.
- F. C. Mathers and F. V. Graham, J. Am. Chem. Soc., 1929, 51, 3225–3228 CrossRef CAS.
- O. I. Tananaeva and A. V. Novoselova, Neorg. Mater., 1967, 3, 114–118 CAS.
- M. Gaitán, A. Jerez, P. Noguerales, C. Pico and M. L. Veiga, Synth. React. Inorg. Met.-Org. Chem., 1987, 17, 479–490 CrossRef.
- J. Galat, J. Haber, J. Nowotny and J. B. Wagner, Oxid. Met., 1975, 9, 497–506 CrossRef CAS.
- N. Berchenko, V. Savchyn, S. Fadeev, O. Afonin, J. Rysz, M. Trzyna and J. Cebulski, Mater. Sci. Semicond. Process., 2014, 21, 20–25 CrossRef CAS.
- A. W. Sleight, C. M. Foris and M. S. Licis, Inorg. Chem., 1972, 11, 1157–1158 CrossRef CAS.
- J. Galy, G. Meunier, S. Andersson and A. Åström, J. Solid State Chem., 1975, 13, 142–159 CrossRef CAS.
- L. Shimoni-Livny, J. P. Glusker and C. W. Bock, Inorg. Chem., 1998, 37, 1853–1867 CrossRef CAS.
- S.-H. Kim, J. Yeon and P. S. Halasyamani, Chem. Mater., 2009, 21, 5335–5342 CrossRef CAS.
- H. Huppertz, G. Heymann, U. Schwarz and M. R. Schwarz, in Handbook of Solid State Chemistry, ed. R. Dronskowski, S. Kikkawa and A. Stein, Wiley-VCH, Weinheim, 2017, vol. 2, ch. 2, pp. 23–48 Search PubMed.
- D. Walker, M. A. Carpenter and C. M. Hitch, Am. Mineral., 1990, 75, 1020–1028 Search PubMed.
- D. Walker, Am. Mineral., 1991, 76, 1092–1100 Search PubMed.
- WinXPOW Powder Diffraction Software, v3.3.0.1, STOE & CIE GmbH, Darmstadt, Germany Search PubMed.
- P. Thompson, D. E. Cox and J. B. Hastings, J. Appl. Crystallogr., 1987, 20, 79–83 CrossRef CAS.
- R. A. Young and P. Desai, Arch. Nauki Mater., 1989, 10, 71–90 Search PubMed.
- M. C. Morris, H. F. McMurdie, E. H. Evans, B. Paretzkin, H. S. Parker and N. P. Pyrros, NBS Monogr. (U. S.), 1984, 25, 62 Search PubMed.
- APEX2 (v. 2014.11-0), SAINT (v. 8.34A), and SADABS (v. 2014/5), Bruker AXS Inc., Madison, Wisconsin (USA) Search PubMed.
- L. Krause, R. Herbst-Irmer, G. M. Sheldrick and D. Stalke, J. Appl. Crystallogr., 2015, 48, 3–10 CrossRef CAS PubMed.
- G. Sheldrick, Acta Crystallogr., Sect. A: Found. Adv., 2015, 71, 3–8 CrossRef PubMed.
- G. M. Sheldrick, ShelXL – Crystal Structure Refinement – Multi-CPU Version, 2017/1, University of Göttingen, Göttingen, Germany Search PubMed.
- I. D. Brown, The Chemical Bond in Inorganic Chemistry: The Bond Valence Model, Oxford University Press, 2002 Search PubMed.
- S. V. Krivovichev and I. D. Brown, Z. Kristallogr. – Cryst. Mater., 2001, 216, 245–247 CrossRef CAS.
- S. J. Mills and A. G. Christy, Acta Crystallogr., Sect. B: Struct. Sci., Cryst. Eng. Mater., 2013, 69, 145–149 CrossRef CAS PubMed.
- G. de la Flor, D. Orobengoa, E. Tasci, J. M. Perez-Mato and M. I. Aroyo, J. Appl. Crystallogr., 2016, 49, 653–664 CrossRef CAS.
- M. I. Aroyo, J. M. Perez-Mato, C. Capillas, E. Kroumova, S. Ivantchev, G. Madariaga, A. Kirov and H. Wondratschek, Z. Kristallogr. – Cryst. Mater., 2006, 221, 15–27 CrossRef CAS.
- D. Hamani, O. Masson and P. Thomas, J. Appl. Crystallogr., 2020, 53, 1243–1251 CrossRef CAS.
- J. Tauc, Mater. Res. Bull., 1970, 5, 721–729 CrossRef CAS.
- P. Kubelka and F. Munk, Z. Tech. Phys., 1931, 12, 593–601 Search PubMed.
- OPUS (v 7.2), Bruker AXS GmbH, Billerica, USA Search PubMed.
- A. Erba, J. K. Desmarais, S. Casassa, B. Civalleri, L. Donà, I. J. Bush, B. Searle, L. Maschio, L. Edith-Daga, A. Cossard, C. Ribaldone, E. Ascrizzi, N. L. Marana, J.-P. Flament and B. Kirtman, J. Chem. Theory Comput., 2023, 19, 6891–6932 CrossRef CAS PubMed.
- R. Dovesi, A. Erba, R. Orlando, C. M. Zicovich-Wilson, B. Civalleri, L. Maschio, M. Rérat, S. Casassa, J. Baima, S. Salustro and B. Kirtman, Wiley Interdiscip. Rev.: Comput. Mol. Sci., 2018, 8, e1360 Search PubMed.
- L. Schimka, J. Harl and G. Kresse, J. Chem. Phys., 2011, 134, 024116 CrossRef PubMed.
- J. Laun and T. Bredow, J. Comput. Chem., 2021, 42, 1064–1072 CrossRef CAS PubMed.
- J. Laun, D. Vilela Oliveira and T. Bredow, J. Comput. Chem., 2018, 39, 1285–1290 CrossRef CAS PubMed.
- A. Mahmoud, A. Erba, K. E. El-Kelany, M. Rérat and R. Orlando, Phys. Rev. B: Condens. Matter, 2014, 89, 045103 CrossRef.
- H. J. Monkhorst and J. D. Pack, Phys. Rev. B: Condens. Matter, 1976, 13, 5188–5192 CrossRef.
- F. Izumi and K. Momma, Solid State Phenom., 2007, 130, 15–20 CAS.
- K. Momma and F. Izumi, J. Appl. Crystallogr., 2011, 44, 1272–1276 CrossRef CAS.
- T. Lu and F. Chen, J. Comput. Chem., 2012, 33, 580–592 CrossRef CAS PubMed.
- W. Humphrey, A. Dalke and K. Schulten, J. Mol. Graphics, 1996, 14, 33–38 CrossRef CAS PubMed.
- F. Pascale, C. M. Zicovich-Wilson, F. López Gejo, B. Civalleri, R. Orlando and R. Dovesi, J. Comput. Chem., 2004, 25, 888–897 CrossRef CAS PubMed.
- C. M. Zicovich-Wilson, F. Pascale, C. Roetti, V. R. Saunders, R. Orlando and R. Dovesi, J. Comput. Chem., 2004, 25, 1873–1881 CrossRef CAS PubMed.
- L. Maschio, B. Kirtman, R. Orlando and M. Rèrat, J. Chem. Phys., 2012, 137, 204113 CrossRef PubMed.
- J. C. Decius and R. M. Hexter, Molecular vibrations in crystals, McGraw-Hill, 1977 Search PubMed.
- L. Falck, O. Lindqvist, W. Mark, E. Philippot and J. Moret, Acta Crystallogr., Sect. B: Struct. Crystallogr. Cryst. Chem., 1978, 34, 1450–1453 CrossRef.
- M. Weil, P. Pramanik, P. Maltoni, R. Clulow, A. Rydh, M. Wildner, P. Blaha, G. King, S. A. Ivanov, R. Mathieu and H. Singh, Adv. Mater., 2024, 5, 3001–3013 RSC.
- J. Isasi, J. Alloys Compd., 2001, 322, 89–96 CrossRef CAS.
- D. Hottentot and B. O. Loopstra, Acta Crystallogr., Sect. B: Struct. Crystallogr. Cryst. Chem., 1979, 35, 728–729 CrossRef.
- J. Lapasset and J. Moret, Acta Crystallogr., Sect. C: Cryst. Struct. Commun., 1985, 41, 1558–1562 CrossRef.
- M. Weil, B. Stöger, C. Gierl-Mayer and E. Libowitzky, J. Solid State Chem., 2016, 241, 187–197 CrossRef CAS.
- R. Shannon, Acta Crystallogr., Sect. A: Cryst. Phys., Diffr., Theor. Gen. Crystallogr., 1976, 32, 751–767 CrossRef.
- A. G. Christy, S. J. Mills and A. R. Kampf, Mineral. Mag., 2016, 80, 415–545 CrossRef.
- O. C. Gagne and F. C. Hawthorne, IUCrJ, 2020, 7, 581–629 CrossRef CAS PubMed.
- A. Bondi, J. Phys. Chem., 1964, 68, 441–451 CrossRef CAS.
- N. Kumada, N. Kinomura, P. M. Woodward and A. W. Sleight, J. Solid State Chem., 1995, 116, 281–285 CrossRef CAS.
- R. Enjalbert, S. Sorokina, A. Castro and J. Galy, Acta Chem. Scand., 1995, 49, 813–819 CrossRef CAS.
- W. Jeitschko and A. W. Sleight, Acta Crystallogr., Sect. B: Struct. Crystallogr. Cryst. Chem., 1973, 29, 869–875 CrossRef CAS.
- M. B. Asberg Dahlborg, G. Svensson and T. Ouvarova, Acta Crystallogr., Sect. C: Cryst. Struct. Commun., 2000, 56, 397–398 CrossRef PubMed.
- J. Amador, E. Gutierrez Puebla, M. A. Monge, I. Rasines and C. Ruiz Valero, Inorg. Chem., 1988, 27, 1367–1370 CrossRef CAS.
- R. Hoppe and R. Homann, Z. Anorg. Allg. Chem., 1970, 379, 193–198 CrossRef CAS.
- M. Weil, E. Tillmanns and D. Y. Pushcharovsky, Inorg. Chem., 2005, 44, 1443–1451 CrossRef CAS PubMed.
- H. Müller-Buschbaum, Z. Anorg. Allg. Chem., 2002, 628, 2559–2584 CrossRef.
- L. M. Gelato and E. Parthé, J. Appl. Crystallogr., 1987, 20, 139–143 CrossRef.
- I. Brown, Acta Crystallogr., Sect. B: Struct. Sci., 1992, 48, 553–572 CrossRef.
- A. Salinas-Sanchez, J. L. Garcia-Muñoz, J. Rodriguez-Carvajal, R. Saez-Puche and J. L. Martinez, J. Solid State Chem., 1992, 100, 201–211 CrossRef CAS.
- K. D. Miller and J. M. Rondinelli, APL Mater., 2023, 11, 101108 CrossRef CAS.
- Handbook of Chemistry and Physics, ed. R. C. Weast, CRC Press, Boca Raton, Florida, USA, 63rd edn, 1982, B-155 Search PubMed.
- P. Paufler and Z. Weber, Eur. J. Mineral., 1999, 11, 721–730 CrossRef CAS.
- T. Langreiter and V. Kahlenberg, Crystals, 2015, 5, 143–153 CrossRef.
- P. S. Halasyamani and W. Zhang, Inorg. Chem., 2017, 56, 12077–12085 CrossRef CAS PubMed.
- W. Setyawan and S. Curtarolo, Comput. Mater. Sci., 2010, 49, 299–312 CrossRef.
- P. Pramanik, F. Eder, M. Weil, S. A. Ivanov, P. Maltoni, R. Miletich, T. Edvinsson and R. Mathieu, Phys. Rev. B: Condens. Matter, 2024, 110, 054104 CrossRef CAS.
- R. L. Frost and E. C. Keeffe, J. Raman Spectrosc., 2009, 40, 866–869 CrossRef CAS.
- R. Ziegler, F. R. S. Purtscher, H. A. Schwartz, T. S. Hofer and G. Heymann, Dalton Trans., 2023, 52, 2243–2254 RSC.
- R. Ziegler, F. R. S. Purtscher, T. S. Hofer and H. Huppertz, Eur. J. Inorg. Chem., 2023, 26, e202300120 CrossRef CAS.
- R. Ziegler, F. R. S. Purtscher, L. Bayarjargal, T. S. Hofer and H. Huppertz, Z. Anorg. Allg. Chem., 2023, 649, e202300093 CrossRef CAS.
- R. Ziegler, F. R. S. Purtscher, T. S. Hofer, G. Heymann and H. Huppertz, J. Solid State Chem., 2024, 330, 124458 CrossRef CAS.
Footnotes |
| † Electronic supplementary information (ESI) available. CCDC 2380686. For ESI and crystallographic data in CIF or other electronic format see DOI: https://doi.org/10.1039/d4dt02697g |
| ‡ The setting in I2/a can be transformed to the standard setting in C2/c by the transformation matrix (P, p): −a − c,b,a; 0,0,0. |
| This journal is © The Royal Society of Chemistry 2024 |

