 Open Access Article
Extensive HPLC-tandem mass spectrometry characterization of soluble degradation products of biodegradable nanoplastics under environmentally relevant temperature and irradiation conditions†
Thierry
Douki
 *,
Vérane
Bard‡
,
Maëva
Boulée‡
and
Marie
Carrière

Univ. Grenoble Alpes, CEA, CNRS, IRIG, SyMMES, F 38000 Grenoble, France. E-mail: thierry.douki@cea.fr
First published on 1st August 2024
Abstract
Polyester-based plastics, and in particular biodegradable ones, are increasingly used because they may be a partial solution to environmental pollution issues. Therefore, proper identification of their degradation products is strongly needed. In the present work, we optimised a method to investigate the degradation of two biodegradable polymers, polylactic acid (PLA) and polycaprolactone (PCL), together with the non-biodegradable polyethylene terephthalate (PET). We focused the work on nanosize particles (150–200 nm), in relationship with the concern about the presence of nano- and micro-plastics in the environment. We aimed at characterizing the low molecular weight degradation products, which are likely to diffuse and interact with living cells. For this purpose, the polymer samples were aged at 40 or 55 °C under simulated sunlight in a climatic chamber, i.e. in highly controlled conditions, and the resulting liquid phase was analyzed by liquid chromatography coupled to tandem mass spectrometry. The latter technique was used in four different detection modes: single stage mass spectrometry, product ion scan, precursor ion scan and neutral loss. While the first technique has been applied in other works, the unique combination of all these analytical strategies allowed us to show that hydrolysis was the overwhelming degradation pathway for PLA, PCL and even PET. Oligomers ranging between 1 and 8 monomers were identified for PLA and 2 and 8 for PCL. Shorter compounds composed of 1 to 4 units were detected in PET samples. Altogether, the present work reports novel information on the degradation of nanosize plastics and proposes a robust analytical strategy for the extensive characterization of soluble degradation products of plastic material.
Environmental significanceThe accumulation of plastics in the environment has led to the development of biodegradable polymers that may reduce the burden of pollution by micro- and nanoplastics. This approach will be safe only if the degradation products exhibit neither toxicological nor ecotoxicological properties. Their accurate characterization is thus of outmost importance. In the present work, we studied two widely used biodegradable polymers, polylactic acid and polycaprolactone. An analytic strategy based on liquid chromatography coupled to tandem mass spectrometry was designed. Plastics were in the nanosize form and were aged under well controlled conditions in a climatic chamber. Hydrolysis was found to be the unique degradation process. The versatility of the approach was shown by the study of a third compound, the non-biodegradable polyethylene terephthalate, which was actually found to also undergo hydrolysis. |
Introduction
Increasing use of plastics over the last decades has led to the accumulation of poorly degradable wastes in the environment. Plastics are composed of both an essential polymer and a series of additives aimed at facilitating manufacturing and improving mechanical or aesthetic properties of the final products. Evidence are growing that these plastic wastes decompose into micro and nanoparticles1 while releasing some or all of their additives in the environment. These species can affect the fauna and the flora and possibly exhibit toxicity to humans.1–3 As a response to this pollution issue, a trend in regulation is the ban of single-use and/or conventional plastics in some industrial sectors. Another possibility, deployed for more than a decade, is the development of eco-friendly biodegradable plastics, which can be either fossil (petroleum)-based or bio-based.4–6 The chemical structure of these materials exhibits less stable functions than the carbon–carbons bonds found in many non-degradable plastics like polyethylene, polypropylene, and polyvinyl chloride. In many biodegradable plastics, the link between monomeric units is provided by ester groups that can easily be either chemically or enzymatically hydrolysed. In addition, the lability of these chemical bonds facilitates the production of monomers in chemical recycling or when exposed to stringent environmental conditions,4,6 which is also a source of possibly harmful plastic degradation products.The characterization of biodegradable plastics degradation products appears as a requisite to the proper understanding of their physico-chemical properties. It is also important for the assessment of the toxicological and ecotoxicological consequences of release of these compounds in the environment. Mass spectrometry (MS) appears as a very valuable tool for this purpose. MS combined to gas chromatography separation has already been used for the identification of small volatile products released upon thermal degradation.7,8 HPLC coupled to mass spectrometry detection has also been used for the quantification of additives9,10 and non-intentionally added substances11 released upon aging of plastics. The same tools were applied to the degradation and the chemical recycling of biodegradable plastics.8 These works were mostly focussed on food packaging or environmental samples.12–16 Although some of these works involved some quadrupole-time of flight (Q-TOF) analyses, most of them were performed in single stage mass spectrometry (MS1) or by tandem mass spectrometry (HPLC-MS/MS) used in the targeted sensitive multiple reaction monitoring mode (MRM) on triple quadrupolar systems. However, the latter LC-MS techniques provide only limited structural information.
In the present work, we designed a strategy that took advantage of the numerous detection modes provided by quadrupolar technologies for the unambiguous characterization, rather than the simple detection, of low molecular weight compounds released upon aging of biodegradable plastics in water. In that respect, triple quadrupolar technologies, which make possible precursor ion scan or neutral loss analyses, are more informative than high resolution techniques. Importantly, our purpose was not to collect new mass spectrometry data on polymers, which has been done for many plastics,17 but to use HPLC-MS/MS as a powerful tool for the identification of the major degradation products and the search for minor derivatives.
Emphasis was placed in the present work on polylactic acid (PLA), which is the most widely used biodegradable plastic,5,18 and on polycaprolactone (PCL), which is a fossil-based biodegradable polymer. Polyethylene terephthalate (PET) was also studied because it is the main constituent of plastic bottles and represents a major environmental threat.19 Its annual global production accounts for 10% of the 450 million tons of total production of plastics.3 PET is not a biodegradable plastic but was included in this work because it exhibits ester bonds. A specificity of our work is that PLA, PCL and PET (Scheme 1) were studied in their nanosize form. Data are available on the degradation of bulk biodegradable polymers but nanoplastics represent a form of concern in terms of environmental impact and that deserves interest. Another aspect is the use of pure polymers of PCL and PLA, devoid of additives, instead of the complete formulations investigated in most studies.
 | ||
| Scheme 1 Chemical structure of the studied polymers. The reported values expressed in universal mass units (uma) are the molecular weight of their respective repetitive units. | ||
Material and methods
Chemicals and plastic nanoparticles
Acetonitrile (ACN) of HPLC-MS grade was a Carlo Erba product (Val-de-Reuil, France). Ammonium formate (10 M in water) and formic acid (HPLC-MS grade) were purchased from Aldrich (Saint Quentin-Fallavier, France). Water used for the preparation of HPLC mobile phases and for suspensions of particles was purified on a Milli-Q system. PLA (120 nm) was purchased as an aqueous suspension from Adjuvatis (Lyon, France). PCL (200 nm) was provided as an aqueous suspension by Phosphorex (Hopkinton, MA, USA). PET particles were kindly provided by A. Hernandez (Universitat Autonoma de Barcelona, Spain) as a water suspension.20 The size distribution of the PET particles was centred on 200 nm. All these particles were diluted in ultrapure water to the final concentration of 10 mg mL−1.Synthesis of PCL oligomers
A vial containing 30 mg of pure 6-hydroxyexanoic acid (Aldrich, Saint Quentin-Fallavier, France) was left at 50 °C for 186 h. Water (1 mL) was then added. The resulting suspension was sonicated and 2 mL of a solution at 1 mg mL−1 in water was prepared. This stock solution was then diluted at 0.01 mg mL−1 in water for HPLC-MS analyses.Aging of particle in aqueous suspension
The suspensions (3 mL) were placed in a quartz spectrophotometer cuvette (1 × 1 × 3.5 cm). A magnetic bar was added and the cuvette was closed. The sample was placed on a magnetic stirrer placed in a Q-Sun Xe-1 xenon test chamber (Q-Lab Corporation, Westlake, Ohio). It was fitted with a xenon lamp properly filtered to emit a light mimicking the solar spectrum. The aging procedure was inspired from the ISO 4892-2:2013 guideline.21 The intensity was adjusted to 1.44 W m−2 nm−1 measured at 420 nm, which corresponds to an equatorial zenithal exposure. The typical irradiation temperature was 40 °C measured in the sample and the exposure time was 96 h. For PLA, an additional aging experiment was performed at 55 °C. In the case of PLA and PCL, 200 μL of the aged suspension and 200 μL of the initial suspension kept at 4 °C during aging (control sample) were then filtered in a centrifuge filtering tube bearing a 0.2 μm nylon membrane (VWR International, Rosny-sous-Bois, France). In the case of PET, the aged suspension was centrifuged 10 min at 10![[thin space (1/6-em)]](https://www.rsc.org/images/entities/char_2009.gif) 000 × g. The aqueous phase was collected and filtered at 0.2 μm. ACN (200 μL) was added to the pellet and the sample was vortexed. The resulting suspension was then filtered in a centrifuge filtering tube bearing a 0.2 μm nylon membrane. In all cases, liquid phases were then collected and placed in HPLC vials.
000 × g. The aqueous phase was collected and filtered at 0.2 μm. ACN (200 μL) was added to the pellet and the sample was vortexed. The resulting suspension was then filtered in a centrifuge filtering tube bearing a 0.2 μm nylon membrane. In all cases, liquid phases were then collected and placed in HPLC vials.
HPLC-tandem mass spectrometry analyses
HPLC separations were performed on a ExionLC AD series chromatographic system (SCIEX, Framingham, MA) equipped with an octadecylsilyl silica gel on line column (Nucleodur C18 HTec, 1.8 μm particle size, 2 × 100 mm ID, Macherey Nagel, Gutenberg, France). The flow rate was 0.35 ml min−1 and the oven temperature 50 °C. The mobile phases were a 2 mM ammonium formate containing 0.2% formic acid (A) and ACN with 0.2% formic acid (B). For PCL and PLA, the initial composition of the gradient was pure A. The proportion of B was then increased to 10% in 12 min, set to 60% at 20 min and reached 100% at 22 min. The latter composition was maintained for 3 min. In the case of PET, the initial composition was 90% A/10% B. The proportion of B reached 70% at 10 min and 100% at 22 min. This composition was maintained for 4 min. The chromatographic flow was then directed toward the turbo ionspray source of a 6500+ Qtrap mass spectrometer (SCIEX). The pressure of curtain gas, ion source gas 1 (nebulization) and ion source gas 2 (heated sheath gas) were set at 45, 60 and 60 psi respectively, while the source temperature was 550 °C. The exhaust gas (air) was set at 25 L min−1. The ion spray voltage was 5000 V in the positive mode and −4500 in the negative one. MS1 experiments were performed in the “enhanced mode” where the third quadrupole of the spectrometer is used as a linear ion trap in order to improve resolution and sensitivity. Analyses involving fragmentation (product ion scan, precursor ion scan, neutral loss) were used in a classical triple quadrupolar configuration. The pressure of collision gas was then set to “medium” while the collision energy was either 30 V in the positive mode or −30 V in the negative mode.Results
PLA
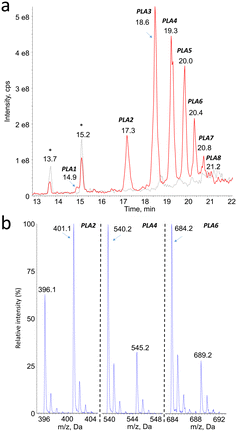
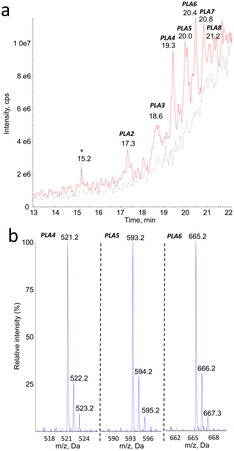
Mass spectrometry was found to be well suited for the identification of PLA degradation products. Efficient ionization was achieved by electrospray, especially in the positive mode (ESI+). The rich fragmentation patterns allowed using all the corresponding detection modes, including product ion scan (MS2), precursor ion scan, and neutral loss.Monitoring of the chromatogram in negative electrospray (ESI−) was less sensitive than in the positive mode, in a roughly 1 to 50 ratio. However, peaks were unambiguously detected at the same retention time than compounds PLA1 to PLA8 (Fig. 2a, Table 1). The major ions detected in the negative mode corresponded in all cases to [M–H]− pseudo-molecular ion of the product identified in the positive mode (Fig. 2b). The series of compounds with 72 mass unit difference was thus confirmed. This observation strongly suggests that the analytes are lactic acid oligomers.
| Compound # | PLA1 | PLA2 | PLA3 | PLA4 | PLA5 | PLA6 | PLA7 | PLA8 |
|---|---|---|---|---|---|---|---|---|
| Retention time | 15.0 | 17.3 | 18.5 | 19.4 | 19.9 | 20.3 | 20.7 | 21.1 |
| m.w. | 306 | 378 | 450 | 522 | 594 | 666 | 738 | 810 |
| Number of PLA units | 4 | 5 | 6 | 7 | 8 | 9 | 10 | 11 |
| [M + NH4]+ | 324 | 396 | 468 | 540 | 612 | 684 | 756 | 828 |
| [M + Na]+ | 329 | 401 | 473 | 545 | 617 | 689 | 761 | 833 |
| [M–H]− | n.d. | 377 | 449 | 521 | 593 | 665 | 737 | n.d. |
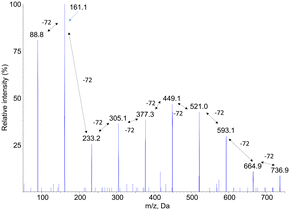
Fragmentation spectra in the negative mode of the [M–H]− pseudo-molecular ions also showed a series of fragments separated by 72 mass units. However, the yield of fragmentation was much larger than for [M + Na]+ ions. As illustrated in Fig. 3 for compound PLA7, the all set of −72 peaks could be observed until a final fragment corresponding to monomeric lactic acid. A major information inferred from these fragmentation spectra, recorded either in the positive or negative mode, is a confirmation of the presence of lactic acid moieties that are sequentially released upon fragmentation. This information strongly suggests that the compounds are linear oligomers of lactic acid.
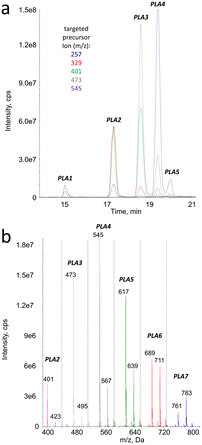
In the ESI+ analyses in the precursor ion scan mode, the targeted product ions were those detected upon fragmentation of the [M + Na]+ pseudo-molecular ions. Those arising from [M + NH4]+ species were not selected because of the complexity of the fragmentation spectra of the latter pseudo-molecular ions. The retention times of all the peaks observed on the chromatograms monitored in the precursor ion scan (Fig. 4a) mode corresponded to those found in the MS1 analyses. The m/z ratio of the detected parent pseudo molecular ions were 72 or 144 mass unit larger than the targeted fragments. In −72 neutral loss detection, the pseudo-molecular ions [M + Na]+ and [M + 2Na]+ were observed at the same retention times, in agreement with MS1 data (Fig. 4b). However, in contrast to the latter analyses the [M + NH4]+ species were not observed because their fragmentation pattern did not lead to significant loss of the monomeric lactic acid moiety.
Similar analyses in the negative ionization mode were less sensitive. However, like with positive ionization, peaks were observed with mass spectrometry features confirming the presence of series of fragments with m/z value separated by 72. The neutral loss analyses confirmed the presence of compounds producing fragments with loss of 72 mass units. In both the positive and the negative mode, the pseudo-molecular ions detected were the same as those determined in the MS1 experiments. The combination of the ion precursor scan and neutral loss data (ESI† Table S1) thus unambiguously confirmed that the degradation products of PLA represent a series of products with increasing number of a 72 mass unit moiety. Unambiguous identification of the degradation products of PLA as linear hydrolysed oligomers would require the comparison with authentic standards. However, the consistency of the MS1, MS2, precursor ion scan and neutral loss analyses, with both positive and negative electrospray ionizations, make this conclusion most likely.
PCL
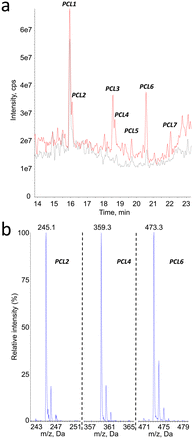
The same analytical strategy was applied to the identification of degradation products of PCL. In contrast to PLA, the detection was more sensitive in the negative mode. The MS1 analyses revealed the presence of 6 degradation products, in addition to PCL1 (vide infra) and other compounds present before aging (Fig. 5a). Peak corresponding to products PCL2, PCL4, PCL6 and PCL7 yielded MS1 spectra with a [M–H]− pseudo-molecular ion at m/z = 245, 359, 473 and 587, respectively (Fig. 5b for PCL2, PCL4 and PCL6). These values are separated by 114 mass units, which can be explained by loss of 6-hydroxy-hexanoic acid unit from larger molecules. Moreover, 246 is the molecular weight of a caprolactone dimer. Therefore, compounds PCL2, PCL4, PCL6 and PCL7 can be proposed to be dimer, trimer, tetramer and pentamer of caprolactone.The hypothesis that compounds PCL2, PCL4, PCL6 and PCL7 were caprolactone oligomers was confirmed by the product ion scan analysis. MS2 spectra yielded a series of product ions separated by 144 mass unit. The fragmentation spectrum of compound PCL7 was especially informative (Fig. 6). This product is expected to be the PCL pentamer. A series of product ions corresponding to all the shorter oligomers down to the 6-hydroxy hexanoic monomer were actually observed.
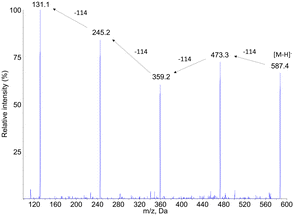 | ||
| Fig. 6 Negative electrospray ionization fragmentation mass spectra of the [M–H]− pseudo–pseudo molecular ion of compound PCL7, namely the PCL pentamer. | ||
Other mass spectrometry detection modes confirmed these structural assignments. Search for precursors of the PCL oligomers yielded peaks only at the retention times of compounds PCL2, PCL4, PCL6 and PCL7 (ESI† Fig. S3a). The m/z values detected for the corresponding products were in all cases equal or lower by one or two multiples of 114 mass unit from the expected molecular ion. Neutral loss analyses confirmed the presence of the oligomers (ESI† Fig. S3b). When a −114 transition was monitored, all the peaks previously identified were observed. Only one additional compound, PCL8, was detected at longer retention times. Its molecular weight was found to be 702, which correspond to the PCL hexamer. In summary, all the mass spectrometry features strongly suggested a structural assignment of the detected compounds as a series of oligomers from the dimer to the hexamer of PCL (Table 2). Confirmation of the proposed structure was provided by comparison of the chromatograms obtained upon analysis of synthetic oligomers and aged PCL particles (ESI† Fig. S4).
| Compound # | PCL2 | PCL4 | PCL6 | PCL7 | PCL8 |
|---|---|---|---|---|---|
| Retention time (min) | 16.1 | 18.7 | 20.6 | 22.1 | 22.6 |
| m.w. | 246 | 360 | 474 | 588 | 702 |
| Number of 6-OH-HAc units | 2 | 3 | 4 | 5 | 6 |
| [M–H]− MS1 | 245 | 359 | 473 | 587 | n.d. |
| Precursor of ions | 131 | 131 | 131 | 473 | |
| 245 | 245 | ||||
| 359 | |||||
| [M–H]− with NL72 | 245 | 359 | 473 | 587 | 701 |
In addition to these PCL oligomers, other compounds were detected in the aged PCL samples. A compound (PCL1) eluting at 15.9 min was already present in the pristine sample. Its spectrum exhibited two main peak at m/z 259 and 145. The corresponding compound was thus identified as a methylated PCL dimer. Compound PCL3 (Rt 18.3 min) was not initially present. The pseudo-molecular ion of its MS1 spectrum was at m/z 373. Fragmentation of this ion provided a spectrum similar to that of compound PCL1. It can thus be proposed that PCL3 is a trimer of a methylated PCL produced during aging. The issue of PCL methylation was confirmed by the observation of small peaks eluting just before the PCL oligomers on the neutral loss chromatograms that exhibited pseudo-molecular ion at m/z +14 compared to PCL derivatives (red arrows on ESI† Fig. S3b). Other unidentified products were also detected. They most likely did not arise from PCL degradation since they varied from one batch of purchased particles to the other. It was the case in the present experiment of compound PCL5. Its MS1 spectrum exhibits a complex series of ions with a putative pseudo-molecular ion at m/z 459 and a corresponding sodium adduct at m/z 481. Fragmentation experiments did not allow us to unravel the structure.
PET
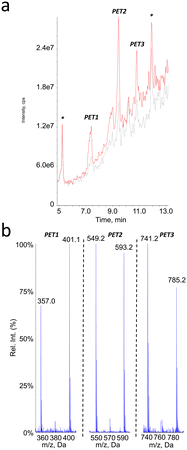
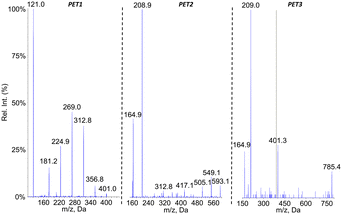
Because of the presence of an aromatic ring in PET, we expected that putative photoproducts would not be water-soluble. Therefore, analyses were performed on both the filtered aqueous fraction of aged suspensions and on an ACN extract of the pellet obtained by centrifugation of the sample. The mass spectrometer was used in the negative ionization mode since no peak could be detected in ESI+. The larger hydrophobicity of PET monomer also prompted us to use a gradient with a larger proportion of ACN than for PLA and PCL. No additional peak compared to the pristine particles was observed in the chromatogram of the aqueous fraction of the aged PET suspensions. In contrast, three new signals were observed in the ACN fractions, corresponding to compounds PET1, PET2 and PET3 (Fig. 7a). The m/z value of the pseudo-molecular ions, which exhibited differences of 192 mass units, suggested that the corresponding compounds were the dimer, trimer and tetramer of ethylene terephthalic acid. It was also observed that all spectra exhibited a peak corresponding to the loss of CO2, thereby confirming the presence of a carboxylic group (Fig. 7b).The oligomeric nature of the detected products was confirmed by the fragmentation spectra (Fig. 8). The fragments corresponding to the dimer and monomer were detected upon fragmentation of the tetramer. Similarly, fragmentation of the trimer yielded the monomer. Last, the fragmentation of the dimer did not yield the monomer but a series of fragments (–CO2, –O![[double bond, length as m-dash]](https://www.rsc.org/images/entities/char_e001.gif) C–O–CH2–CH2–OH, benzoic acid and some substituted derivatives, etc.). It should be stressed that MS2 analysis of [M–H–CO2]− ions of the tetramer and trimers yielded the fragments similar to those observed upon fragmentation of [M–H]− ions but as decarboxylated derivatives (data not shown).
C–O–CH2–CH2–OH, benzoic acid and some substituted derivatives, etc.). It should be stressed that MS2 analysis of [M–H–CO2]− ions of the tetramer and trimers yielded the fragments similar to those observed upon fragmentation of [M–H]− ions but as decarboxylated derivatives (data not shown).
Analyses in precursor ion scan confirmed the m/z ratio of the pseudo-molecular ion associated to peaks PET1, PET2 and PET3 (Table 3). An additional compound PET4 corresponding to the PET pentamer was identified as its pseudo-molecular ion is a precursor of fragments at m/z 401. These data were confirmed by an analysis in the product ion scan mode of the ion m/z 977 (ESI† Fig. S5) with observation of fragments corresponding to the dimer (m/z 209) and trimer (m/z 401) of PET. Other analyses were performed in the neutral loss mode. In contrast to PLA and PCL, we did not monitor fragmentations corresponding to the loss of one unit of ethylene terephthalic acid (192 uma) but two (384 uma) as observed on the fragmentation mass spectra. Using this approach, we could confirm the molecular weight of compounds PET2 and PET3. Compound PET1 was not detected because its fragmentation does involve loss of ethylene terephthalic acid. The pentamer was also not detected because it does not yield the fragment at m/z 593 upon fragmentation. Altogether, the collected data strongly suggest the PET is partly hydrolysed upon aging in water. Definitive structural assessment would yet require comparison with authentic standards.
| Compound # | PET1 | PET2 | PET3 | PET4 |
|---|---|---|---|---|
| Retention time (min) | 7.4 | 9.5 | 10.8 | 11.6 |
| m.w. | 402 | 594 | 786 | 978 |
| Number of PET units | 2 | 3 | 4 | 5 |
| [M–H]− MS1 | 401 | 593 | 785 | n.d. |
| Precursor of ions | 209 | 209 | 401 | 401 |
| 401 | ||||
| [M–H]− with NL 384 | 593 | 785 |
Discussion
The first objective of this work was the identification of the small molecules released upon aging of three polymers (PLA, PCL and PET), two of them being biodegradable (PLA and PCL). We used these materials as pure compounds, free of additives. Moreover, experiments were performed in pure aqueous suspensions. Aging was induced only by increased temperature and simulated sunlight exposure in both the UV and visible ranges. In this way, the collected data provide information on the intrinsic stability and reactivity of the studied plastics. In addition, we chose to work with nanosize plastics. Some information are available on bulk materials such as films or pellets8,12,13,16,22 but little in the submicron range. The first series of analyses was carried out in the MS1 mode. Samples of aged PLA, PCL and PET were found to contain oligomers of lactic acid, 6-hydrohexanoic acid and 2-hydroxyethyl terephthalic acid, respectively. This conclusion was based on the observation on the chromatograms of peaks corresponding to oligomers of increasing sizes. In the case of PCL, further structural confirmation was provided by comparison with synthetic oligomers. The number of monomeric units present in these fragments ranges between 4 and 11 for PLA, 2 and 6 for PCL, and 2 and 4 for PET. In the latter case, it cannot be ruled out that longer oligomers may have been lost in the sample preparation because of a poor solubility in water. Another point is that because the glass transition temperature of PLA ranges between 55 and 60 °C, and is associated with an increase in the hydrolysis rate,23 we performed aging of these particles at both 55 and 40 °C. As expected, we observed that the amount of oligomers was five times larger when aging was performed at 55 °C compared to 40 °C. Glass transition temperature is −60 °C for PCL and more than 75 °C for PE. They are thus not relevant to environmental conditions and experiments with these two polymers were performed only at 40 °C.Our results confirm that, even at the nanoscale, hydrolysis is a favoured route of degradation of polyesters. This is well documented for PLA and PCL.22,24 In contrast, PET is described as a stable material and its abiotic hydrolysis is less studied. As a consequence, only limited information is available on the identity of the released hydrolysis products.3,25 Our observations show that hydrolysis is a common degradation route upon aging of PET, which is polyester-based polymer like PLA and PCL. Another result is that, although aging was performed under aerobic conditions, we did not observe, for the three studied materials, the presence of products that could arise from oxidative processes as those reported upon degradation of PCL22,26 or poly(butylene)succinate8 in oxidizing environments. The only additional detected compounds were impurities present before aging. In the case of PCL, evidence was obtained for the presence of methylated oligomers. Their presence could be explained by the fact that the carboxylic end of PCL is often end-capped by a methyl group to increase stability. Presence of similar products have been observed upon aging of PLA-based packaging material in food simulants.13 A last interesting observation made during these MS1 analyses is that oligomers were detectable in negative electrospray ionization as [M–H]− pseudo-molecular ions, which is expected for carboxylic acids. However, PLA derivatives could also be detected in positive ionization and with a much larger sensitivity than in the negative mode. This unique property could be explained by fact that, in PLA, the terminal hydroxyl group is in α-position of the carbonyl group of the ester link. This may favour the formation of adducts with cation such as Na+ or NH4+ observed in the present experiments.
Detection of PLA and PCL oligomers upon MS1 analyses has been reported in several works.8,13,14,27 The observation of degradation products exhibiting differences in molecular weight corresponding to the oligomers of the studied polymer is an interesting information. However, much more data can be provided by tandem mass spectrometry used in different detection modes. In the present work, we first analysed the samples in the product ion scan mode in order to record fragmentation spectra of the pseudo-molecular ions detected in the MS1 analyses. In all cases, fragmentation of the [M–H]− pseudo molecular ions yielded a series of fragments corresponding to oligomers shorter than the one studied. This confirmed that the detected products are actually oligomers of PLA, PCL or PET and no other products with identical molecular weight. Fragmentation spectra of PLA could also be obtained in the positive ionization mode and the [M + Na]+ pseudo molecular ion was also found to yield shorter oligomers. The observation of fragmentation into oligomers is interesting because it corresponds to a hydrolysis reaction. Water is obviously not available in mass spectrometer that are operated in high vacuum. As previously proposed for the sodium adducts of PLA oligomers28 and poly(butylene adipate),17 fragmentation is driven by an intramolecular reaction of the terminal hydroxyl function with an adjacent ester bond leading to the cleavage of the chain. In that respect, it is similar to the process reported for the alkaline hydrolysis of PLA in solution.27 Interestingly, loss of a single monomer from the pseudo-molecular ion was not observed upon fragmentation of PET oligomers. This may be explained by the steric hindrance in this species that prevents the alcohol terminus to react with the closest ester link. In may be stressed that fragmentation in the negative mode of the [M–H]− pseudo-molecular ions of PLA and PCL oligomers yielded all the oligomers down to the monomers. Altogether, the fragmentation data confirmed the oligomeric nature of the detected products.
Additional analyses were performed to strengthen the conclusions and to identify additional compounds that could exhibit parts of structure similar to hydrolysis products. Typically, we were interested in determining whether oxidation or rearrangement products were generated during aging. For this purpose, we used the mass spectrometer in two modes that allow detecting parent ions based on known fragmentation patterns. We first analysed the sample in the precursor ion scan, using fragments identified in the MS2 experiments as targets. In all cases, the m/z ratio of the detected parent ions were in agreement with those determined in the MS1 experiments. The second set of analyses was performed in the neutral loss mode. For this purpose, we aimed at detecting on the chromatograms all the compounds that could undergo loss of either lactic acid, 6-hydrohexanoic acid or 2-hydroxyethyl terephthalic acid for PLA, PCL and PET, respectively. Again, the detected parent ions all exhibited an m/z ratio equal or lower to that of the pseudo-molecular ions detected in MS1 experiments. It may be added that, because the noise of the detection is lower in detection modes involving fragmentation reactions, a better sensitivity than in MS1 was achieved. This allowed detecting longer oligomers present in low amounts that could not be observed on the MS1 chromatograms.
Conclusions
The present work provides some novel information on the extensively studied topic of the degradation of biodegradable plastics. We have shown that pure polymers in pure water could undergo hydrolysis under the sole action of moderate heating and solar light exposure, which are typically found in harsh environmental conditions. In the present work, the conditions used mimicked a realistic equatorial exposure. The experiments were performed on nanoparticles and submicronic particles. A more quantitative comparison with larger pellets could be interesting in terms of kinetics to determine whether the three phases of degradation (loss of weight, degradation of mechanical properties, and loss of mass) taking place in bulk biodegradable plastics are also observed on lower size scales. Another interest of the present study is the design of a rationale strategy for the identification of small molecular degradation products released from plastics. Using tandem mass spectrometry in all its possible modes makes possible an extensive characterization of the released compounds. Such information on the chemical nature of putative environmental pollutants is important for further toxicological and ecotoxicological studies.Data availability
Data for this article, including tabulated mass spectra, are available at Zenodo.org at https://zenodo.org/uploads/13134611.Conflicts of interest
There are no conflicts to declare.Acknowledgements
This work was carried out in the frame of the PlasticHeal project, which has received funding from the European Union's Horizon 2020 research and innovation programme under grant agreement No. 965196. It was also funded by the Agence Nationale de la Recherche (ANR, PLASTOX grant ANR-21-CE34-0028-02), the Agence Nationale de Sécurité Sanitaire de l'Alimentation, de l'Environnement et du Travail (ANSES, EXMINA grant, PNR EST-21-077) and the Agence de la transition écologique (ADEME, PhD grant for M. Boulée). The authors would like to thank A. Hernandez, R. Marcos and A. Villacorta (Universitat Autonoma de Barcelona, Spain) for the provision of PET particles.References
- K. Zhang, A. H. Hamidian, A. Tubic, Y. Zhang, J. K. H. Fang, C. Wu and P. K. S. Lam, Environ. Pollut., 2021, 274, 116554 CrossRef CAS PubMed.
- L. Liu, M. Xu, Y. Ye and B. Zhang, Sci. Total Environ., 2022, 806, 151312 CrossRef CAS PubMed.
- S. S. Ali, T. Elsamahy, E. Koutra, M. Kornaros, M. El-Sheekh, E. A. Abdelkarim, D. C. Zhu and J. Z. Sun, Sci. Total Environ., 2021, 771, 144719 CrossRef CAS PubMed.
- M. C. Shen, B. Song, G. M. Zeng, Y. X. Zhang, W. Huang, X. F. Wen and W. W. Tang, Environ. Pollut., 2020, 263, 114469 CrossRef CAS PubMed.
- T. D. Moshood, G. Nawanir, F. Mahmud, F. Mohamad, M. H. Ahmad and A. AbdulGhani, Curr. Res. Green Sustainable Chem., 2022, 5, 100273 CrossRef CAS.
- R. Kumar, K. Sadeghi, J. Jang and J. Seo, Sci. Total Environ., 2023, 882, 163446 CrossRef CAS PubMed.
- S. Karlsson, C. Sares, R. Renstad and A. C. Albertsson, J. Chromatogr. A, 1994, 669, 97–102 CrossRef CAS.
- P. Rizzarelli and S. Carroccio, Anal. Chim. Acta, 2014, 808, 18–43 CrossRef CAS PubMed.
- V. P. Sica, K. L. Krivos, D. E. Kiehl, C. J. Pulliam, I. D. Henry and T. R. Baker, Mass Spectrom. Rev., 2020, 39, 212–226 CrossRef CAS PubMed.
- J. P. da Costa, A. Avellan, C. Mouneyrac, A. Duarte and T. Rocha-Santos, TrAC, Trends Anal. Chem., 2023, 158, 116898 CrossRef.
- N. Riboni, F. Bianchi, A. Cavazza, M. Piergiovanni, M. Mattarozzi and M. Careri, Separations, 2023, 10, 222 CrossRef CAS.
- B. Gewert, M. Plassmann, O. Sandblom and M. MacLeod, Environ. Sci. Technol. Lett., 2018, 5, 272–276 CrossRef CAS.
- M. Aznar, S. Ubeda, N. Dreolin and C. Nerín, J. Chromatogr. A, 2019, 1583, 1–8 CrossRef CAS PubMed.
- L. Wang, Y. W. Peng, Y. L. Xu, J. J. Zhang, T. Zhang, M. Q. Yan and H. W. Sun, Environ. Sci. Technol., 2022, 56, 13029–13035 CrossRef CAS PubMed.
- P. F. Wu, X. Y. Wu, Q. Huang, Q. W. Yu, H. B. Jin and M. H. Zhu, Front. Nutr., 2023, 10, 1163823 CrossRef PubMed.
- J. Osorio, M. Aznar, C. Nerin, C. Elliott and O. Chevallier, Anal. Bioanal. Chem., 2022, 414, 1335–1345 CrossRef CAS PubMed.
- C. Wesdemiotis, N. Solak, M. J. Polce, D. E. Dabney, K. Chaicharoen and B. C. Katzenmeyer, Mass Spectrom. Rev., 2011, 30, 523–559 CrossRef CAS PubMed.
- T. D. Moshood, G. Nawanir and F. Mahmud, Crit. Rev. Biotechnol., 2022, 42, 892–912 CrossRef PubMed.
- H. K. Webb, J. Arnott, R. J. Crawford and E. P. Ivanova, Polymers, 2013, 5, 1–18 CrossRef.
- A. Villacorta, L. Rubio, M. Alaraby, M. Lopez-Mesas, V. Fuentes-Cebrian, O. H. Moriones, R. Marcos and A. Hernandez, J. Hazard. Mater., 2022, 439, 129593 CrossRef CAS PubMed.
- I. O. f. Standardization, in ISO 4892-2:2013, ed. I. O. f. Standardization, 2013 Search PubMed.
- M. Bartnikowski, T. R. Dargaville, S. Ivanovski and D. W. Hutmacher, Prog. Polym. Sci., 2019, 96, 1–20 CrossRef CAS.
- W. Limsukon, M. Rubino, M. Rabnawaz, L. T. Lim and R. Auras, Polym. Degrad. Stab., 2023, 217, 110537 CrossRef CAS.
- N. F. Zaaba and M. Jaafar, Polym. Eng. Sci., 2020, 60, 2061–2075 CrossRef CAS.
- S. S. Hosseini, S. Taheri, A. Zadhoush and A. Mehrabani-Zeinabad, J. Appl. Polym. Sci., 2007, 103, 2304–2309 CrossRef CAS.
- G. Sivalingam and G. Madras, Chem. Eng. Sci., 2004, 59, 1577–1587 CrossRef CAS.
- S. J. de Jong, E. R. Arias, D. T. S. Rijkers, C. F. van Nostrum, J. J. Kettenes-van den Bosch and W. E. Hennink, Polymer, 2001, 42, 2795–2802 CrossRef CAS.
- J. De Winter, V. Lemaur, P. Marsal, O. Coulembier, J. Cornil, P. Dubois and P. Gerbaux, J. Am. Soc. Mass Spectrom., 2010, 21, 1159–1168 CrossRef CAS PubMed.
Footnotes |
| † Electronic supplementary information (ESI) available: Fig S1: ESI+ fragmentation spectrum of the [M + NH4]+ for PLA2; Fig. S2 ESI+ fragmentation spectrum of the [M + NA]+ for PLA2 and PLA 7; Table S1: precursor ion scan and neutral loss data pour PLA oligomers; Fig. S3 precursor ion scan and neutral loss chromatograms for PCL; Fig. S4: mass fragmentation of PET4. See DOI: https://doi.org/10.1039/d3en00960b |
| ‡ These two authors contributed equally to the work. |
| This journal is © The Royal Society of Chemistry 2024 |

