 Open Access Article
Creative Commons Attribution 3.0 Unported Licence
Removal of phosphorus and fluorine from wastewater containing PF6−via accelerated decomposition by Al3+ and chemical precipitation for hydrometallurgical recycling of lithium-ion batteries†
Takuto
Miyashita
 *,
Kouji
Yasuda
 * and
Tetsuya
Uda
 *
*
Department of Materials Science and Engineering, Graduate School of Engineering, Kyoto University, Kyoto, 606-8501, Japan. E-mail: miyashita.takuto.68s@st.kyoto-u.ac.jp; yasuda.kouji.3v@kyoto-u.ac.jp; uda.tetsuya.5e@kyoto-u.ac.jp
First published on 2nd April 2024
Abstract
During hydrometallurgical recycling of lithium-ion batteries (LIBs), one important challenge is the efficient treatment of wastewater containing LiPF6 used as a lithium salt in the LIBs. The difficulty of the treatment is attributed to the persistence of PF6− in aqueous solutions. In this study, the accelerated decomposition of PF6− by Al3+ at an elevated temperature and the removal of phosphorus and fluorine by chemical precipitation were attempted. These reactions were analyzed using a pH electrode and fluoride-ion selective electrode, and by a distillation method for total fluorine analysis, ICP-AES, ion chromatography, XRD, and WDS. The results showed that when 10 mM LiPF6 aqueous solution containing 100 mM Al2(SO4)3 was kept at 90 °C for 24 h, more than 90% of the PF6− was decomposed into PO43− and F−. The produced PO43− and F− were coprecipitated with Ca6Al2(SO4)3(OH)12 (ettringite) by adding sufficient Ca(OH)2. The concentrations of the total phosphorus and total fluorine in the supernatant after precipitation were 0.028 mM and 0.77 mM, respectively. Here, the pH after the decomposition of 10 mM PF6− decreases to around 1 due to the formation of H+ during the decomposition, which may be too low for some practical cases. For this problem, the decomposition of PF6− in various pre-mixed solutions of Al2(SO4)3 and Ca(OH)2 was also examined. As a result, when the prepared molar ratio was Al/Ca > 2/3, the decomposition of PF6− proceeded, and the pH decrease accompanying the decomposition was alleviated due to the buffer effect of the Al(OH)3 precipitate.
Water impactThe method for faster decomposition of PF6−, which is persistent in aqueous water, is required for wastewater treatment. The efficient decomposition of PF6− and the removal of phosphorus and fluorine were achieved using Al2(SO4)3 and Ca(OH)2. This method is applicable for treating wastewater exhausted in hydrometallurgical recycling of lithium-ion batteries. |
1. Introduction
The production of lithium-ion batteries (LIBs) is exponentially increasing year by year towards a decarbonized and sustainable society, which simultaneously leads to the generation of a large number of spent LIBs. In order to recover various valuable elements such as lithium (Li), cobalt (Co), and nickel (Ni) contained in LIBs, efficient recycling methods for spent LIBs are required.1–3 The recycling processes of spent LIBs currently in commercial use are mainly classified as pyrometallurgical and hydrometallurgical processes.4–6 In the pyrometallurgical process, spent LIBs are roasted or melted at various temperatures depending on the companies.7,8 One of the advantages of the pyrometallurgical process is the safe treatment of the flammable organic solvents and active Li remaining in the negative electrode by combustion. On the other hand, the necessity of the treatment of the fluorine-containing gases remains a problem. In addition, Li transfers to the slag under some melting conditions, and the recovery cost of Li could be high. The recycling processes of spent LIBs at room temperature (R.T.) including the hydrometallurgical process are considered as a solution to the problems of the pyrometallurgical process. When recycling of spent LIBs is conducted without roasting, treatment of the fluorine-containing gases is not necessary, and Li remains in the positive electrode or electrolyte. The most important challenge is the safe deactivation of spent LIBs containing flammable organic solvents and active Li that may cause ignition. One of the deactivation methods proposed in the past is comminution in water or an inert atmosphere. The first reported method of comminution of spent LIBs in water at R.T., to the author's knowledge, was a patent by Asaka Riken.9 Later, other technologies were reported for comminution in water, for example, by Retriev10 and LiCycle,11 and for comminution without water under a CO2 or Ar atmosphere by Recupyl.12 Our group proposed the submerged comminution in water in an inert atmosphere, especially in lime water (saturated calcium hydroxide (Ca(OH)2) solution), to deactivate the spent LIBs even at a charged state.13 The submerged comminution in water is superior in terms of low ignition risk to comminution in the gas phase, but treatment of wastewater containing electrolytes of LIBs, i.e., organic solvents such as carbonate ester and Li salts such as LiPF6, is required.13–15Phosphorus (P) and fluorine (F) in aquatic ecosystems cause eutrophication and health hazards, respectively, and effluent standards for wastewater are established in many countries.16–18 For example, the concentrations of P and F in industrial wastewater are regulated at 16 ppm and 8 ppm, respectively, in the representative Japanese standards. Wastewater containing P is mainly treated by chemical precipitation, crystallization, and biological treatment.16,17 In the chemical precipitation, P is removed by being coprecipitated with aluminum hydroxide (Al(OH)3) or iron hydroxide (Fe(OH)3) using chlorides or sulfates of aluminum(III) or iron(III). In the crystallization, P is removed as precipitates such as hydroxyapatite (Ca5(PO4)3(OH), reaction (1)) by introducing calcium compounds such as Ca(OH)2.
| 3H3PO4 + 5Ca(OH)2 → Ca5(PO4)3(OH) + 9H2O | (1) |
| 2HF + Ca(OH)2 → CaF2 + 2H2O | (2) |
It is difficult to treat wastewater containing hexafluorophosphate ion (PF6−) produced by the ionization of LiPF6 by chemical precipitation or crystallization because PF6− is persistent in aqueous solution21,22 and does not usually form insoluble precipitates with common metal cations as far as we know. The precipitation with non-metallic compounds and the decomposition into PO43− and F− are candidate treatment methods for wastewater containing PF6−. As a method of the former, pyridine (C5H5N) is reported to form an insoluble precipitate with PF6− in reaction (3); to the best of our knowledge, this is the only method that can precipitate with PF6− in aqueous solution without decomposition.23
| C5H5N + H+ + PF6− → C5H5NHPF6 | (3) |
On the other hand, some methods to decompose PF6− into PO43− and F− were reported according to reaction (4).22,25
| PF6− + 4H2O → PO43− + 6F− + 8H+ | (4) |
In this study, the accelerated decomposition of PF6− by Al3+ was attempted at elevated temperature. Chemical precipitation of PO43− and F− produced by the decomposition of PF6− was carried out by adding Ca(OH)2. As shown in Fig. 1, two types of procedures were investigated. In procedure A (Fig. 1(a)), LiPF6 solutions containing aluminum sulfate (Al2(SO4)3) are heated at 90 °C for 24 h to decompose PF6−, followed by adding Ca(OH)2 to remove the produced PO43− and F−. In procedure B (Fig. 1(b)), LiPF6 solutions containing both Al2(SO4)3 and Ca(OH)2 at various prepared concentrations are heated at 90 °C for 24 h to determine the best conditions for treating PF6−. The supernatants and precipitates of the respective samples are analyzed by various methods. The advantages and disadvantages of procedures A and B are discussed.
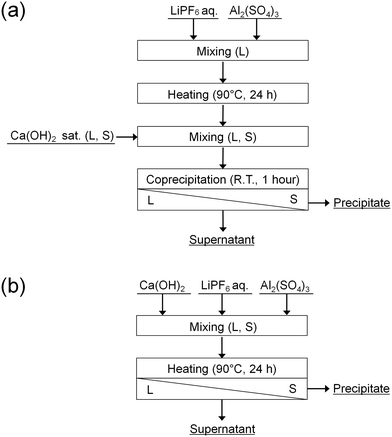 | ||
| Fig. 1 Procedures (a) A and (b) B for the decomposition of PF6− and chemical precipitation of PO43− and F−. | ||
2. Methods
2.1. Experimental procedures
![[thin space (1/6-em)]](https://www.rsc.org/images/entities/char_2009.gif) :
:![[thin space (1/6-em)]](https://www.rsc.org/images/entities/char_2009.gif) 1. The mixed solution was placed at R.T. for 1 h. Then, the supernatant and precipitate were separated by centrifugation, and the precipitate was dried under vacuum at R.T. The removal percentages of P and F were calculated according to eqn (5).
1. The mixed solution was placed at R.T. for 1 h. Then, the supernatant and precipitate were separated by centrifugation, and the precipitate was dried under vacuum at R.T. The removal percentages of P and F were calculated according to eqn (5). | (5) |
The pH and concentrations of the total P and total F in the supernatant were measured. The precipitate was subjected to phase identification by X-ray diffraction (XRD) and elemental analysis by wavelength dispersive spectroscopy (WDS).
2.2. Analysis
![[thin space (1/6-em)]](https://www.rsc.org/images/entities/char_2009.gif) :
:![[thin space (1/6-em)]](https://www.rsc.org/images/entities/char_2009.gif) 1 volume ratio. Two types of TISAB solutions were prepared following American Society for Testing and Materials (ASTM) D1179 method B. TISAB 1 was prepared by dissolving 57 mL acetic acid (Nacalai Tesque, Inc., GR), 58 g NaCl (Nacalai Tesque, Inc., GR), and 0.3 g trisodium citrate dihydrate (Kanto Chemical Co., Inc., GR) in DI water to a volume of 1 L, and used for the sample solutions without Al3+. TISAB 2 was prepared by dissolving 84 mL HCl solution, 242 g tris(hydroxymethyl)aminomethane (Nacalai Tesque, Inc., GR), and 230 g sodium (+)-tartrate dihydrate (Fujifilm Wako Pure Chemical Corporation., GR) in DI water to a volume of 1 L, and used for the sample solutions containing Al3+ to mitigate the interfering effect of Al3+. As a preliminary test, sample solutions dissolving Al2(SO4)3 and NaF were mixed with TISAB 1 or 2 solution and measured with a fluoride-ion selective electrode (Table S1†). The results showed that the interfering effect of Al3+ was almost negligible in TISAB 2 when the Al3+ concentration was below 10 mM. Therefore, the sample solutions were diluted with DI water before the measurements so that the concentration of Al3+ was less than 10 mM.
1 volume ratio. Two types of TISAB solutions were prepared following American Society for Testing and Materials (ASTM) D1179 method B. TISAB 1 was prepared by dissolving 57 mL acetic acid (Nacalai Tesque, Inc., GR), 58 g NaCl (Nacalai Tesque, Inc., GR), and 0.3 g trisodium citrate dihydrate (Kanto Chemical Co., Inc., GR) in DI water to a volume of 1 L, and used for the sample solutions without Al3+. TISAB 2 was prepared by dissolving 84 mL HCl solution, 242 g tris(hydroxymethyl)aminomethane (Nacalai Tesque, Inc., GR), and 230 g sodium (+)-tartrate dihydrate (Fujifilm Wako Pure Chemical Corporation., GR) in DI water to a volume of 1 L, and used for the sample solutions containing Al3+ to mitigate the interfering effect of Al3+. As a preliminary test, sample solutions dissolving Al2(SO4)3 and NaF were mixed with TISAB 1 or 2 solution and measured with a fluoride-ion selective electrode (Table S1†). The results showed that the interfering effect of Al3+ was almost negligible in TISAB 2 when the Al3+ concentration was below 10 mM. Therefore, the sample solutions were diluted with DI water before the measurements so that the concentration of Al3+ was less than 10 mM.
3. Results
3.1. Decomposition of PF6− in aqueous solution under various conditions
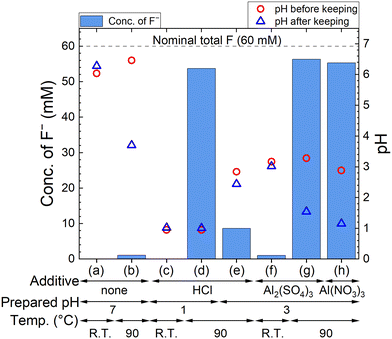
The F− concentration indicates the decomposition progress of PF6−. The measured concentrations of F− and pH are shown in Fig. 2, where 60 mM F− corresponds to the complete decomposition reaction of 10 mM LiPF6. The F− concentration in each sample kept at R.T. is only less than 2 mM, but 54–56 mM F− are detected for sample solutions kept at 90 °C in HCl solution with pH 1, 100 mM Al2(SO4)3 solution, and 100 mM Al(NO3)3 solution. On the other hand, about 10 mM F− is detected in HCl solution with pH 3, which is approximately equal to the pH in 100 mM Al2(SO4)3 or 100 mM Al(NO3)3 solution before keeping. These results suggest that not only H+ but also Al3+ accelerate the decomposition of PF6− at elevated temperatures. In Al2(SO4)3 and Al(NO3)3 solutions, pH changes from around 3 to 1 are observed due to the formation of H+ according to reaction (4).3.2. Removal of P and F by adding Ca(OH)2 after decomposition of PF6− by Al3+ (procedure A)
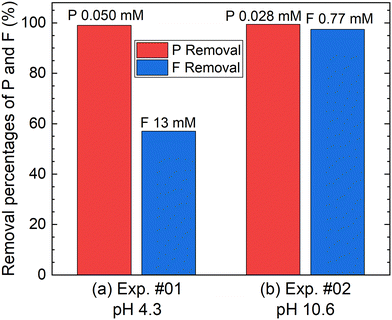
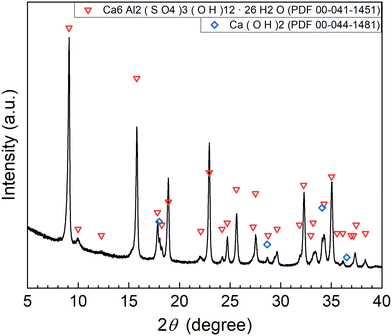
According to procedure A, the removal of P and F was examined by adding the saturated Ca(OH)2 slurry after the decomposition of PF6− in Al2(SO4)3 solution at 90 °C for 24 h. The removal percentages of P and F at 1 h after adding Ca(OH)2 are shown in Fig. 3. In Exp. #01, the pH after adding 150 mM of Ca(OH)2 is 4.3, and the removal percentages are 99% for P and 57% for F. On the other hand, the pH after adding 400 mM of Ca(OH)2 is 10.6 in Exp. #02, and the removal percentages reach higher than 97% both for P and F. The removal percentages of P and F are enough or close to achieve the Japanese industrial effluent standards; the standards of 16 ppm and 8 ppm correspond to 0.516 mM for P and 0.421 mM for F, respectively.The XRD pattern of the precipitate obtained in Exp. #02 is shown in Fig. 4. Strong peaks of Ca6Al2(SO4)3(OH)12·26H2O (ettringite) and weak peaks of Ca(OH)2 are identified. The formation of ettringite is expected according to reaction (6).
| Al2(SO4)3 + 6Ca(OH)2 → Ca6Al2(SO4)3(OH)12 | (6) |
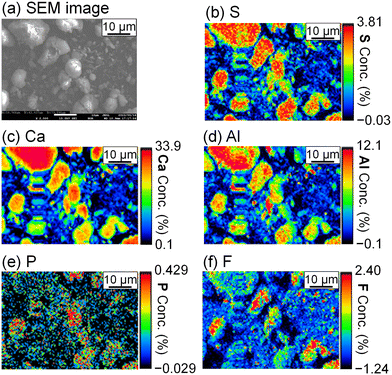
To evaluate the formation of a compound containing P or F, the precipitate was analyzed by FE-EPMA and WDS. The obtained scanning electron microscope (SEM) image and elemental distribution mappings are shown in Fig. 5. Sulfur, Ca, and Al coexist in the same grains, and they are expected to be ettringite. P and F are also observed in the ettringite, and PO43− and F− are suggested to be coprecipitated with ettringite.
3.3. Removal of P and F via decomposition of PF6− in Al2(SO4)3 + Ca(OH)2 solutions (procedure B)
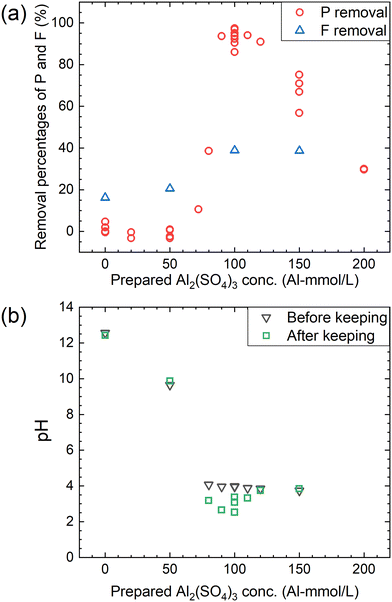
According to procedure B, the decomposition of PF6− and the removal percentages of P and F were examined in Ca(OH)2 + Al2(SO4)3 solutions. The removal percentages of P and F in the supernatant kept at 90 °C for 24 h are shown in Fig. 6(a) and the pH levels before and after keeping are shown in Fig. 6(b). The removal percentage of P significantly increases when the Al2(SO4)3 concentration is higher than 70 mM and reaches 85–98% at 100 mM. The removal percentage of F also shows a similar trend, reaching about 40% at 100 mM. As shown in Fig. 6(b), the pH decreases from about 4 to 2.5–3.5 before and after keeping for 24 h at 100 mM. For the representative conditions, the concentrations of the respective anions are shown in Table 1 and the ion chromatograms are shown in Fig. S2.† The precipitates were formed under all conditions. The difference of the total P concentrations calculated from the sum of species by chromatography with those measured by other methods is not significantly high, and the same can be correct for the total F concentrations. Other chemical species containing P or F which are not listed in Table 1 are expected to be therefore almost absent. When the prepared concentration of Al2(SO4)3 is 0 or 50 mM (Exp. #03 and #04), the concentration of PF6− in the supernatant after keeping is 9.6 or 9.0 mM, and only small amounts of other anions containing P or F are detected. On the other hand, at 100–150 mM (Exp. #05 and #06), PF6− is not detected but PO43− and F− are significantly detected with a large decrease in the total P and total F concentrations. In procedure B, Exp. #03 and #04 suggest that PF6− is stable at 0–50 mM, and Exp. #05 and #06 demonstrate that PF6− is decomposed and P and F are precipitated. It is noted that there is no significant pH decrease as observed in procedure A.| Exp. # | Prepared concentration | Measured concentration (mM) | Removal rate (%) | pH | |||||||||||
|---|---|---|---|---|---|---|---|---|---|---|---|---|---|---|---|
| LiPF6 (mM) | Ca(OH)2 (mM) | Al2(SO4)3 (Al mM) | Ion chromatographya | ICPb | Distillationc | ICP | Distillation | Before | After | ||||||
| PF6− | F− | PO43− | PO2F2− | Total P | Total F | Total P | Total F | P | F | ||||||
| a Measured by ion chromatography. b Measured by ICP-AES. c Measured by the distillation method. d Below the detection limit. e Below the limit of quantification. f {} means “out of the concentration range in the calibration curve”. | |||||||||||||||
| 03 | 10 | 108 | 0 | 9.6 | 0.42 | n.d.d | <0.057e | 9.6 | 58 | 10 | 50 | 0.0 | 17 | 12.6 | 12.5 |
| 04 | 10 | 108 | 50 | 9.0 | {0.19}f | <0.13e | n.d.d | 9.0 | 54 | 9.9 | 48 | 1.0 | 20 | 9.6 | 10.2 |
| 05 | 10 | 108 | 100 | n.d.d | 43 | 0.58 | n.d.d | 0.58 | 43 | 1.4 | 37 | 86 | 38 | 4.0 | 2.7 |
| 06 | 10 | 108 | 150 | n.d.d | 51 | 2.4 | {0.087}f | 2.4 | 51 | 2.9 | 37 | 71 | 38 | 3.8 | 3.8 |
The XRD patterns of the obtained precipitates are shown in Fig. 7. Depending on the added amount of Al2(SO4)3, Ca(OH)2, ettringite, and/or CaSO4·2H2O (gypsum) are identified. The formation of ettringite and gypsum is expected according to reactions (6) and (7), respectively.
| Al2(SO4)3 + 3Ca(OH)2 → 3CaSO4 + 2Al(OH)3 | (7) |
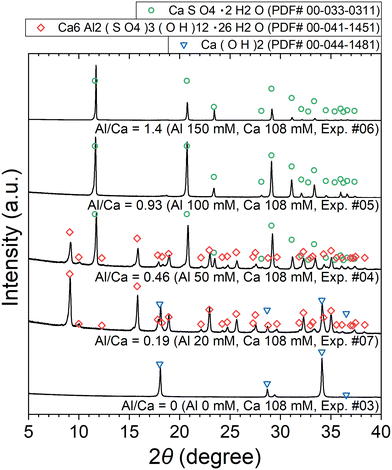 | ||
| Fig. 7 XRD patterns of the precipitates obtained after keeping the 10 mM LiPF6 + 0–150 Al mM Al2(SO4)3 + 108 mM Ca(OH)2 solutions at 90 °C for 24 h (Exp. #03–07) according to procedure B. | ||
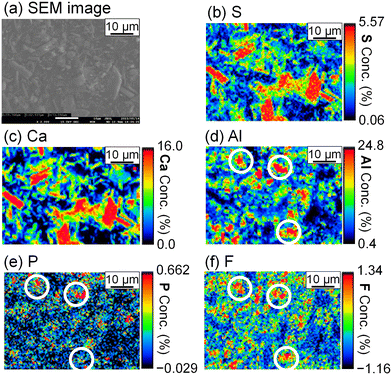
The stoichiometric molar ratios of Al/Ca in reactions (6) and (7) are 1/3 and 2/3, respectively, and the compounds in the precipitate are expected to depend on the molar ratio of Al/Ca at the prepared concentrations. In view of this, ettringite and excess Ca(OH)2 are expected to be in the precipitate for Al/Ca < 1/3, ettringite, gypsum, and Al(OH)3 for 1/3 < Al/Ca < 2/3, and gypsum and Al(OH)3 for Al/Ca > 2/3. In Fig. 7, ettringite and Ca(OH)2 are detected by XRD for Al/Ca = 0.19 (Exp. #07), ettringite and gypsum for Al/Ca = 0.46 (Exp. #04), and only gypsum for Al/Ca = 0.93 (Exp. #05) and 1.4 (Exp. #06); the compounds are detected as expected from the stoichiometric ratios of Al/Ca in reactions (6) and (7) except for Al(OH)3. In procedure B, the removal percentages of P and F are maximum (86% for P and 38% for F) when Al/Ca = 0.93 (Exp. #05). To evaluate the formation of a compound containing P and F, SEM and WDS were conducted for the precipitate obtained in Exp. #05 and the results are shown in Fig. 8. Only gypsum is detected by XRD, and the grains where S and Ca coexist are expected to be gypsum. The Al grains independently distributed are also observed and may be Al(OH)3 in amorphous form. Here, P and F are observed in the amorphous Al(OH)3, suggesting that PO43− and F− are coprecipitated with amorphous Al(OH)3.
The measured concentrations of the total Al in the supernatants of each sample kept at 90 °C for 24 h according to procedure B are shown in Fig. 9. The total Al concentration is below the detection limit at Al/Ca < 2/3, but it increases at Al/Ca > 2/3. Excess Al3+ for reaction (7) is present in the supernatant when Al/Ca is greater than the stoichiometric molar ratio in reaction (7), 2/3, and the decomposition of PF6− is expected to proceed due to the excess Al3+ (Exp. #05 and #06).
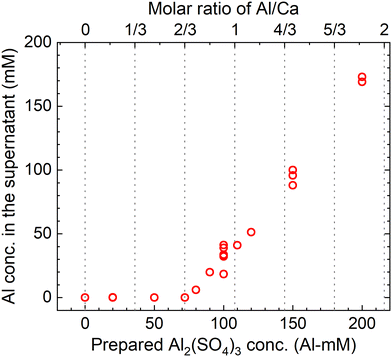 | ||
| Fig. 9 Measured concentrations of the total Al in the supernatant after keeping the 10 mM LiPF6 + 0–200 Al mM Al2(SO4)3 + 108 mM Ca(OH)2 solutions at 90 °C for 24 h according to procedure B. | ||
4. Discussion
4.1. Comparison of procedures A and B
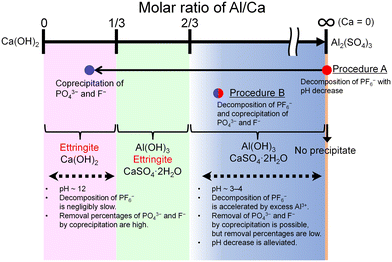
The features of the reactions in procedures A and B are schematically illustrated in Fig. 10. The progress of the decomposition of PF6− and the coprecipitation with PO43− and F− depends on the molar ratio of Al/Ca at the prepared concentration of Ca(OH)2 and Al2(SO4)3. The decomposition of PF6− is accelerated by Al3+ where Ca = 0 (procedure A) or Al/Ca is greater than 2/3 (procedure B). In procedure A, Exp. #02 showed that the addition of Ca(OH)2 at the molar ratio of Al/Ca = 0.25 leads to the precipitation removal of PO43− and F−. The molar ratio of Al/Ca = 0.25 corresponds to the area of Al/Ca < 1/3, where ettringite is formed with excess Ca(OH)2 at pH 12. In procedure B, some PO43− and F− produced by the decomposition are coprecipitated with Al(OH)3 at Al/Ca > 2/3 without additional Ca(OH)2.Here, Exp. #02 showed that the removal percentages of P and F were higher than 97% in procedure A, but in procedure B, Exp. #05 showed that the removal percentages were only 86% for P and 38% for F. It is noted that the molar ratios of Al/Ca in Exp. #02 and #05 are 0.25 and 0.93, respectively. Experimental results show that the removal percentages of P and F are expected to depend on the molar ratio of Al/Ca. Higher removal percentages of P and F are achieved by adding sufficient Ca(OH)2 after finishing the decomposition in procedure B so that the molar ratio of Al/Ca shifts from Al/Ca > 2/3 to Al/Ca < 1/3, as well as in procedure A.
It is better for practical operation at high temperature to avoid strong acid conditions such as pH = 1 or less, but the pH decreases due to H+ produced during the decomposition of PF6−. For the decomposition of 1 mol PF6−, 8 mol H+ is produced according to reaction (4). The experimental results in procedure A show that the pH decrease in the decomposition of 10 mM PF6− with 100 mM Al3+ was approximately from 3 to 1 as shown in Fig. 2. In procedure B, on the other hand, the pH decrease accompanying the decomposition is alleviated; for example, the pH decrease in the decomposition of 10 mM PF6− in 100 mM Al2(SO4)3 + 108 mM Ca(OH)2 is only from 4.0 to 2.7 in Table 1. The smaller pH decrease is attributed to Al(OH)3 formed according to reaction (7). The Al(OH)3 precipitate reacts with H+ produced during the decomposition, acting as a buffer to alleviate the pH decrease according to reaction (8).31
Al(OH)3 + 3H+ ⇄ Al3+ + 3H2O Log![[thin space (1/6-em)]](https://www.rsc.org/images/entities/char_2009.gif) K = 8.291 K = 8.291 | (8) |
4.2. Precipitation mechanism of PO43− and F−
The simultaneous chemical precipitation of PO43− and F− was reported in several past studies, and the formed precipitates were Ca5(PO4)3OH (hydroxylapatite) and/or CaF2 (fluorite).32,33 However, PO43− and F− were coprecipitated with ettringite and/or Al(OH)3, and the formation of hydroxylapatite and fluorite was not observed in this study. To clarify the precipitation mechanism of PO43− and F−, the results in this study were also discussed from the view of thermodynamic equilibrium. The equilibrium of dissolving chemical species and precipitation was calculated on PHREEQC version 2 released by the U.S. Geological Survey.34 The precipitates subjected to the calculation are ettringite, gypsum, hydroxylapatite, fluorite, gibbsite, and Ca(OH)2, and the adopted equilibrium constants are shown in Table 2. The equilibrium constant in the PHREEQC database, minteq.v4.dat.,31 was used. Only for the dissolution equilibrium constant of ettringite, the value reported by Perkins et al.35 was adopted. In this study, Al(OH)3 was formed as an amorphous form, but the equilibrium constant of gibbsite, the most stable species in the database, was used in the calculation. The definition of PF6− is not given in minteq.v4.dat., and it is newly defined as a monovalent anion that does not react with other chemical species. The input concentrations are shown in Table 3. Condition A shown in Table 3 corresponds to procedure A shown in Fig. 1(a), in which a solution containing Al2(SO4)3 and totally decomposed LiPF6 is mixed with Ca(OH)2 solution at each concentration. Condition B corresponds to procedure B shown in Fig. 1(b), i.e., a solution containing a fixed amount of LiPF6 and Ca(OH)2, and Al2(SO4)3 at each concentration. As a simplified condition of the experimental results of this study, condition B used here is that PF6− is not decomposed at all for Al/Ca < 2/3 and is decomposed completely for Al/Ca > 2/3. The full text of the input data is summarized in the ESI.†| Precipitate names | Formula | Reactions | Log![[thin space (1/6-em)]](https://www.rsc.org/images/entities/char_2009.gif) K K |
Ref. |
|---|---|---|---|---|
| Ettringite | Ca6Al2(OH)12(SO4)3·26H2O | Ca6Al2(OH)12(SO4)3·26H2O = 6Ca2+ + 2Al(OH)4− + 3SO42− + 4OH− + 26H2O | −44.9 | Perkins et al.35 |
| Gypsum | CaSO4·2H2O | CaSO4·2H2O = Ca2+ + SO42− + 2H2O | −4.61 | minteq.v4.dat31 |
| Hydroxylapatite | Ca5(PO4)3OH | Ca5(PO4)3OH + H+ = 5Ca2+ + 3PO43− + H2O | −44.333 | minteq.v4.dat |
| Fluorite | CaF2 | CaF2 = Ca2+ + 2F− | −10.5 | minteq.v4.dat |
| Gibbsite | Al(OH)3 | Al(OH)3 + 3H+ = Al3+ + 3H2O | 8.291 | minteq.v4.dat |
| Portlandite | Ca(OH)2 | Ca(OH)2 + 2H+ = Ca2+ + 2H2O | 22.804 | minteq.v4.dat |
| Chemical species | Input value of concentrations | |
|---|---|---|
| Condition A | Condition B | |
| Ca(OH)2 | From 0 mM to 250 mM in 500 steps | 108 mM |
| Al2(SO4)3 | 50 Al mM | From 0 Al mM to 200 Al mM in 500 steps |
| Li+ | 5 mM | 10 mM |
| PF6− | 0 mM | 10 mM for Al/Ca < 2/3 |
| 0 mM for Al/Ca > 2/3 | ||
| PO43− | 5 mM | 0 mM for Al/Ca < 2/3 |
| 10 mM for Al/Ca > 2/3 | ||
| F− | 30 mM | 0 mM for Al/Ca < 2/3 |
| 60 mM for Al/Ca > 2/3 | ||
The molar amounts of precipitates equilibrated for each concentration are shown in Fig. 11. The graphs shown in Fig. 11(a) and (b) show the results for conditions A and B, respectively. Under condition A, gypsum, gibbsite, and hydroxylapatite are formed corresponding to Exp. #01, and ettringite, fluorite, Ca(OH)2, and hydroxylapatite to Exp. #02, as shown in Fig. 11(a). On the other hand, the experimental results indicated that neither fluorite nor hydroxylapatite was observed by the analysis of XRD (Fig. 4), and WDS (Fig. 5) analysis showed that P and F are coprecipitated with ettringite. The difference between the calculation and experiment results is possibly due to the ion exchange ability of ettringite. The ion exchange behavior of SO42− in ettringite with other anions in aqueous solutions such as PO43− or F− was reported.36,37 The ion exchange reaction may be superior in terms of thermodynamics or kinetics to the formation of fluorite and/or hydroxylapatite.
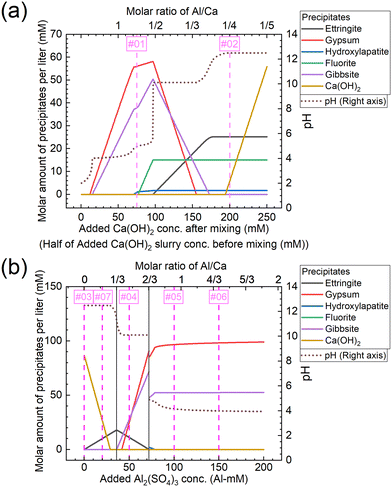 | ||
| Fig. 11 Molar amounts of precipitates equilibrated for each concentration of (a) added Ca(OH)2 under condition A and (b) added Al2(SO4)3 under condition B shown in Table 3. The numbers #0x (x = 1–7) in the graph correspond to the same conditions as Exp. #0x. | ||
Under condition B, Ca(OH)2 is formed corresponding to Exp. #03, ettringite and Ca(OH)2 to Exp. #07, gypsum, gibbsite, and ettringite to Exp. #04, and gypsum and gibbsite to Exp. #05 and 06, as shown in Fig. 11(b). These results are consistent with the experimental results in section 3.3, except for the coprecipitation of PO43− and F− with Al(OH)3. The coprecipitation of PO43− and F− in this study was expected to proceed by surface adsorption on formed Al(OH)3, as these anions are reported to precipitate by surface adsorption on Al(OH)3.38–40
5. Conclusion
In this study, the decomposition of PF6− in aqueous solution was demonstrated to be accelerated when Al3+ was contained in the solution at an elevated temperature. The decomposition of PF6− is negligibly slow when the solution contained no additive or the solution temperature was room temperature, but it was accelerated when the solution at pH 1 or containing 100 mM Al3+ at pH 3 was kept at 90 °C for 24 h. In procedure A, after PF6− was decomposed by Al3+, the produced PO43− and F− were removed from the precipitate by adding sufficient Ca(OH)2 and the removal percentages of P and F were higher than 97%. The precipitate was ettringite, and PO43− and F− were coprecipitated with it. The decomposition of PF6− was accompanied by a pH decrease due to the formation of H+. In procedure B, PF6− was decomposed in pre-mixed solutions of Al2(SO4)3 and Ca(OH)2 at the prepared molar ratio of Al/Ca > 2/3, and the pH decrease during the decomposition of PF6− was alleviated. The alleviation of the pH decrease is expected to be due to the buffer effect of the Al(OH)3 precipitate formed by the reaction of Al2(SO4)3 and Ca(OH)2. The produced PO43− and F− were coprecipitated with Al(OH)3, but the removal percentages were only 86% for P and 38% for F. For higher removal percentages of P and F, the addition of sufficient Ca(OH)2 is expected to be required after the decomposition.Author contributions
All authors conceived the ideas. T. M. contributed to the execution of the experiments, wrote the manuscript, and performed the analysis. All authors reviewed the manuscript.Conflicts of interest
There are no conflicts to declare.Acknowledgements
This work was financially supported by the Adaptable and Seamless Technology transfer Program through Target-driven R&D (A-STEP), Grant Number JPMJTR20TF from Japan Science and Technology Agency (JST), and the establishment of university fellowships towards the creation of science technology innovation, Grant Number JPMJFS2123 from JST. This work was conducted as a collaboration research of the Laboratory of Design of Sustainable Materials and Processing and the Laboratory of Non-ferrous Extractive Metallurgy, Department of Materials Science and Engineering, Graduate School of Engineering, Kyoto University. The Laboratory of Non-ferrous Extractive Metallurgy is an endowed chair by Mitsubishi Material Corp. We would like to acknowledge Dr. Akihiro Kishimoto, Dr. Takumi Yasuda at Kyoto University, and Prof. Takashi Nakamura at Tohoku University for fruitful discussion.Notes and references
- Y. Tao, Z. Wang, B. Wu, Y. Tang and S. Evans, Environmental life cycle assessment of recycling technologies for ternary lithium-ion batteries, J. Cleaner Prod., 2023, 389, 136008 CrossRef
.
- C. H. Illa Font, H. V. Siqueira, J. E. Machado Neto, J. L. F. D. Santos, S. L. Stevan, A. Converti and F. C. Corrêa, Second life of lithium-ion batteries of electric vehicles: A short review and perspectives, Energies, 2023, 16, 953 CrossRef
.
- F. Maisel, C. Neef, F. Marscheider-Weidemann and N. F. Nissen, A forecast on future raw material demand and recycling potential of lithium-ion batteries in electric vehicles, Resour., Conserv. Recycl., 2023, 192, 106920 CrossRef CAS
.
- J. Neumann, M. Petranikova, M. Meeus, J. D. Gamarra, R. Younesi, M. Winter and S. Nowak, Recycling of lithium-ion batteries—Current state of the art, circular economy, and next generation recycling, Adv. Energy Mater., 2022, 12, 2102917 CrossRef CAS
.
- R. Sommerville, J. Shaw-Stewart, V. Goodship, N. Rowson and E. Kendrick, A review of physical processes used in the safe recycling of lithium ion batteries, Sustainable Mater. Technol., 2020, 25, e00197 CrossRef CAS
.
- H. Pinegar and Y. R. Smith, Recycling of end-of-life lithium ion batteries, Part I: Commercial processes, J. Sustain. Metall., 2019, 5, 402–416 CrossRef
.
-
D. Cheret and S. Santen, US Pat., US7169206B2, 2007 Search PubMed
.
-
Y. Yamaguchi, JP Pat., JP5657730B2, 2015 Search PubMed
.
-
M. Kudo and S. Shimizu, JP Pat., JP3069306B2, 2000 Search PubMed
.
-
W. N. Smith and S. Swoffer, US Pat., US8616475B1, 2013 Search PubMed
.
-
A. Kochhar and T. G. Johnston, US Pat., US10919046B2, 2021 Search PubMed
.
-
F. Tedjar and J.-C. Foudraz, US Pat., US7820317B2, 2010 Search PubMed
.
- T. Uda, A. Kishimoto, K. Yasuda and Y. Taninouchi, Submerged comminution of lithium-ion batteries in water in inert atmosphere for safe recycling, Energy Adv., 2022, 1, 935–940 RSC
.
- T. Fujita, H. Chen, K. Wang, C. He, Y. Wang, G. Dodbiba and Y. Wei, Reduction, reuse and recycle of spent Li-ion batteries for automobiles: A review, Int. J. Miner., Metall. Mater., 2021, 28, 179–192 CrossRef CAS
.
- E. Mossali, N. Picone, L. Gentilini, O. Rodrìguez, J. M. Pérez and M. Colledani, Lithium-ion batteries towards circular economy: A literature review of opportunities and issues of recycling treatments, J. Environ. Manage., 2020, 264, 110500 CrossRef PubMed
.
- J. T. Bunce, E. Ndam, I. D. Ofiteru, A. Moore and D. W. Graham, A review of phosphorus removal technologies and their applicability to small-scale domestic wastewater treatment systems, Front. Environ. Sci., 2018, 6, 8 CrossRef
.
- G. Morse, S. Brett, J. Guy and J. Lester, Review: Phosphorus removal and recovery technologies, Sci. Total Environ., 1998, 212, 69–81 CrossRef CAS
.
- V. Khatibikamal, A. Torabian, F. Janpoor and G. Hoshyaripour, Fluoride removal from industrial wastewater using electrocoagulation and its adsorption kinetics, J. Hazard. Mater., 2010, 179, 276–280 CrossRef CAS PubMed
.
- A. Bhatnagar, E. Kumar and M. Sillanpää, Fluoride removal from water by adsorption—A review, Chem. Eng. J., 2011, 171, 811–840 CrossRef CAS
.
- C. F. Z. Lacson, M.-C. Lu and Y.-H. Huang, Fluoride-containing water: A global perspective and a pursuit to sustainable water defluoridation management – An overview, J. Cleaner Prod., 2021, 280, 124236 CrossRef CAS
.
- K. Tasaki, K. Kanda, S. Nakamura and M. Ue, Decomposition of LiPF6 and stability of PF5 in Li-ion battery electrolytes. Density functional theory and molecular dynamics studies, J. Electrochem. Soc., 2003, 150, A1628–A1636 CrossRef CAS
.
- M. Stich, M. Göttlinger, M. Kurniawan, U. Schmidt and A. Bund, Hydrolysis of LiPF6 in carbonate-based electrolytes for lithium-ion batteries and in aqueous media, J. Phys. Chem. C, 2018, 122, 8836–8842 CrossRef CAS
.
-
B. Emmanuel and L. Richard, WO Pat., WO2016012941A1, 2016 Search PubMed
.
- O. A. Zalat and M. A. Elsayed, A study on microwave removal of pyridine from wastewater, J. Environ. Chem. Eng., 2013, 1, 137–143 CrossRef CAS
.
- K. Kim, I. Park, S.-Y. Ha, Y. Kim, M.-H. Woo, M.-H. Jeong, W. C. Shin, M. Ue, S. Y. Hong and N.-S. Choi, Understanding the thermal instability of fluoroethylene carbonate in LiPF6-based electrolytes for lithium ion batteries, Electrochim. Acta, 2017, 225, 358–368 CrossRef CAS
.
-
W. N. Smith and S. Swoffer, WO Pat., WO2013054875, 2013 Search PubMed
.
-
H. Kikuyama, T. Fukutome and M. Miyashita, US Pat., US6666973, 2003 Search PubMed
.
-
Y. Mochida, JP Pat., JP1994170380, 1994 Search PubMed
.
- J. Brosheer, F. Lenfesty and K. Elmore, Vapor Pressure of Hydrofluoric Acid Solutions, Ind. Eng. Chem., 1947, 39, 423–427 CrossRef CAS
.
- H. R. Clark and M. M. Jones, Ligand substitution catalysis via hard acid-hard base interaction, J. Am. Chem. Soc., 1970, 92, 816–822 CrossRef CAS
.
-
D. Allison, D. S. Brown and K. J. Novo-Gradac, MINTEQA2/PRODEFA2, a Geochemical assessment model for environmental systems: Version 3.0 user's manual, Environmental Research Laboratory, Office of Research and Development, U.S. Environmental Protection Agency, US, 1991 Search PubMed
.
- C. F. Z. Lacson, M.-C. Lu and Y.-H. Huang, Calcium-based seeded precipitation for simultaneous removal of fluoride and phosphate: Its optimization using BBD-RSM and defluoridation mechanism, J. Water Proc.engineering, 2022, 47, 102658 CrossRef
.
- H.-J. Ho, M. Takahashi and A. Iizuka, Simultaneous removal of fluoride and phosphate from semiconductor wastewater via chemical precipitation of calcium fluoride and hydroxyapatite using byproduct of recycled aggregate, Chemosphere, 2023, 340, 139875 CrossRef CAS PubMed
.
- PHREEQCE Welcome page, https://wwwbrr.cr.usgs.gov/projects/GWC_coupled/phreeqe/, (accessed January 2024).
- R. B. Perkins and C. D. Palmer, Solubility of ettringite (Ca6[Al(OH)6]2(SO4)3 · 26H2O) at 5–75°C, Geochim. Cosmochim. Acta, 1999, 63(13–14), 1969–1980 CrossRef CAS
.
- Y. Kamimoto, K. Onda, R. I. Ichino, K.-S. Min, K.-H. Kwon and Y.-J. Jung, Removal properties of phosphate with Ettringite, Desalin. Water Treat., 2017, 478–482 CrossRef CAS
.
- A. Iizuka, H.-J. Ho and A. Yamasaki, Removal of fluoride ions from aqueous solution by metaettringite, PLoS One, 2022, 17(3), e0265451 CrossRef CAS PubMed
.
- W. H. Van Riemsdijk and J. Lyklema, Reaction of phosphate with gibbsite (AI(OH)3) beyond the adsorption maximum, J. Colloid Interface Sci., 1980, 76(1), 55–66 CrossRef CAS
.
- S. Gypser, F. Hirsch, A. M. Schleicher and D. Freese, Impact of crystalline and amorphous iron- and aluminum hydroxides on mechanisms of phosphate adsorption and desorption, J. Environ. Sci., 2018, 70, 175–189 CrossRef CAS PubMed
.
- X. Liu, Y. Wang, X. Cui, S. Zhu and J. Cao, Fluoride removal from wastewater by natural and modified gibbsite, J. Chem. Eng. Data, 2021, 66(1), 658–668 CrossRef CAS
.
Footnote |
| † Electronic supplementary information (ESI) available. See DOI: https://doi.org/10.1039/d3ew00854a |
| This journal is © The Royal Society of Chemistry 2024 |

