Design and engineering of an artificial disulfide bond in human cytochrome c to regulate the protein structure and function†
Yan-Yan
Li
a,
Yu
Feng
a,
Lu
Yu
 b,
Shuang-Shuang
Long
*a,
Shu-Qin
Gao
c and
Ying-Wu
Lin
 *ac
*ac
aSchool of Chemistry and Chemical Engineering, University of South China, Hengyang 421001, China. E-mail: sslong@usc.edu.cn; ywlin@usc.edu.cn; Tel: +86 743 8282375
bHigh Magnetic Field Laboratory, Chinese Academy of Sciences, Hefei, Anhui 230031, China
cKey Lab of Protein Structure and Function of Universities in Hunan Province, University of South China, Hengyang 421001, China
First published on 8th April 2024
Abstract
Human cytochrome c (hCyt c) contains a covalently attached heme group with six-coordination (Met/His) and plays vital biological functions, including electron transfer and peroxidase activity by structural alterations, as well as other functions by interactions with partners such as neuroglobin (Ngb). In this study, we designed and engineered an artificial disulfide bond in hCyt c via double mutations (A51C/G77C) which bridges the Ω-loops C and D. The formation of the intramolecular disulfide bond (Cys51–Cys77) was confirmed by mass spectrometry. The molecular modeling study showed that the disulfide bond did not alter the overall structure, and the local structure where Cys51 was located was well folded into an α-helix. Spectroscopic studies were also performed to probe the effects of the disulfide bond on the protein structure, which revealed that the heme coordination of Met80 was likely weakened. Consequently, the rate of ligand binding and the peroxidase activity were enhanced. Meanwhile, the interaction between hCyt c and Ngb was weakened, as suggested by titration studies. These observations indicate that the dynamic properties of Ω-loops C and D may favor the heme coordination and protein–protein interactions by conformational change, which supports the native functions of hCyt c.
Design, System, ApplicationProtein design and engineering is powerful to reveal the structure and function of metalloproteins. Human cytochrome c (hCyt c) contains a covalently attached heme group and plays vital biological functions, including interaction with partners such as neuroglobin (Ngb). In this study, we used hCyt c as a model system and engineered an artificial disulfide bond in the protein via double mutations (A51C/G77C) which bridges the Ω-loops C and D. The structural and functional consequences were investigated using spectroscopic and kinetic studies, as well as titration studies. They revealed that the heme coordination of Met80 was weakened, which resulted in an enhanced rate of ligand binding and peroxidase activity, but weakened interactions with Ngb. These findings contribute to a deeper understanding of the intricate relationship between the dynamic properties of Ω-loops C and D, which supports the native function of hCyt c. The approach of designing an artificial disulfide bond might be generally applied to other metalloproteins to provide insights into their structural and functional relationships. |
1. Introduction
Metalloproteins and metalloenzymes are crucial components of biological systems, performing essential functions such as electron transfer, O2 transport, and catalysis.1–4 One of the most important members of these redox metalloproteins is cytochrome c (Cyt c), which contains one or more heme groups.5 The heme is covalently attached to Cys14 and Cys17 by two thioether bonds, and the heme iron is coordinated by His18 and Met80, making Cyt c a six-coordinate and low-spin metalloprotein. Cyt c is involved in various cellular functions, playing a particularly important role in the intrinsic apoptotic pathway.6 Under apoptotic conditions, Cyt c oxidizes cardiolipin, which is released from the inner mitochondrial membrane into the cytoplasm, initiating the process of cell death.7–10 Thus, the intrinsic peroxidase activity of Cyt c plays a vital role in regulating the early stages of apoptosis. Additionally, studies have revealed that neuroglobin (Ngb) competes with apaf-1 for binding to Cyt c, leading to the formation of the Cyt c–Ngb complex.11,12 This complex acts as a blockade in the apoptotic pathway, protecting mammalian neurons against apoptotic stimuli.13–15The sequence and structure of human cytochrome c (hCyt c) exhibit evolutionary conservation, with a few naturally occurring mutations in humans. Among these mutations, G41S, Y48H, A51V, and I81N are associated with autosomal dominant thrombocytopenia 4 (ref. 16–18) and interaction with Ngb.19 These variants increase the flexibility of Ω-loop C and Ω-loop D, and enhance the intrinsic peroxidase activity that contributes to numerous functions of hCyt c.16–22 Ω-loop C and Ω-loop D are the two least stable regions in Cyt c. The heme propionate group-6 and amino acids such as Thr49 and Thr78 form a hydrogen (H)-bonding network that holds the two loops together, which is crucial for maintaining the Met80–Fe linkage in the natural conformation of Cyt c.23–25 Although many sites in Ω-loop C and Ω-loop D have been studied by mutagenesis individually, there are no reports on the study connecting Ω-loop C and Ω-loop D and the effect as a whole.
Proteins are subjected to a variety of regulatory mechanisms, such as post-translational modifications (PTMs), which can impact their structure and functions.26 One notable approach to modulating the structure and reactivity of heme proteins is the design of novel disulfide bonds.27 Morishima and co-workers constructed a new disulfide bond in myoglobin (Mb) that affected the ligand binding kinetics.28 Similarly, we also constructed a disulfide bond in different locations in Mb, such as Cys21–Cys66, Cys46–Cys49, and Cys46–Cys61, which generated a range of functional heme enzymes.29–31 Moreover, we introduced an artificial disulfide bond (Cys15–Cys120) in Ngb, which improved the stability of the protein.32 These findings emphasize the pivotal role of disulfide bonds in fine-tuning protein properties and provide valuable insights into the dynamic interplay between the protein structure and function.
Inspired by the design of artificial disulfide bonds to regulate the structure and function of heme proteins, we herein introduced a disulfide bond in hCyt c to bridge Ω-loop C and Ω-loop D. We analyzed the X-ray structure of hCyt c (PDB code 3ZCF33) and chose to construct the A51C/G77C hCyt c mutant by protein engineering. The formation of the Cys51–Cys77 disulfide bond was confirmed by mass spectrometry. In addition, we extended to comprehensive assessments of the impact of the artificial disulfide bond on both the structure and function of hCyt c, including electron paramagnetic resonance (EPR) spectroscopy, sodium azide competitive coordination experiments, kinetic UV-vis studies, and isothermal titration calorimetry (ITC) studies. Comparative analyses with the wild-type (WT) hCyt c elucidated that the incorporation of a disulfide bond exerted a profound influence on both the structural conformation and functional dynamics of hCyt c. These findings contribute to a deeper understanding of the intricate relationship between the dynamic properties of Ω-loops C and D, which confers the structural dynamics and biological activity for hCyt c.
2. Results and discussion
2.1 Rational design of an artificial disulfide bond in hCyt c
To design an artificial disulfide bond in hCyt c connecting Ω-loops C and D, we analyzed the X-ray structure of hCyt c, with the help of the web-server Yosshi, which was developed for disulfide engineering by bioinformatics analysis of diverse protein families.34 By comparing the sequences and structures of homologs, Yosshi assists in selecting the most promising hot-spots for disulfide engineering to improve the stability of proteins/enzymes or modulate their functions.35,36 Guided by Yosshi, we chose several amino acids in Ω-loops C and D with close distances and those with less impact on the protein structure, and replaced them with Cys residues, which generated a new sequence (namely sequence 1, see the Materials and methods section). Then, we made a homologous alignment between sequence 1 and that of WT hCyt c (sequence 2). As shown in Fig. 1A and S1,† amino acids A51–G77, A51–T78, T49–T78, and K55–I75 were potential targets for engineering a disulfide bond between Ω-loops C and D. We noticed that the distance of A51–G77 (5.49 Å) is the shortest of these distances, which is close to that of A51–T78 (5.82 Å). Meanwhile, Thr78 is involved in the formation of an H-bonding network, and the mutation of Thr78 may have a large impact on the protein structure. Therefore, we chose to engineer a disulfide bond between A51 and G77 in hCyt c.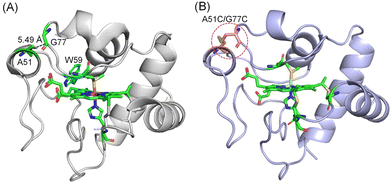 | ||
| Fig. 1 (A) X-ray structure of hCyt c (PDB code 3ZCF33) showing the overall structure. The Ω-loops are shown in different colors. The heme coordination site and A51, G77 are highlighted in green. The distance of A51–G77 is indicated by a dashed line. W59 is also shown (blue) for clarification. (B) The simulated structure of A51C/G77C hCyt c, showing the disulfide bond and the heme coordination site. | ||
To investigate the impact of the formation of the Cys51–Cys77 disulfide bond on the structure of hCyt c, we simulated the protein structure of the A51C/G77C hCyt c mutant. The structure revealed that the introduction of Cys51 and Cys77 in Ω-loop C and Ω-loop D is suitable for the formation of an artificial disulfide bond, which exerts negligible influence on the overall protein structure (Fig. 1B). The local structure surrounding Cys51 underwent a conformational change and adopted a well-formed α-helix configuration. A structural comparison further revealed that the formation of disulfide bond Cys51–Cys77 may induce conformational changes for the nearby amino acids such as Lys72, Lys79, Ile81 and Val83, especially for Lys72, as well as the axial ligand Met80 (Fig. S2†). As predicted by a previous simulation study,19 these residues (Lys72, Lys79, Ile81 and Val83) are located at the binding interface of Ngb–Cyt c. Therefore, the formation of the disulfide bond Cys51–Cys77 may affect the protein–protein interactions. These results suggested that computer-aided design of an artificial disulfide bond in Cyt c is possible and the introduction of such a disulfide bond may impact the structural and dynamic properties of Cyt c.
2.2 Spectroscopic studies of A51C/G77C hCyt c.
Encouraged by the simulation results, we constructed the double mutant of A51C/G77C hCyt c and purified it from E. coli cells with high purity (Fig. S3A†). We then conducted mass spectrometry (MS) studies using electrospray ionization (ESI) to investigate the potential formation of an intramolecular disulfide bond in A51C/G77C hCyt c, with WT hCyt c as a control. The spectra showed a molecular weight of 12![[thin space (1/6-em)]](https://www.rsc.org/images/entities/char_2009.gif) 234 Da and 12
234 Da and 12![[thin space (1/6-em)]](https://www.rsc.org/images/entities/char_2009.gif) 310 Da, respectively, which were consistent with the calculated mass in the absence and the presence of a disulfide bond for WT and A51C/G77C hCyt c, respectively (Fig. S3B and C†). To detect the disulfide bond, we used TCEP (tris(2-carboxyethyl)phosphine) as a reducing agent to cleave the disulfide bond by forming two free Cys residues. The treatment of A51C/G77C hCyt c with TCEP resulted in an increase of 2 Da (12
310 Da, respectively, which were consistent with the calculated mass in the absence and the presence of a disulfide bond for WT and A51C/G77C hCyt c, respectively (Fig. S3B and C†). To detect the disulfide bond, we used TCEP (tris(2-carboxyethyl)phosphine) as a reducing agent to cleave the disulfide bond by forming two free Cys residues. The treatment of A51C/G77C hCyt c with TCEP resulted in an increase of 2 Da (12![[thin space (1/6-em)]](https://www.rsc.org/images/entities/char_2009.gif) 312 Da), which indicates the formation of a disulfide bond in A51C/G77C hCyt c (Fig. S1D†).
312 Da), which indicates the formation of a disulfide bond in A51C/G77C hCyt c (Fig. S1D†).
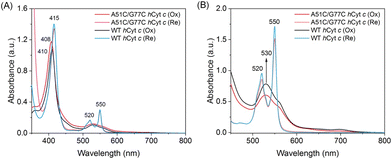
Heme proteins exhibit absorption bands, which depend on the type of heme group and its coordination state. C-type cytochromes exhibit multiple absorptions in the visible region. The most significant absorption is located at a wavelength of around 410 nm (Soret peak), and other weak absorptions are located at wavelengths of 520–550 nm. These absorptions are closely related to the electronic transition process in the heme proteins.37 The UV-vis spectra of both A51C/G77C and WT hCyt c showed the typical absorptions of c-type cytochromes (Fig. 2A). The Soret band of A51C/G77C hCyt c in the ferric state exhibited a blue-shift from 410 nm to 408 nm compared to that of WT hCyt c (Fig. 2A), suggesting a potential influence of the intramolecular disulfide bond on the heme moiety. Meanwhile, other absorptions in the spectra (ferric, 530 nm; ferrous, 415, 520, and 550 nm, Fig. 2) are similar for WT and A51C/G77C hCyt c.
To further assess the impact of the disulfide bond on the secondary structure of hCyt c, we performed circular dichroism (CD) analysis. The far-UV CD spectra of A51C/G77C and WT hCyt c are shown in Fig. 3A, which exhibited the characteristic minima at 208 and 222 nm, indicating that the protein was dominated by the α-helical structure. The observed decrease in ellipticity (θ) values for A51C/G77C hCyt c compared to that of WT suggests a slightly enhanced content of α-helix. The α-helical structure content of A51C/G77C and WT hCyt c was calculated by K2D2 (ref. 38) to be ∼36.4% and ∼31.5%, respectively. This observation was consistent with the computational simulation result, which indicated that the Cys51 substitution may promote localized α-helix formation.
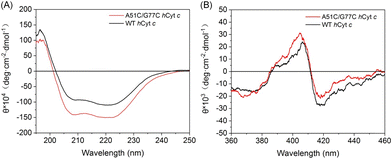 | ||
| Fig. 3 CD spectra of ferric A51C/G77C (red) and WT hCyt c (black) in the (A) far-UV region (10 μM) and (B) visible region (2 μM), respectively, in 2 mM potassium phosphate buffer (pH 7.0). | ||
The near-ultraviolet CD spectrum of Cyt c showed a positive peak at 404 nm and a negative peak at 418 nm (Fig. 3B), which was the characteristic peak of Met80 to heme coordination.39 We found that A51C/G77C hCyt c exhibited a stronger positive peak at 404 nm and a weaker negative peak at 418 nm compared to those of WT hCyt c, indicating that the coordination of Met80 to the heme iron was altered. Overall, these findings suggest that the introduction of a disulfide bond not only increases the α-helix content but also alters the geometric structure/strength of heme coordination states, which may alter the local microenvironment of the heme moiety.
2.3 Global stability of ferric A51C/G77C hCyt c
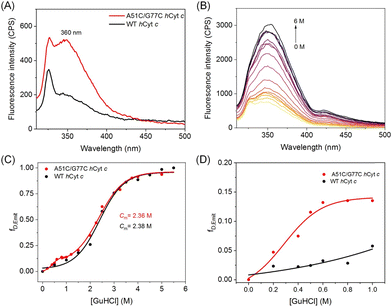
Förster resonance energy transfer (FRET) is a technique used to measure the distance between a donor and an acceptor, which can also be used to investigate structural changes in heme proteins that contain aromatic amino acids such as Trp and Tyr.40 In hCyt c, Trp59 is located near the heme group (as depicted in Fig. 1A), and the proximity between the two leads to a decrease in fluorescence intensity due to FRET from Trp59 (donor) to the heme center (acceptor). Samsri et al. discovered that the proximity of Trp59 to the heme iron significantly decreased the intensity in fluorescence at 360 nm.41 As shown in Fig. 4A, the fluorescence of A51C/G77C hCyt c was ∼2.5 fold higher than that of WT hCyt c. In the native state of WT hCyt c, the fluorescence was quenched due to the effect of FRET. We speculate that the increase in the fluorescence intensity of A51C/G77C hCyt c is due to the introduction of a disulfide bond, which increases the distance between Trp59 and the heme group when the local conformation is disturbed, thus reducing the effect of FRET.To further investigate the denaturation of both A51C/G77C and WT hCyt c, the Trp59 fluorescence was monitored as a spectroscopic parameter indicative of heme–protein interactions. This assessment was conducted by increasing the guanidine hydrochloride (GuHCl) concentrations from 0 to 6 M. As shown in Fig. 4 and S4,† the fluorescence intensity increased with increasing concentration of GuHCl, indicating an increase in the distance between Trp59 and the heme group. The emission intensity at 360 nm was converted to fraction denatured (fD,Emit), and the fluorescence-derived denaturation data were analyzed using the Boltzmann equation. Within error, the midpoint GuHCl concentration for unfolding (Cm) was found to be unchanged for A51C/G77C (Cm = 2.36 M) in comparison with that of WT hCyt c (Cm = 2.38 M) (Fig. 4C). This observation is consistent with the performance of A51V,18 suggesting that the introduction of a disulfide bond of Cys51–Cys77 did not enhance the overall protein stability.
Meanwhile, a multi-state denaturation process was observed for A51C/G77C Cyt c in the unfolding studies, with transitions at both high (1–6 M) and low (0–1 M) GuHCl concentrations (Fig. 4C). Despite the similar denaturation midpoints of A51C/G77C and WT Cyt c (Cm = 2.38 M), the fluorescence emission intensity of A51C/G77C Cyt c was slightly higher than that of WT Cyt c in the presence of 0–1 M GuHCl, indicating slight conformational changes (Fig. 4D). We hypothesize that the introduction of a disulfide bond may facilitate conformational transitions, although the magnitude of this effect was not statistically significant.
2.4 Effects on the local stability imposed by the disulfide bond
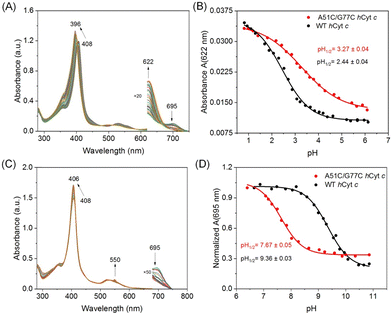
We performed pH perturbation studies under both acidic and alkaline conditions to investigate the impact of the disulfide bond on the local structural stability of hCyt c. It was shown that oxidized Cyt c had five pH-dependent conformational states in the pH range of 0.5 to 12 upon changes in heme axial coordination and/or protein folding.42,43 These states were caused by changes in heme axial coordination and protein folding, and were linked to the intrinsic peroxidase activities of Cyt c. Such conformational transitions were also utilized to explore the local structural dynamics of the heme moiety.44Cyt c undergoes conformational changes at acidic pH, forming state II and state I from state III,45 which can be regulated by residue substitution46 and can serve as a valuable metric for assessing the structural stability of Cyt c. Under acidic conditions, the Soret band of A51C/G77C hCyt c (408 → 396 nm) and WT hCyt c (410 → 396 nm) exhibited a blue shift from 12 nm to 14 nm, respectively (Fig. 5A and S5A†). The plots of the corrected extinction coefficients at 695 nm (Met80 ligation) and 622 nm (high-spin heme) are shown in Fig. 5B and S4B,† respectively. The midpoints of the pH values were determined using the Henderson–Hasselbalch equation (Table 1). The acid titration data revealed an increase in pH1/2 at 622 nm from 2.44 ± 0.04 to 3.27 ± 0.04, and at 695 nm from 2.49 ± 0.04 to 3.03 ± 0.06, respectively, for A51C/G77C hCyt c. The pH1/2 values for A51C/G77C hCyt c were 0.5–0.8 units higher than those of WT hCyt c (Fig. 5B, S5B,† and Table 1). This suggests reduced stability of the native state towards acid-induced unfolding to a high-spin state (622 nm data) for A51C/G77C hCyt c relative to WT hCyt c, implying greater accessibility to the high-spin conformation in the A51C/G77C variant.
| WT | A51C/G77C | ||
|---|---|---|---|
| Acidic unfolding | pH1/2 622nm | 2.44 ± 0.04 | 3.27 ± 0.04 |
| n | 0.67 ± 0.04 | 0.51 ± 0.03 | |
| pH1/2 695nm | 2.49 ± 0.04 | 3.03 ± 0.06 | |
| n | 1.09 ± 0.19 | 0.82 ± 0.08 | |
| Alkaline transition | pKapp | 9.36 ± 0.03 | 7.64 ± 0.05 |
| n | 1.07 ± 0.07 | 1.11 ± 0.13 | |
| Azide binding | k obs (s−1) | 0.0012 ± 6 × 10⁻⁴ | 0.026 ± 1 × 10⁻³ |
The conformational changes from state III to state IV with increasing pH were termed the alkaline transition,43,45 which involves replacing the substitution of the Met80–heme ligand with either Lys73 or Lys79.47 The process was monitored and tracked by observing the absorption of the Fe(III)–S bond at 695 nm, which reveals the transformation of the Met–heme moiety to a Lys–heme moiety. This transition induced a 2–4 nm blue shift of the Soret band, indicative of structural changes of the heme moiety (Fig. 5C and S4C†). Moreover, with increasing pH, a distinct peak emerged at 550 nm, corresponding to the characteristic absorption of the reduced state. This is due to the conformational changes in Cyt c and the dissociation of Met80, facilitating heme exposure and partial reduction. The pH midpoint (pKapp) of the alkaline transition decreased from 9.36 ± 0.03 for WT hCyt c to 7.64 ± 0.05 for A51C/G77C hCyt c (Fig. 5D and Table 1). The results showed that the number of protons linked to the alkaline transition was close to 1 for both WT hCyt c (n = 1.07 ± 0.07) and A51C/G77C hCyt c (n = 1.13 ± 0.13), which is consistent with the typically observed one-proton process for the alkaline transition of hCyt c.
Notably, the introduction of the disulfide bond in A51C/G77C hCyt c resulted in a decrease in pKapp by ∼1.8 units compared to that of WT hCyt c. In contrast, the pKapp values of three natural mutants, G41S (8.5 ± 0.2), Y48H (8.4 ± 0.1), and A51V (8.3 ± 0.1),16–18 with mutations located in the Ω-loop C, showed a decrease of ∼1 unit compared to that of the WT protein (9.44 ± 0.04). The I81N mutation located in the Ω-loop D only decreased by 0.5 units.19 Bowler et al. proposed that the stability of the alkaline state relative to the native state depends on how the particular mutation affects the proportion of independent versus sequential unfolding of the Ω-loop C and Ω-loop D.18 It is believed that the disulfide bond affects the flexibility and tightness of Ω-loops C and D, making A51C/G77C hCyt c more susceptible to conformational changes under alkaline pH conditions, which aligns with the results of GuHCl-induced unfolding studies.
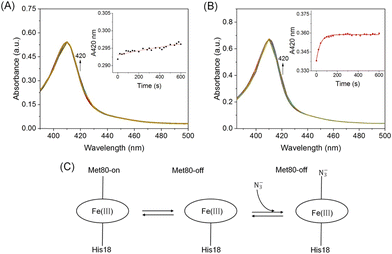
To further test the stability of the Met80-heme ligation, azide ion (NaN3) binding kinetic studies were performed to probe the local dynamics of Ω-loop D (Fig. 6A and B). Cyt c contains a six-coordinated heme that is in equilibrium with a five-coordinated state, which provides an open site for ligand binding upon mixing with NaN3. It may compete with the axial ligand Met80 for binding to the heme iron, as proposed in Fig. 6C. All transients were fitted to a single exponential function yielding the pseudo-first-order rate constants (Fig. 6A and B, inset). As shown in Table 1, A51C/G77C hCyt c (kobs = 0.026 ± 1 × 10⁻³ s−1) reacted with azide ∼21 times faster than the WT protein (kobs = 0.0012 ± 6 × 10⁻⁴ s−1). This increased rate of azide binding to A51C/G77C hCyt c suggests that the introduction of the disulfide bond perturbs the equilibrium between Met80-on (six-coordinated) and Met80-off (five-coordinated) states, leading to an elevated content of the Met80-off state. This result further supports the notion that the high-spin conformation of A51C/G77C hCyt c is more readily accessible, consistent with the results of the alkaline conformation analysis.
2.5 Heme coordination state of ferric A51C/G77C hCyt c
To further probe the effect of the disulfide bond of A51C/G77C hCyt c on the heme micro-environments, especially for the equilibrium between Met80-on (six-coordinated) and Met80-off (five-coordinated) states, we performed EPR studies. The spin states of the ferric heme iron were monitored at 20 K (Fig. 7). At neutral pH, the WT hCyt c heme was coordinated with Met80/His18 in a typical low-spin state (gz = 3.11, gy = 2.18, gx = not detected). In contrast, A51C/G77C hCyt c exhibited both typical low-spin signals (gz = 3.07 and gy = 2.19) and a concomitant high-spin signal (g⊥ = 5.95, Fig. 7), indicating the presence of a fraction of a high-spin species. This high-spin signal was similar to those observed for other five-coordinated heme proteins, such as myoglobin and mutants.48,49 This observation indicates that the disulfide bond in A51C/G77C hCyt c causes perturbation of the equilibrium between Met80-on (six-coordinated) and Met80-off (five-coordinated) states.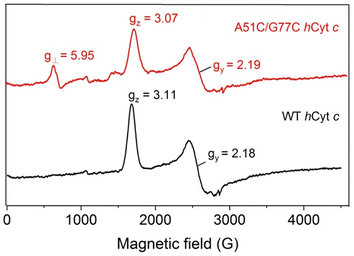 | ||
| Fig. 7 EPR spectra of ferric WT (black) and A51C/G77C (red) hCyt c (0.3 mM), collected at 20 K, 2 mW power and 9.4 GHz. | ||
2.6 Peroxidase activity of A51C/G77C hCyt c
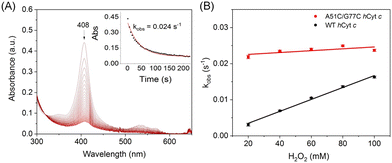
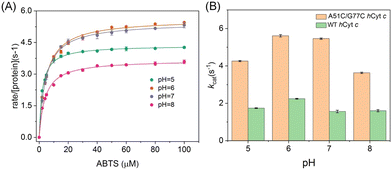
The intrinsic peroxidase activity of Cyt c arises from equilibrium in the ferric heme between the six-coordinated Met80-bound form and a five-coordinated Met80-off form, with the latter being peroxidase active.50–52 According to EPR observation, A51C/G77C hCyt c might exhibit an enhanced peroxidase activity compared to the WT protein. When hCyt c was mixed with hydrogen peroxide (H2O2) without a substrate, it underwent auto-oxidation, causing heme degradation and a decrease in the Soret band (Fig. 8A and S6†). The observed rate constants (kobs) were plotted against the concentrations of H2O2 (Fig. 8B), which showed that A51C/G77C hCyt c degraded 1.6–5 fold faster than WT hCyt c depending on the concentration of H2O2. This evidence supports the notion that A51C/G77C hCyt c is more sensitive to H2O2 compared to the WT protein. Combining alkaline conformational data and EPR data, we inferred that the formation of the disulfide bond in A51C/G77C hCyt c affected the flexibility of Ω-loop C and Ω-loop D. Consequently, this perturbation caused disturbances in the equilibrium between Met80-on (6-coordinated) and Met80-off (5-coordinate) states, leading to an increased abundance of high-spin species, which facilitates the binding of H2O2 into the heme active site.As previously reported, the peroxidase activity of Cyt c was maximized under acidic conditions,53 wherein the protein adopted a non-native structure conducive to enhanced peroxidase activity.54 To quantify the peroxidase activity, 2,2′-azido-3-ethylbenzothiazoline-6-sulfonate (ABTS) was employed as a typical substrate, and the formation of ABTS˙+ was monitored at 660 nm across a pH range of 5–8 (Fig. S7A and S7B†). The Michaelis–Menten plot of the ABTS concentration was generated to calculate the parameters of turnover (kcat) and the Michaelis constant (Km) (Fig. 9A and S7C†). A51C/G77C hCyt c showed significant enhancement in kcat relative to WT hCyt c. Notably, the kcat value of A51C/G77C exhibited a strong relationship with pH values, increasing from 4.36 s−1 at pH 5 to 5.46 s−1 at pH 7 (Fig. 9A and Table 1).
In contrast, WT hCyt c exhibited a more modest variation across the pH range from 5 to 7 (Fig. S5C†). At all pH values, A51C/G77C hCyt c showed significant enhancement in kcat relative to WT hCyt c, with a 2–3.5 fold increase (Fig. 9B and Table 2). The Km values for A51C/G77C hCyt c were relatively unaffected compared to the WT protein. As shown in Table 2, the kcat value of A51C/G77C hCyt c (5.46 ± 0.03) was ∼3.5-fold higher than that of WT hCyt c (1.56 ± 0.01) at pH 7. Comparative analyses with THC4-linked variants of hCyt c, specifically G41S and Y48H, revealed that the mutations induce 3–7 fold increases in the peroxidase activity when tested with ABTS at pH 6.5.17 However, the A51C/G77C hCyt c variant exhibited a remarkable enhancement in the peroxidase activity, particularly at pH 6 and 7. The kcat of A51C/G77C surpassed those of G41S and A51V but fell below that of Y48H,16–18 suggesting the different effects of these mutations on the catalytic efficiencies in the context of peroxidase activity.
| pH | k cat (s−1) | K m (μM) | ||
|---|---|---|---|---|
| A51C/G77C | WT | A51C/G77C | WT | |
| 5 | 4.36 ± 0.031 | 1.73 ± 0.012 | 2.14 ± 0.100 | 1.39 ± 0.088 |
| 6 | 5.61 ± 0.062 | 2.24 ± 0.012 | 4.67 ± 0.254 | 1.59 ± 0.065 |
| 7 | 5.46 ± 0.038 | 1.56 ± 0.016 | 4.46 ± 0.153 | 4.56 ± 0.240 |
| 8 | 3.67 ± 0.036 | 1.60 ± 0.031 | 3.97 ± 0.020 | 2.58 ± 0.129 |
2.7 Interactions between A51C/G77C hCyt c and Ngb
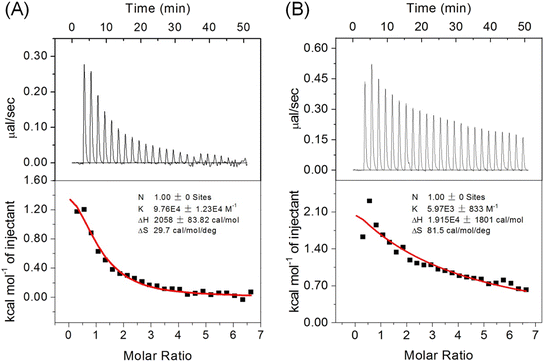
The precise regulation of Cyt c peroxidase activity is vital in neuronal cells, particularly in the apoptotic pathway.6 Ngb has been identified as a significant regulator that forms complexes with hCyt c to prevent the untimely release of hCyt c within cells.11,12 To investigate whether introducing an intramolecular disulfide bond in A51C/G77C hCyt c affects the interaction between hCyt c and Ngb, we performed ITC studies. All titration studies were carried out at 25 °C using a 10 mM phosphate buffer, pH 7.0.As shown in Fig. 10, the results revealed an endothermic process for the formation of the protein–protein complex. The binding constant (Ka) for A51C/G77C hCyt c-Ngb was determined to be Ka = (5.97 ± 0.83) × 103 M−1, corresponding to a dissociation constant (Kd) of 167.5 μM (the error was produced from the data fitting). Notably, the Ka value was ∼16.5 fold lower compared to that of WT hCyt c, Ka = (9.76 ± 1.23) × 104 M−1 (Kd = 10.24 μM). Previous studies conducted using ITC revealed that there was no heat release between buffer solutions, which confirmed that the heat detected during the experiment was due to the specific interaction between Ngb and Cyt c.55 Moreover, the reaction enthalpy (ΔH) and entropy (ΔS) changes were found to be approximately 9 times and 2.7 times higher in A51C/G77C hCyt c binding to Ngb when compared to WT hCyt c.
It should be noted that ΔH is an important parameter for the structure–thermodynamic correlation.56 Regarding the large difference in ΔH between A51C/G77C and WT hCyt c, we speculated that it may be attributed to the formation of a disulfide bond. More energy is required to induce conformational transitions against the disulfide bond for protein–protein interactions, which may result in weakened interactions with Ngb. Consequently, the positive ΔH and ΔS suggested that the formation of the Ngb-Cyt c complex is predominantly entropy-driven, resulting in a negative Gibbs free energy (ΔG). As proposed in a previous study,14 the increased entropy may be related to the release of water molecules from the binding interface during the formation of the protein–protein complex. These observations suggest that the flexibility of Ω-loop C and Ω-loop D plays an important role in protein–protein interactions.
3. Conclusion
In this study, we engineered an artificial disulfide bond (Cys51–Cys77) to connect Ω-loops C and D of hCyt c, as guided by computer-aided design. The alkaline conformational transition experiments showed a 1.8-unit decrease in pH1/2 for A51C/G77C hCyt c, comparable to those of G41S, Y48H, and A51V variants.16–18 EPR data indicated that ferric A51C/G77C hCyt c exhibited high-spin species under neutral conditions, indicating that the disulfide bond disrupted the equilibrium of Met80-on (six-coordinated) and Met80-off (five-coordinated) states. This disruption increased the amount of Met80-off species, which enhanced the peroxidase activity by 3.5-fold higher than that of WT hCyt c, surpassing that of the A51V variant.18 Additionally, ITC studies revealed an ∼16-fold decrease in binding affinity for A51C/G77C hCyt c to Ngb, indicating that the disulfide bond influences the dynamic flexibility of Ω-loop C and Ω-loop D. Our findings demonstrate that the dynamic properties of Ω-loops C and D may favor the heme coordination and protein–protein interactions by conformational change, which supports the native functions of hCyt c. Therefore, this approach might be generally applied to other metalloproteins to provide insights into their structural, dynamic, and functional relationships.4. Materials and methods
4.1 Materials
The peroxidase substrate, 2,2′-azino-bis(3-ethylbenzothiazoline-6-sulfonic acid) diammonium salt (ABTS), was bought from Aladdin Industrial Corporation (Shanghai, China). The pBTR1 plasmid containing the coding sequence of the WT hCyt c gene was obtained from Addgene (no. 22468). All required reagents were of analytical grade and commercially available without further purification.4.2 Protein expression and purification
Human cytochrome c (hCyt c) and neuroglobin (hNgb) were expressed and purified as previously reported.50,57 Briefly, the expression vectors containing hCyt c or the gene were transformed into E. coli BL21(DE3) cells and selected by 100 g mL−1 ampicillin. The A51C/G77C mutation of hCyt c was introduced using a QuikChange II site-directed mutagenesis kit (Stratagene) and confirmed by DNA sequencing (Sangon Biotech). For hCyt c expression, the rich medium was incubated for 24 h at 37 °C. hCyt c and hNgb samples with an ASoret/A280nm > 4.0 and ASoret/A280nm > 3.0 were collected, respectively.4.3 Molecular simulations
According to the protocol of the web-server Yosshi34 and based on the X-ray crystal structure of WT hCyt c (PDB code 3ZCF33), we chose several amino acids in Ω-loop C (40–55) and Ω-loop D (70–85) with close distances and those with less impact on the protein structure, and replaced them with Cys residues, which generated a new sequence (namely sequence 1), and the amino acid sequence of WT hCyt c is sequence 2:Sequence1: GDVEKGKKIF IMKCSQCHTV EKGGKHKTGP NLHGLFGRKT GQAPGYSYCC CNCCCCCIWG EDTLMEYLEN PKKCCPCCKM IFVGIKKKEE RADLIAYLKK ATNE;
Sequence 2: GDVEKGKKIF IMKCSQCHTV EKGGKHKTGP NLHGLFGRKT GQAPGYSYTA ANKNKGIIWG EDTLMEYLEN PKKYIPGTKM IFVGIKKKEE RADLIAYLKK ATNE.
The two sequences were then submitted and analyzed by the web-server Yosshi to search for possible targets to engineer artificial disulfide bonds. Some representative results are presented in Fig. S1.†
The initial structure of the A51C/G77C hCyt c mutant was constructed based on the crystal structure of WT hCyt c (PDB code 3ZCF33) using the VMD 1.9 program.58 A patch of the disulfide bond was applied to Cys51–Cys77, and Cys14 and Cys17 were patched to the heme vinyl group via C–S bonds. The protein was solvated in a cubic box of TIP3 water, which extended 10 Å away from any given protein atom. Counter ions (Na+ and Cl−) were further added to obtain the physiological ionic strength of 0.15 M by using the autoionize plug-in of VMD 1.9. The resulting system was minimized with NAMD2.9 (Nanoscale Molecular Dynamics),59 using 5000 minimization steps with the conjugate gradient method at 0 K, and equilibrated for 1![[thin space (1/6-em)]](https://www.rsc.org/images/entities/char_2009.gif) 000
000![[thin space (1/6-em)]](https://www.rsc.org/images/entities/char_2009.gif) 000 molecular dynamics steps (1 fs per step) at 310 K, and then further minimized for 5000 steps at 0 K.
000 molecular dynamics steps (1 fs per step) at 310 K, and then further minimized for 5000 steps at 0 K.
4.4 SDS-polyacrylamide gel electrophoresis (SDS-PAGE)
The purity of the protein sample was determined using a 15% SDS-polyacrylamide plate. The protein samples were diluted to Asoret = 0.5, mixed with SDS, placed on a boiler at 105 °C for 5 min, and carefully added to the gel tank. A sample volume of 20 μL was loaded into the electrophoresis tank, which was then assembled and subjected to electrophoresis at 200 V for 30 minutes. After the electrophoresis, the gel was carefully removed and placed in a 2% Coomassie bright blue stain in a mixture of ethanol–water–glacial acetic acid (45![[thin space (1/6-em)]](https://www.rsc.org/images/entities/char_2009.gif) :
:![[thin space (1/6-em)]](https://www.rsc.org/images/entities/char_2009.gif) 45
45![[thin space (1/6-em)]](https://www.rsc.org/images/entities/char_2009.gif) :
:![[thin space (1/6-em)]](https://www.rsc.org/images/entities/char_2009.gif) 10) and stained for 0.5 h to 2 h, and then left overnight in 7% (V/V) acetic acid at room temperature for complete destaining.
10) and stained for 0.5 h to 2 h, and then left overnight in 7% (V/V) acetic acid at room temperature for complete destaining.
4.5 Mass spectroscopy
The protein mass spectra were obtained with a G2-XS QTQF mass spectrometer (Waters). The protein samples were dissolved in a 1% formic acid water solution. The molecular weight of the protein was calculated by applying MaxEnt1 software.4.6 Circular dichroism spectroscopy
Circular dichroism (CD) spectra were collected in the far-UV (190–250 nm) region using a JASCO 1500 instrument. The experiment used the protein sample at a concentration of 2 μM and the scan rate was set to 100 nm min−1. The spectra of the protein samples (10 μM) in a 10 mM phosphate buffer solution were recorded for the visible region experiment.4.7 Fluorescence spectroscopy
The measurement of Trp59 fluorescence of hCyt c was performed on an F-7000 fluorescence spectrophotometer, with an excitation wavelength of 293 nm, a scan range of 310–500 nm, a fixed scan rate of 0.5 s nm−1, and a fixed excitation and emission slit width of 5 nm. In the experiment of guanidine hydrochloride (GuHCl) denaturation, 10 μL of protein with a concentration of 0.6 mM was added to 1.5 ml of guanidine hydrochloride solution with concentrations ranging from 0 to 6 M, mixed and left for 30 min. The reaction was carried out in 10 mM, pH 7.0 sodium phosphate buffer. The fluorescence intensity at 360 nm was converted to fraction denatured (fD,Emit) using eqn (1).41 | (1) |
The maximum and minimum emission intensities at 360 nm are represented as Imax and Imin, respectively. The fD,Emit was then fitted to the Boltzmann equation (eqn (2)).32
| I = Imin + (Imax − Imin)/(1 + e(C−Cm)/dC) | (2) |
4.8 pH titration studies
WT and A51C/G77C hCyt c pH titrations were carried out at room temperature using a PerkinElmer Lambda 365. At 695 nm, the alkaline conformational change was observed. The corrected absorbance at 695 nm was derived by subtracting the absorbance at 750 nm from the absorbance at 695 nm to correct for baseline drift (A695corr = A695 − A750). Each sample had a starting pH of 7.0, which was then raised to 11.0 by adding a 0.5–2 μL aliquot of KOH in the appropriate concentration. At the peak of the Soret band, the acidic unfolding titration of hCyt c and its mutants was observed. The pH of the sample was changed from 7.0 to 1.0 by adding the appropriate quantity of HCl. The pH-titration data were fitted to the fit to a modified form of the Henderson–Hasselbalch equation (eqn (3)).60 | (3) |
A N is the corrected absorbance for the native state with Met80 bound to the heme, AALK is the corrected absorbance for the state transition, pKapp is the apparent pKa of the transition, and n is the number of protons.
4.9 Azide binding studies
The azide binding experiments were performed on a PerkinElmer Lambda 365 by adding an equal volume of 200 mM NaN3 solution to 10 μM protein samples in 100 mM potassium phosphate buffer at pH 7.0. UV-vis spectra were recorded between 300 and 700 nm in 10 min with 25 s intervals. The observed rate constants (kobs) were calculated via single exponential fits (eqn (4)).| kobs = kd + ka·[NaN3] | (4) |
4.10 Heme degradation studies
The kinetic data of hCyt c heme degradation with H2O2 were acquired on an Agilent 8453 diode array spectrometer. UV-vis spectra were recorded between 300 and 700 nm. The degradation rate of heme was determined by adding an equal volume of H2O2 solution at various concentrations to 10 μM hCyt c samples in 100 mM potassium phosphate buffer at pH 7.0. The observed rate constants (kobs) were calculated via single exponential fits according to the following equation (eqn (5)).61| kobs = kd + ka·[H2O2] | (5) |
4.11 Electron paramagnetic resonance (EPR) studies
EPR spectra were collected at the Steady High Magnetic Field Facilities, High Magnetic Field Laboratory. The concentrations of WT and A51C/G77C hCyt c were adjusted to 300 μM with H2O. The data were collected at 20 K, 1 mW power and 9.4 GHz.4.12 Stopped-flow kinetic studies
Using ABTS as the substrate and H2O2 (240 nm = 39.4 M−1 cm−1) as the oxidant, the peroxidase activity of WT and A51C/G77C hCyt c was assessed using a dual mixing stopped-flow spectrophotometer (SF-61 DX2 Hi-Tech KinetAsyst™). The syringes were filled with 50 mM potassium phosphate buffer at pH 5.0–8.0, 5 mM protein, and ABTS. The range of the ABTS concentration was 5 to 100 mM. Equal amounts of the oxidant and the enzyme/substrate mixture were combined to examine the reaction's kinetics. By measuring the product's absorbance (ABTS˙+) at 660 nm with an attenuation value of 1400 M−1 cm −1, the reaction's progress was tracked.62 The data were averaged over six independent measurements and fitted to a linear equation. Six independent measurements were taken and the data were averaged and fitted to a linear equation (eqn (6)).| A660nm = kobs[ABTS] + C | (6) |
The initial rate versus substrate concentration data were analyzed using the Michaelis–Menten equation (eqn (7)) to determine the Km and kcat values.
| v[hCyt c] = kcat[ABTS]/(Km + [ABTS]) | (7) |
4.13 Isothermal titration calorimetry (ITC) studies
A MicroCal VP-ITC titration calorimeter was used for the isothermal titration calorimetry (ITC) tests (GE Healthcare). The samples of hCyt c and hNgb were both desalted to 10 mM potassium phosphate buffer (pH 7.0). Approximately 0.8 mM hCyt c variant was titrated at 25 °C with approximately 2 mL of the WT hNgb variant (concentration ratio of hNgb to hCyt c of roughly 40). A total of 25 injections of 10 μl aliquots of hCyt c were added during the titration process at 120-second intervals. The OneSites binding model was fitted to the titration data.Data availability
Data will be made available on request.Author contributions
Yan-Yan Li: methodology, investigation, data curation, writing – original draft. Yu Feng: methodology, investigation. Lu Yu: methodology, investigation. Shuang-Shuang Long: review & editing. Shu-Qin Gao: data curation. Ying-Wu Lin: validation, writing – review & editing, project administration, funding acquisition.Conflicts of interest
The authors declare that they have no known competing financial interests or personal relationships that could have appeared to influence the work reported in this paper.Acknowledgements
This work was supported by the National Natural Science Foundation of China (32171270, 32301060 and 21977042) and the Natural Science Foundation of Hunan Province of China (No. 2023JJ40533).References
- X. Huang and J. T. Groves, Chem. Rev., 2017, 118, 2491–2553 CrossRef PubMed.
- J. Liu, S. Chakraborty, P. Hosseinzadeh, Y. Yu, S. Tian, I. Petrik, A. Bhagi and Y. Lu, Chem. Rev., 2014, 114, 4366–4469 CrossRef CAS PubMed.
- T. L. Poulos, Chem. Rev., 2014, 114, 3919–3962 CrossRef CAS PubMed.
- Y. Wang and A. Liu, Chem. Soc. Rev., 2020, 49, 4906–4925 RSC.
- I. Bertini, G. Cavallaro and A. Rosato, Chem. Rev., 2006, 106, 90–115 CrossRef CAS PubMed.
- D. n. Alvarez-Paggi, L. Hannibal, M. A. Castro, S. Oviedo-Rouco, V. Demicheli, V. Tórtora, F. Tomasina, R. Radi and D. H. Murgida, Chem. Rev., 2017, 117, 13382–13460 CrossRef CAS PubMed.
- X. Jiang and X. Wang, Annu. Rev. Biochem., 2004, 73, 87–106 CrossRef CAS PubMed.
- V. E. Kagan, V. A. Tyurin, J. Jiang, Y. Y. Tyurina, V. B. Ritov, A. A. Amoscato, A. N. Osipov, N. A. Belikova, A. A. Kapralov and V. Kini, Nat. Chem. Biol., 2005, 1, 223–232 CrossRef CAS PubMed.
- A. A. Kapralov, I. V. Kurnikov, I. I. Vlasova, N. A. Belikova, V. A. Tyurin, L. V. Basova, Q. Zhao, Y. Y. Tyurina, J. Jiang and H. Bayir, Biochemistry, 2007, 46, 14232–14244 CrossRef CAS PubMed.
- M. Zhou, Y. Li, Q. Hu, X.-C. Bai, W. Huang, C. Yan, S. H. Scheres and Y. Shi, Genes Dev., 2015, 29, 2349–2361 CrossRef CAS PubMed.
- M. Fiocchetti, M. Cipolletti, V. Brandi, F. Polticelli and P. Ascenzi, J. Mol. Recognit., 2017, 30, e2654 CrossRef PubMed.
- M. Fiocchetti, P. Cracco, E. Montalesi, V. S. Fernandez, J. A. Stuart and M. Marino, Arch. Biochem. Biophys., 2021, 701, 108823 CrossRef CAS PubMed.
- S. Bønding, K. Henty, A. Dingley and T. Brittain, Int. J. Biol. Macromol., 2008, 43, 295–299 CrossRef PubMed.
- P. B. Tiwari, L. Astudillo, K. Pham, X. Wang, J. He, S. Bernad, V. Derrien, P. Sebban, J. Miksovska and Y. Darici, Inorg. Chem. Commun., 2015, 62, 37–41 CrossRef CAS.
- P. B. Tiwari, P. P. Chapagain and A. Üren, Sci. Rep., 2018, 8, 10557 CrossRef PubMed.
- A. I. Karsisiotis, O. M. Deacon, M. T. Wilson, C. Macdonald, T. M. Blumenschein, G. R. Moore and J. A. Worrall, Sci. Rep., 2016, 6, 30447 CrossRef CAS PubMed.
- O. M. Deacon, A. I. Karsisiotis, T. Moreno-Chicano, M. A. Hough, C. Macdonald, T. M. Blumenschein, M. T. Wilson, G. R. Moore and J. A. Worrall, Biochemistry, 2017, 56, 6111–6124 CrossRef CAS PubMed.
- H. Lei and B. E. Bowler, J. Phys. Chem. B, 2019, 123, 8939–8953 CrossRef CAS PubMed.
- Y. Feng, X.-C. Liu, L. Li, S.-Q. Gao, G.-B. Wen and Y.-W. Lin, ACS Omega, 2022, 7, 11510–11518 CrossRef CAS PubMed.
- M. M. Krishna, Y. Lin, J. N. Rumbley and S. W. Englander, J. Mol. Biol., 2003, 331, 29–36 CrossRef CAS PubMed.
- H. Maity, M. Maity, M. M. Krishna, L. Mayne and S. W. Englander, Proc. Natl. Acad. Sci. U. S. A., 2005, 102, 4741–4746 CrossRef CAS PubMed.
- W. Hu, Z.-Y. Kan, L. Mayne and S. W. Englander, Proc. Natl. Acad. Sci. U. S. A., 2016, 113, 3809–3814 CrossRef CAS PubMed.
- A. M. Berghuis and G. D. Brayer, J. Mol. Biol., 1992, 223, 959–976 CrossRef CAS PubMed.
- H. Maity, M. Maity and S. W. Englander, J. Mol. Biol., 2004, 343, 223–233 CrossRef CAS PubMed.
- Y. Deng, M. L. Weaver, K. R. Hoke and E. V. Pletneva, Inorg. Chem., 2019, 58, 14085–14106 CrossRef CAS PubMed.
- Y.-W. Lin, Arch. Biochem. Biophys., 2018, 641, 1–30 CrossRef CAS PubMed.
- A. A. Dombkowski, K. Z. Sultana and D. B. Craig, FEBS Lett., 2014, 588, 206–212 CrossRef CAS PubMed.
- T. Uchida, M. Unno, K. Ishimori and I. Morishima, Biochemistry, 1997, 36, 324–332 CrossRef CAS PubMed.
- L.-L. Yin, H. Yuan, K.-J. Du, B. He, S.-Q. Gao, G.-B. Wen, X. Tan and Y.-W. Lin, Chem. Commun., 2018, 54, 4356–4359 RSC.
- L.-J. Sun, H. Yuan, J.-K. Xu, J. Luo, J.-J. Lang, G.-B. Wen, X. Tan and Y.-W. Lin, Biochemistry, 2021, 62, 369–377 CrossRef PubMed.
- L.-J. Sun, H. Yuan, L. Yu, S.-Q. Gao, G.-B. Wen, X. Tan and Y.-W. Lin, Chem. Commun., 2022, 58, 5885–5888 RSC.
- H.-X. Liu, L. Li, X.-Z. Yang, C.-W. Wei, H.-M. Cheng, S.-Q. Gao, G.-B. Wen and Y.-W. Lin, RSC Adv., 2019, 9, 4172–4179 RSC.
- B. S. Rajagopal, A. N. Edzuma, M. A. Hough, K. L. Blundell, V. E. Kagan, A. A. Kapralov, L. A. Fraser, J. N. Butt, G. G. Silkstone and M. T. Wilson, Biochem. J., 2013, 456, 441–452 CrossRef CAS PubMed.
- D. Suplatov, D. Timonina, Y. Sharapova and V. Švedas, Nucleic Acids Res., 2019, 47, W308–W314 CrossRef CAS PubMed.
- D. Suplatov, V. Voevodin and V. Švedas, Biotechnol. J., 2015, 10, 344–355 CrossRef CAS PubMed.
- K. Beerens, S. Mazurenko, A. Kunka, S. M. Marques, N. Hansen, M. Musil, R. Chaloupkova, J. Waterman, J. Brezovsky and D. Bednar, ACS Catal., 2018, 8, 9420–9428 CrossRef CAS.
- T. M. Schmidt and A. A. DiSpirito, Arch. Microbiol., 1990, 154, 453–458 CrossRef CAS.
- C. Perez-Iratxeta and M. A. Andrade-Navarro, BMC Struct. Biol., 2008, 8, 1–5 CrossRef PubMed.
- R. Santucci and F. Ascoli, J. Inorg. Biochem., 1997, 68, 211–214 CrossRef CAS PubMed.
- H. Sahoo, J. Photochem. Photobiol., C, 2011, 12, 20–30 CrossRef CAS.
- S. Samsri and S. Pornsuwan, Arch. Biochem. Biophys., 2021, 709, 108980 CrossRef CAS PubMed.
- F. Boffi, A. Bonincontro, S. Cinelli, A. C. Castellano, A. De Francesco, S. Della Longa, M. Girasole and G. Onori, Biophys. J., 2001, 80, 1473–1479 CrossRef CAS PubMed.
- T. Ying, F. Zhong, J. Xie, Y. Feng, Z.-H. Wang, Z.-X. Huang and X. Tan, J. Bioenerg. Biomembr., 2009, 41, 251–257 CrossRef CAS PubMed.
- F. I. Rosell, J. C. Ferrer and A. G. Mauk, J. Am. Chem. Soc., 1998, 120, 11234–11245 CrossRef CAS.
- S. Baddam and B. E. Bowler, Biochemistry, 2006, 45, 4611–4619 CrossRef CAS PubMed.
- S. Baddam and B. E. Bowler, Biochemistry, 2005, 44, 14956–14968 CrossRef CAS PubMed.
- W. B. R. Pollock, F. I. Rosell, M. B. Twitchett, M. E. Dumont and A. G. Mauk, Biochemistry, 1998, 37, 6124–6131 CrossRef CAS PubMed.
- P. K. Witting, A. G. Mauk and P. A. Lay, Biochemistry, 2002, 41, 11495–11503 CrossRef CAS PubMed.
- P. Zhang, H. Yuan, J. Xu, X.-J. Wang, S.-Q. Gao, X. Tan and Y.-W. Lin, ACS Catal., 2019, 10, 891–896 CrossRef.
- D. Lou, X.-C. Liu, X.-J. Wang, S.-Q. Gao, G.-B. Wen and Y.-W. Lin, RSC Adv., 2020, 10, 44768–44772 RSC.
- O. M. Deacon, R. W. White, G. R. Moore, M. T. Wilson and J. A. Worrall, J. Inorg. Biochem., 2020, 203, 110924 CrossRef CAS PubMed.
- S. Hirota, N. Yamashiro, Z. Wang and S. Nagao, JBIC, J. Biol. Inorg. Chem., 2017, 22, 705–712 CrossRef CAS PubMed.
- R. Radi, L. Thomson, H. Rubbo and E. Prodanov, Arch. Biochem. Biophys., 1991, 288, 112–117 CrossRef CAS PubMed.
- G. Balakrishnan, Y. Hu, O. F. Oyerinde, J. Su, J. T. Groves and T. G. Spiro, J. Am. Chem. Soc., 2007, 129, 504–505 CrossRef CAS PubMed.
- Y.-Y. Li, S.-S. Long, L. Yu, A.-K. Liu, S.-Q. Gao, X. Tan and Y.-W. Lin, J. Inorg. Biochem., 2023, 112296 CrossRef CAS PubMed.
- V. Linkuvienė, G. Krainer, W.-Y. Chen and D. Matulis, Anal. Biochem., 2016, 515, 61–64 CrossRef PubMed.
- S.-F. Chen, X.-C. Liu, J.-K. Xu, L. Li, J.-J. Lang, G.-B. Wen and Y.-W. Lin, Inorg. Chem., 2021, 60, 2839–2845 CrossRef CAS PubMed.
- W. Humphrey, A. Dalke and K. Schulten, J. Mol. Graphics, 1996, 14, 33–38 CrossRef CAS PubMed.
- L. Kalé, R. Skeel, M. Bhandarkar, R. Brunner, A. Gursoy, N. Krawetz, J. Phillips, A. Shinozaki, K. Varadarajan and K. Schulten, J. Comput. Phys., 1999, 151, 283–312 CrossRef.
- H. Lei, S. M. Nold, L. J. Motta and B. E. Bowler, Biochemistry, 2019, 58, 2921–2933 CrossRef CAS PubMed.
- N. Tomáškovó, L. Varinská and E. Sedlák, Gen. Physiol. Biophys., 2010, 29, 255 CrossRef PubMed.
- F. Nastri, L. Lista, P. Ringhieri, R. Vitale, M. Faiella, C. Andreozzi, P. Travascio, O. Maglio, A. Lombardi and V. Pavone, Chem. – Eur. J., 2011, 17, 4444–4453 CrossRef CAS PubMed.
Footnote |
| † Electronic supplementary information (ESI) available. See DOI: https://doi.org/10.1039/d3me00196b |
| This journal is © The Royal Society of Chemistry 2024 |

