 Open Access Article
Creative Commons Attribution 3.0 Unported Licence
Multi-functional GdEuxTb1−xO3 (x = 0 to 1) nanoparticles: colour tuning optical properties, water proton spin relaxivities, and X-ray attenuation properties†
Dejun
Zhao
 a,
Ying
Liu
a,
Son Long
Ho
a,
Ying
Liu
a,
Son Long
Ho
 a,
Tirusew
Tegafaw
a,
Abdullah Khamis Ali
Al Saidi
a,
Tirusew
Tegafaw
a,
Abdullah Khamis Ali
Al Saidi
 a,
Hansol
Lee
b,
Dabin
Ahn
b,
Hyunji
Nam
b,
Ji Ae
Park
c,
Ji-ung
Yang
c,
Weon-Sik
Chae
 d,
Yongmin
Chang
*e and
Gang Ho
Lee
 *a
*a
aDepartment of Chemistry, College of Natural Sciences, Kyungpook National University, Taegu 41566, South Korea. E-mail: ghlee@mail.knu.ac.kr; Fax: +82-53-950-6330; Tel: +82-53-950-5340
bDepartment of Medical & Biological Engineering, Kyungpook National University, Taegu 41944, South Korea
cDivision of RI-Convergence Research, Korea Institute of Radiological & Medical Science, Seoul 01817, South Korea
dDaegu Center, Korea Basic Science Institute, Taegu 41566, South Korea
eDepartment of Molecular Medicine, School of Medicine, Kyungpook National University, Taegu 41944, South Korea. E-mail: ychang@knu.ac.kr; Tel: +82-53-420-5471
First published on 22nd August 2024
Abstract
Multi-functional nanoparticles are useful for various applications, such as biomedical imaging, detection, and display technologies. Colour-tunable GdEuxTb1−xO3 nanoparticles were synthesized with emission colour ranging from green (545 nm) to red (616 nm) by varying x (x = 0, 0.1, 0.3, 0.5, 0.7, 0.9, and 1). These nanoparticles were surface-grafted with polyacrylic acid and a small quantity of 2,6-pyridinedicarboxylic acid. This modification aimed to ensure long-term colloidal stability (>1 year without precipitation) and high quantum yields (>30%) in aqueous media. Additionally, they exhibited long emission lifetimes (∼1 ms), high longitudinal water proton spin relaxivities (>30 s−1mM−1), and high X-ray attenuation efficiencies (∼10 HU mM−1). These multiple exceptional properties within a single nanoparticle make them highly valuable for applications in biomedical imaging, noise-free signal detection, and colour display.
Introduction
The mixed lanthanide oxide (GdEuxTb1−xO3) nanoparticles exhibit various optical and magnetic properties essential for applications in biology, medicine, and information technology, including biolabeling, diagnosis, and electronic displays.1–5 These properties stem from the intrinsic electronic properties of 4f-electrons of the lanthanide elements,6 and their high atomic numbers, which enhance their X-ray attenuation power.7In this study, gadolinium (Gd), europium (Eu), and terbium (Tb) were mixed to obtain GdEuxTb1−xO3 nanoparticles, with Gd maintained at a nearly constant level to adjust the emission colour between green (545 nm from Tb) and red (616 nm from Eu)1,2,8 by varying x (x = 0–1). Gd3+ is optically transparent in the visible region and has no effect on the colour.9 However, it significantly boosts longitudinal water proton spin relaxivities (r1) due to its exceptionally high 4f-electron spin (s = 7/2) magnetic moment (μ = 7.9–8.0 emu g−1), valuable for use as T1 magnetic resonance imaging (MRI) contrast agents.4,5,10–12
Lanthanides, as optical probes, exhibit exceptional properties such as long-term photostability, a large Stokes shift (the energy difference between excitation and emission wavelengths), sharp atomic-like transitions, long emission lifetimes, and resistance to photobleaching.1,5,13,14 Consequently, they enable near background-free signal measurements with high detection limits,15 surpassing organic dyes and quantum dots (QDs). However, their drawback is low emission intensity due to forbidden 4f–4f electronic transitions,1,16,17 making them less favoured as optical probes than organic dyes and QDs. Nevertheless, this can be significantly improved through photosensitization,8,18–25 which is an electronic energy transfer process from organic chromophores to lanthanides. The photosensitized lanthanide materials in aqueous media emit strongly with high quantum yields (QYs),8,22,23 comparable to or even surpassing those26 of organic dyes.
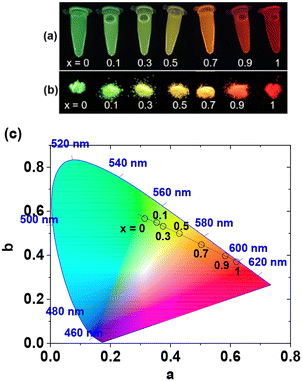
Photosensitized GdEuxTb1−xO3 nanoparticles were created in this study, embodying multiple-functionalities within a single nanoparticle. Until now, achieving colour tuning using Eu and Tb required varying doping ratios of Eu3+/Tb3+ ions in various nano to micro solid-state matrices27–32 or mixing Eu3+/Tb3+ complexes in different ratios.33–36 In this study, colour-tunable GdEuxTb1−xO3 nanoparticles with multiple properties within a single nanoparticle, useful for various applications in solid-states and colloidal forms in aqueous media, were synthesized for the first time. After being grafted with hydrophilic and biocompatible polyacrylic acid (PAA) and a small amount of the organic photosensitizer 2,6-pyridinedicarboxylic acid (PDA), the GdEuxTb1−xO3@PAA/PDA nanoparticle colloids maintained stability in aqueous media without precipitation after synthesis for >1 year, while emitting photons with high QYs. Photoluminescent (PL) spectra, colour tuning, absolute QYs, emission lifetimes, water proton spin relaxivities, and X-ray attenuation power of the nanoparticles were measured to unveil their multi-functional properties. Their key properties include colour tunability by varying x with high QYs, suitable for colour display applications; long emission lifetimes, beneficial for noise-free signal detection; and multiple imaging properties, useful for optical imaging, T1 MRI, and X-ray computed tomography (CT).
Experimental
Materials
Gadolinium(III) chloride hexahydrate (GdCl3·6H2O, ≥99%), europium(III) chloride hexahydrate (EuCl3·6H2O, ≥99.9%), terbium(III) chloride hexahydrate (TbCl3·6H2O, ≥99.9%), PAA (Mw = ∼1800 amu), PDA (C7H5NO4, ≥98.0%), dimethyl sulfoxide (C2H6OS, DMSO, ≥99.9%), tetramethylammonium hydroxide solution (C4H13NO, TMAH, 25 wt% in methanol), and dialysis tubes [molecular weight cut-off (MWCO) = 500 and 2000 amu] were purchased from Sigma-Aldrich (USA). Ethanol (C2H5OH, ≥99.0%) and sodium hydroxide (NaOH, >99%) were purchased from Duksan (South Korea). All chemicals were used as received. The synthesized nanoparticles were washed and dispersed using triple-distilled water.Synthesis of GdEuxTb1−-xO3@PAA nanoparticles
Fig. 1a schematically shows that 1 mmol GdCl3·6H2O, x mmol EuCl3·6H2O, and (1 − x) mmol TbCl3·6H2O (x = 0.1, 0.3, 0.5, 0.7, and 0.9) were dissolved in 15 mL DMSO with magnetic stirring in a three-necked round-bottom flask at 35 °C under atmospheric conditions. For x = 0 and 1, 1 mmol GdCl3·6H2O and 0.3 mmol LnCl3·6H2O (Ln = Eu or Tb) were used. After all precursors were dissolved, the solution became transparent. Subsequently, TMAH solution was added to maintain the solution pH at ∼8, followed by 24 h of magnetic stirring to yield mixed lanthanide oxide nanoparticles. In a separate beaker, 1 mmol of PAA was dissolved in 10 mL of DMSO under magnetic stirring to prepare the PAA solution. This solution was subsequently added to the nanoparticle solution, and TMAH solution was added to maintain the solution pH at ∼8. After 24 h of magnetic stirring, PAA-grafted nanoparticles were obtained. Ethanol (200 mL) was added to the solution, followed by centrifugation at 4000 rpm to purify PAA-grafted nanoparticles. This step removed top solutions containing DMSO, unreacted lanthanide precursors, TMAH, and PAA. After three repetitions of the washing process, the nanoparticles were dispersed in triple-distilled water. Subsequently, a 1 M NaOH solution prepared in triple-distilled water was added to adjust the solution pH to ∼8. The nanoparticles underwent further purification through 1 day of dialysis (MWCO = 2000 amu).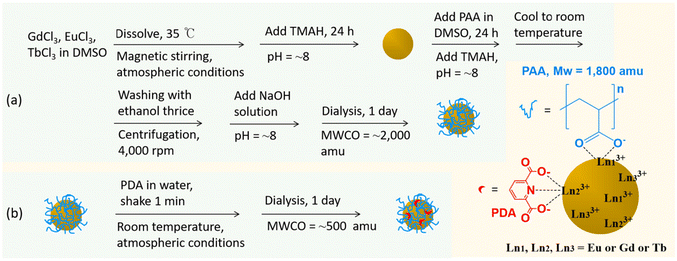 | ||
| Fig. 1 Syntheses of (a) GdEuxTb1−xO3@PAA nanoparticles and (b) GdEuxTb1−xO3@PAA/PDA nanoparticles (x = 0, 0.1, 0.3, 0.5, 0.7, 0.9, and 1). | ||
PDA grafting to obtain GdEuxTb1−-xO3@PAA/PDA nanoparticles
The PDA grafting is schematically shown in Fig. 1b. PDA solutions at concentrations of 10, 20, 30, 40, and 50 μM were prepared in triple-distilled water. These solutions were then added to 4 mL of the prepared GdEuxTb1−xO3@PAA nanoparticle solutions ([Eu] + [Tb] = 2 mM), and the mixtures were gently shaken for 1 min to yield GdEuxTb1−xO3@PAA/PDA nanoparticles. The solutions underwent 1 day of dialysis (MWCO = 500 amu) to remove excess PDA. The optimal PDA concentration was determined by analyzing PL spectra to achieve the highest PL intensity.Characterizations
The synthesized nanoparticles underwent various analyses, as previously detailed.8 These characterizations included particle diameter measurements using high-resolution transmission electron microscopy (HRTEM), metal composition determination using energy-dispersive X-ray spectroscopy (EDS), crystal structure analysis using X-ray diffraction (XRD), zeta potential measurements using a zeta size analyzer, metal composition determination and metal concentration analysis in aqueous media using inductively coupled plasma-atomic emission spectroscopy (ICP-AES), surface-grafting assessment of PAA and PDA on nanoparticle surfaces using Fourier-transform infrared (FT-IR) absorption spectroscopy, surface-grafting quantity determination of PAA and PDA using thermogravimetric analysis (TGA), Ultraviolet (UV)-visible absorption, PL, and excitation spectra, and fluorescence lifetimes measured with a PL spectrometer, absolute QYs assessed using an integration sphere in a PL spectrometer, phantom images and X-ray attenuation power measured using a CT scanner, water proton spin relaxivities and map images acquired using a 3 T MRI scanner at 22 °C, and evaluation of cellular cytotoxicity on two cell lines purchased from American Type Culture Collection (Manassas, VA, USA): normal alpha mouse liver 12 (AML12) and immortalized human embryonic kidney (Hek293) cells using the 3-(4,5-dimethylthiazol-2-yl)-2,5-diphenyl-2H-tetrazolium bromide (MTT) assay.Results and discussion
Colloidal stability, particle diameter, zeta potential, and crystal structure
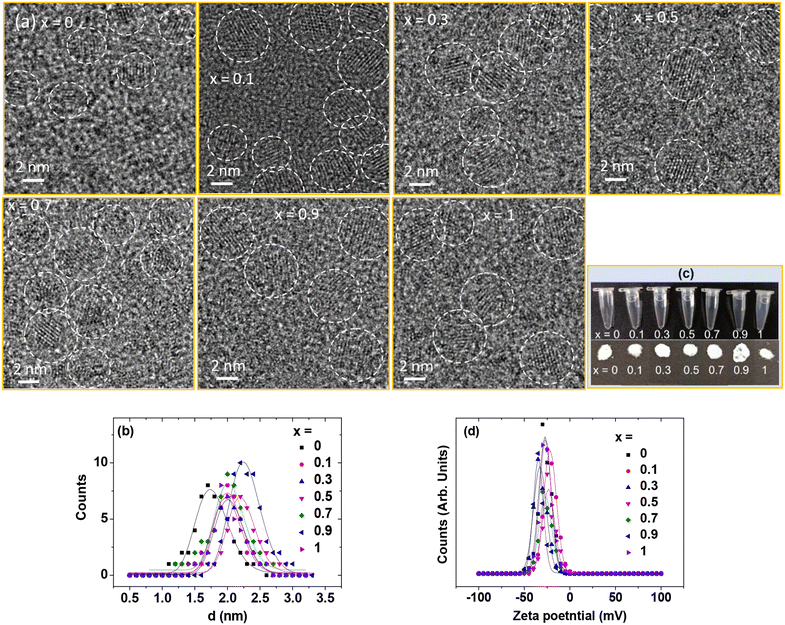
The GdEuxTb1−xO3@PAA/PDA nanoparticles were labelled as x = 0, 0.1, 0.3, 0.5, 0.7, 0.9, and 1, representing the mole compositions used in the synthesis. The actual compositions (x) were estimated from ICP-AES and EDS analyses (Table 1). The EDS spectra are provided in Fig. S1 (ESI†), confirming the presence of Eu, Gd, and Tb in the nanoparticles. As illustrated in the HRTEM images (Fig. 2a), the particle diameters of the nanoparticles were ultrasmall, ranging from 1 to 3 nm. The average particle diameters (davgs) were estimated at 1.8, 2.0, 2.0, 2.2, 2.0, 2.3, and 2.0 nm for x = 0, 0.1, 0.3, 0.5, 0.7, 0.9, and 1, respectively, using log–normal function fits (Fig. 2b & Table 1). Fig. 2c presents the nanoparticle solution and powder sample images. The solution samples remained transparent without nanoparticle precipitation after synthesis (>1 year), demonstrating strong colloidal stability in aqueous media due to the hydrophilic PAA polymer grafting on the nanoparticle surfaces. Despite the photosensitizer PDA, having low water solubility,37 its minor amount during synthesis did not affect colloidal stability. The colloidal dispersion of the nanoparticles in aqueous media was confirmed through laser light scattering, known as the Tyndall effect (Fig. S2 in ESI†). The high negative zeta potentials (ζ < −20 mV) were observed (Fig. 2d & Table 1), confirming their good colloidal stability in aqueous media.| x | ICP-AES (atomic %) | EDS (atomic %) | d avg (nm) | ζ (mV) | S (wt%) | δ (nm−2) |
N
PAA![[thin space (1/6-em)]](https://www.rsc.org/images/entities/char_2009.gif) c c |
||||
|---|---|---|---|---|---|---|---|---|---|---|---|
| Gd | Eu | Tb | Gd | Eu | Tb | ||||||
| a Surface-grafting wt% of PAA and PDA, with values in parentheses indicating the wt% relative to GdEuxTb1−xO3 nanoparticles. b Surface-grafting density,49 representing the average number of PAA polymers covering a nanoparticle unit surface area. c Average number of PAA polymers covering a nanoparticle surface (= δ × πdavg2). | |||||||||||
| 0 | 72.7 | 0 | 27.3 | 56.5 | 0 | 43.5 | 1.8 | −27.3 | 67.3 (28.1) | 1.8 | 18 |
| 0.1 | 51.6 | 5.3 | 43.1 | 47.0 | 6.2 | 46.8 | 2.0 | −21.9 | 62.8 (30.4) | 1.7 | 22 |
| 0.3 | 51.2 | 16.0 | 32.8 | 48.2 | 14.8 | 37.0 | 2.0 | −32.9 | 62.1 (26.3) | 2.0 | 25 |
| 0.5 | 50.4 | 26.6 | 23.0 | 47.9 | 23.6 | 28.5 | 2.2 | −23.4 | 63.3 (27.9) | 2.1 | 31 |
| 0.7 | 50.0 | 36.5 | 13.5 | 48.0 | 33.3 | 18.7 | 2.0 | −26.9 | 63.9 (28.8) | 1.8 | 23 |
| 0.9 | 49.4 | 46.3 | 4.3 | 48.3 | 43.1 | 8.6 | 2.3 | −34.7 | 60.4 (27.9) | 2.0 | 34 |
| 1 | 68.0 | 32.0 | 0 | 77.7 | 22.3 | 0 | 2.0 | −26.9 | 69.1 (27.5) | 2.0 | 26 |
Eu3+, Tb3+, and Gd3+ can be homogeneously mixed within mixed lanthanide oxide nanoparticles due to their identical cubic crystal structure38–42 and similar ionic radii.43 The nanoparticles exhibited an amorphous pattern due to their ultrasmall particle diameters (Fig. S3a in ESI†). However, distinct sharp peaks indicative of the cubic structure were observed after TGA owing to the heat treatment44 (Fig. S3b in ESI†). The lattice constants after TGA were consistent with mole-percent averaged values of those of individual bulk Ln2O3 (Ln = Eu, Gd, and Tb)38–40 (Table S1 in ESI†), confirming the homogeneous mixing of the different Ln3+ within the nanoparticles.
Surface grafting of PAA and PDA on the nanoparticle surfaces
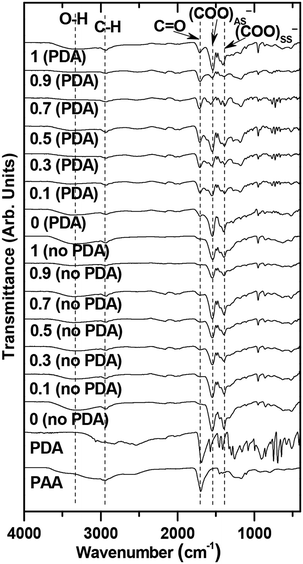
PAA and PDA are grafted on the nanoparticle surfaces through electrostatic interaction between their –COOH groups and the Ln3+ ions of the nanoparticles. In addition, the nitrogen of PDA can contribute to the interaction. The binding structure of PAA and PDA is proposed in Fig. 1. Multiple binding between each PAA and a nanoparticle is possible because of ∼27 –COOH groups per PAA and numerous Ln3+ ions on each nanoparticle surface. The FT-IR absorption spectra of GdEuxTb1−xO3@PAA/PDA nanoparticles (x = 0, 0.1, 0.3, 0.5, 0.7, 0.9, and 1), and their references, including GdEuxTb1−xO3@PAA nanoparticles, PAA, and PDA, are presented in Fig. 3. Before binding to the nanoparticles, the C![[double bond, length as m-dash]](https://www.rsc.org/images/entities/char_e001.gif) O stretching peak of PAA at ∼1700 cm−1 red-shifted and split into COO− antisymmetric stretching vibrations at ∼1548 cm−1 and symmetric stretching vibrations at ∼1396 cm−1 after binding to the nanoparticles45,46 (Fig. 3). This shift and splitting indicate bidentate47 electrostatic (i.e., hard acid-base48) binding of COO− groups of PAA to the Ln3+ of the nanoparticles. The C
O stretching peak of PAA at ∼1700 cm−1 red-shifted and split into COO− antisymmetric stretching vibrations at ∼1548 cm−1 and symmetric stretching vibrations at ∼1396 cm−1 after binding to the nanoparticles45,46 (Fig. 3). This shift and splitting indicate bidentate47 electrostatic (i.e., hard acid-base48) binding of COO− groups of PAA to the Ln3+ of the nanoparticles. The C![[double bond, length as m-dash]](https://www.rsc.org/images/entities/char_e001.gif) O stretching peak intensity at ∼1700 cm−1 increased after PDA binding to the nanoparticles compared to that before binding (Fig. 3), confirming the successful electrostatic binding of COO− groups of PDA to the Ln3+ of the nanoparticles. Key absorption peak frequencies, supporting the successful PAA and PDA grafting on the nanoparticles, are provided in Table S2.†
O stretching peak intensity at ∼1700 cm−1 increased after PDA binding to the nanoparticles compared to that before binding (Fig. 3), confirming the successful electrostatic binding of COO− groups of PDA to the Ln3+ of the nanoparticles. Key absorption peak frequencies, supporting the successful PAA and PDA grafting on the nanoparticles, are provided in Table S2.†
Surface-grafting amount of PAA
The major grafting ligand on the nanoparticle surfaces was PAA, given its larger quantity (1 mmol) compared to PDA (10–50 μmol) used during synthesis. Surface-grafting amounts (S) were determined in wt% from TGA curves. Fig. 4 illustrates mass drops due to water and air desorption between room temperature and ∼110 °C. Afterward, PAA and PDA were removed from the nanoparticles at temperatures up to ∼410 °C due to a combustion reaction with flowing hot air. Estimated grafting amounts for PAA and PDA were ∼63% (Table 1), after accounting for water and air desorption. Then, TGA curves remained flat, indicating remaining mixed lanthanide oxide nanoparticles with a wt.% of ∼28% (Table 1), as confirmed by the crystalline XRD patterns after TGA (Fig. S3 in ESI†). The average number of PAA polymers grafting a nanoparticle unit surface area, i.e., surface-grafting densities (δ),49 and the average number (NPAA) of PAA polymers grafting a nanoparticle surface were estimated to be ∼1.9 nm−2 and ∼25, respectively (Table 1). These estimates relied on the above-estimated surface-grafting wt% of PAA polymers (excluding minor PDA surface-grafting wt%), davgs obtained from HRTEM images, and mole% averaged bulk densities50 of different Ln2O3 (Ln = Eu, Gd, and Tb).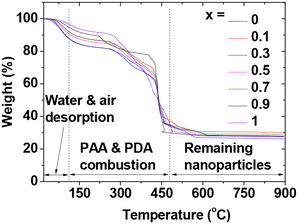 | ||
| Fig. 4 TGA curves of GdEuxTb1−xO3@PAA/PDA nanoparticles (x = 0, 0.1, 0.3, 0.5, 0.7, 0.9, and 1) under air flow. | ||
Optical properties: colour tuning, excitation and PL spectra, absolute QYs, and emission lifetimes
Excitation spectra
To determine the excitation wavelengths (λex) for taking PL spectra, excitation spectra of GdEuxTb1−xO3@PAA/PDA nanoparticles in aqueous media (Fig. S4†) were measured using the most intense emission peaks of Tb at 545 nm and Eu at 616 nm as references. The resulting λex values are provided in Table 2. These λex values closely match the strong absorption peaks of PDA at ∼275 nm in its pure and conjugated nanoparticle (x = 0, 1) UV-visible absorption spectra (Fig. S5†). This similarity indicates that PDA, acting as a photosensitizer, efficiently absorbs photons at 260–295 nm and transfers energy to the GdEuxTb1−xO3@PAA/PDA nanoparticles.| x | λ ex (nm) | Absolute QY (%) | τ (ms) |
r
1![[thin space (1/6-em)]](https://www.rsc.org/images/entities/char_2009.gif) a (s−1 mM−1) a (s−1 mM−1) |
r
2![[thin space (1/6-em)]](https://www.rsc.org/images/entities/char_2009.gif) a (s−1 mM−1) a (s−1 mM−1) |
η (HU mM−1) | ||||||
|---|---|---|---|---|---|---|---|---|---|---|---|---|
| No PDA | PDA | 616 nm peak (Eu) | 545 nm peak (Tb) | No. PDA | PDA | No. PDA | PDA | 35 kVp | 50 kVp | 75 kVp | ||
| a For r1, r2, and η, total concentration of (Eu + Gd + Tb) was used. | ||||||||||||
| 0 | 290 | 7.9 | 35.8 | — | 1.850 | — | — | — | — | 12.0 | 10.0 | 9.7 |
| 0.1 | 289 | 5.8 | 36.2 | 1.113 | 1.447 | 43.4 | 31.3 | 95.7 | 58.6 | — | — | — |
| 0.3 | 289 | 7.3 | 34.1 | 0.700 | 1.222 | 45.2 | 26.1 | 88.0 | 48.4 | — | — | — |
| 0.5 | 287 | 3.8 | 39.7 | 0.910 | 1.369 | 49.0 | 34.7 | 88.0 | 63.8 | — | — | — |
| 0.7 | 289 | 2.5 | 31.2 | 0.843 | 1.361 | — | — | — | — | — | — | — |
| 0.9 | 288 | 2.3 | 20.0 | 0.811 | 1.429 | 60.8 | 38.2 | 95.6 | 70.6 | — | — | — |
| 1 | 288 | 6.9 | 51.6 | 0.413 | — | — | — | — | — | 10.8 | 9.0 | 9.1 |
PL spectra
The PL spectra of GdEuxTb1−xO3@PAA/PDA nanoparticles in aqueous media showed strong emission from Eu3+ and Tb3+ at the determined λexs (Fig. 6). The transition wavelengths and assignments are detailed in Table S5 (ESI†). The peaks exhibited sharp, atomic-like transitions [full widths at half maximum (FWHM) = ∼10 nm] and significant Stokes shifts (>200 nm). These exceptional optical properties contrast with organic dyes with typically broad emission peaks and smaller Stokes shifts (<50 nm). Similarly, QDs exhibit somewhat narrow peak FWHMs (∼20 nm) but smaller Stokes shifts (<50 nm).55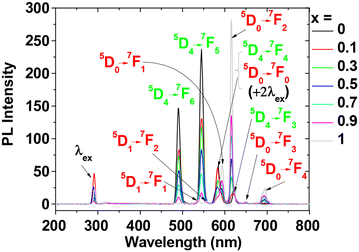 | ||
| Fig. 6 PL spectra of GdEuxTb1−xO3@PAA/PDA nanoparticles in aqueous media (x = 0, 0.1, 0.3, 0.5, 0.7, 0.9, and 1) obtained using λexs (Table 2). | ||
Absolute QYs
The absolute QYs measured in aqueous media are presented in Table 2. These values are 7 to 10 times higher than those without PDA (Table 2), demonstrating the crucial role of photosensitization for the lanthanides. These QY values are comparable to or higher than those of organic dyes.26Photoemission lifetimes and energy transfer efficiencies
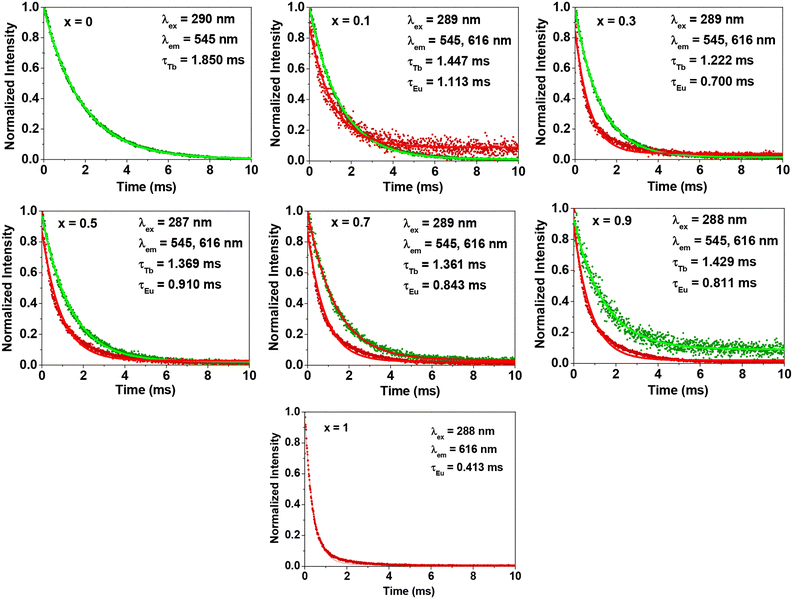
The photoemission lifetimes (τs) of GdEuxTb1−xO3@PAA/PDA nanoparticles in aqueous media were estimated from time-resolved fluorescence (TRF) spectra and by fitting the spectra to an exponential decay function (Fig. 7). The obtained τ values were ∼1 ms (Table 2), significantly 105 to 106 times longer than those of organic dyes (∼10−9 s)56,57 and QDs (∼10−8 s).56,58 These longer emission lifetimes are highly valuable as they enable background-free signals through time-delayed signal measurements, a capability not achievable with organic dyes and QDs. Note that τ values of Eu3+ (x = 0.1 to 0.9) increased with respect to that of x = 1 whereas τ values of Tb3+ (x = 0.1 to 0.9) decreased with respect to that of x = 0. This is attributed to the energy transfer from Tb3+ to Eu3+ in GdEuxTb1−xO3@PAA/PDA nanoparticles.59–61 The energy transfer efficiency (ηET) was estimated using the formula ηET = 1 − (τx/τ0) in which x = 0.1 to 0.9. The estimated ηET values were ∼0.25, as provided in Table S6† and plotted in Fig. S6.† These appreciable ηET values indicate an efficient energy transfer between nearby electronic energy levels of Tb3+ and Eu3+ in the nanoparticles.Water proton spin relaxivities
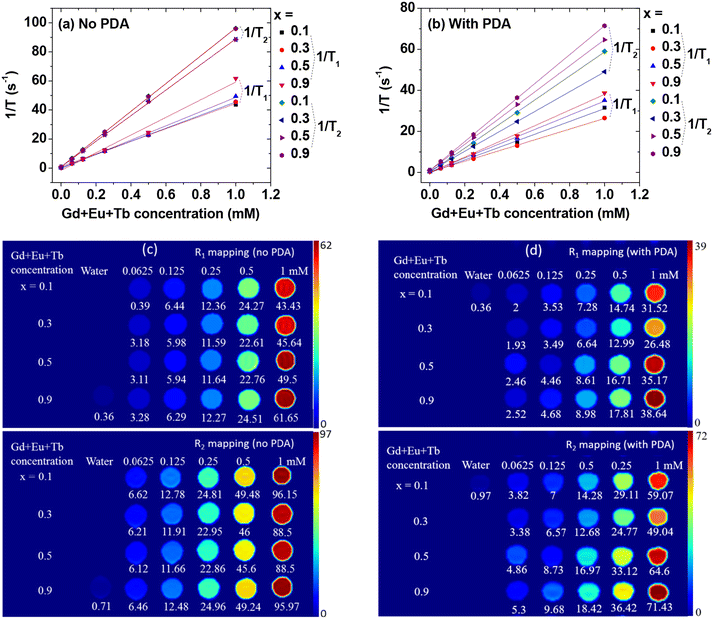
The water proton spin relaxation times and map images were measured before and after the conjugation of PDA to the GdEuxTb1−xO3@PAA nanoparticles. Four samples (i.e., x = 0.1, 0.3, 0.5, and 0.9) were measured since Gd primarily affects water proton spin relaxation due to its very high 4f-electron spin (s = 7/2). Longitudinal (r1) and transverse (r2) water proton spin relaxivities were estimated from the slopes of inverse longitudinal (T1) and transverse (T2) water proton spin relaxation times plots versus (Eu + Gd + Tb) concentrations (Fig. 8a & b and Table 2). All r1 and r2 values were considerably higher than those (4–5 s−1 mM−1) of commercial Gd(III)-chelates for T1 MRI contrast agents.10–12R1 and R2 map images exhibited clear dose-dependent contrast enhancements (Fig. 8c & d), indicating the potential of GdEuxTb1−xO3@PAA and GdEuxTb1−xO3@PAA/PDA nanoparticles as superior T1 MRI contrast agents compared to commercial Gd-chelates. These results are owing to a high density of Gd3+ (s = 7/2) ions per nanoparticle, combined with good colloidal stability of the nanoparticles. Given that r2/r1 ratios are small (<2), the GdEuxTb1−xO3@PAA and GdEuxTb1−xO3@PAA/PDA nanoparticles are better suited as T1 MRI contrast agents rather than T2 MRI contrast agents, similar to Gd(III)-chelates.10–12 The water-attracting capacity of the nanoparticles, and consequently, their r1 and r2 values are affected by surface-grafting materials. As shown in Table 2, the r1 and r2 values of the GdEuxTb1−xO3@PAA/PDA nanoparticles were lower than those of the GdEuxTb1−xO3@PAA nanoparticles due to PDA being less hydrophilic than PAA, reducing the water-attracting capacity of the nanoparticles.X-ray attenuation properties
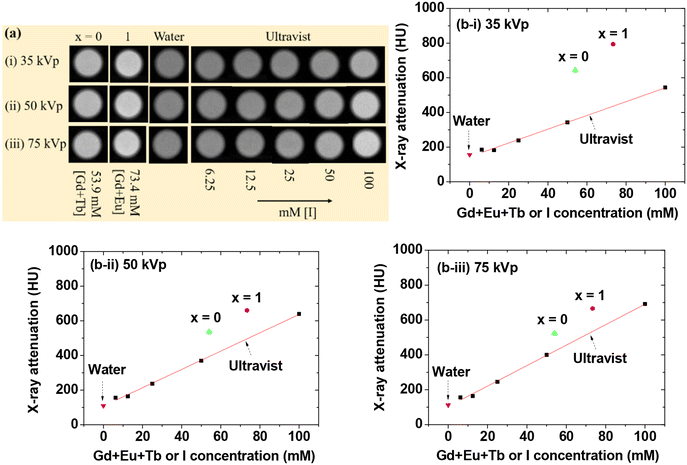
The X-ray attenuation power increases with increasing atomic number (Z).7,62,63 Considering that Eu (Z = 63), Gd (Z = 64), and Tb (Z = 65) have similar atomic numbers, two samples of GdEuxTb1−xO3@PAA/PDA nanoparticles (x = 0 and 1) underwent X-ray phantom image measurements in aqueous media. Additionally, the Ultravist, a commercial iodine (Z = 53)-based CT contrast agent, was measured for comparison. As shown in Fig. 9a, the phantom images of the nanoparticle samples in aqueous media appeared brighter than those of Ultravist at similar atomic concentrations, indicating the superiority of GdEuxTb1−xO3@PAA/PDA nanoparticles over iodine-based CT contrast agents. To demonstrate this quantitatively, the X-ray attenuation power was estimated using the phantom images in Hounsfield units (HU). The formula HU = 1000 (μsample − μwater)/μwater was used, where μ represents the linear attenuation coefficient of the materials estimated from the phantom images. As illustrated in Fig. 9b, the samples exhibited higher X-ray attenuation power than Ultravist across X-ray source voltages of 35, 50, and 75 kVp. X-ray attenuation efficiencies (η; HU mM−1) were ∼10 HU mM−1 (Table 2), obtained by dividing observed X-ray attenuation power by atomic concentration (53.9 mM [Gd + Tb] and 73.4 mM [Eu + Gd]), ∼2 times higher than those of Ultravist (4.0, 5.3, and 5.9 HU mM−1 at X-ray source voltages of 35, 50, and 75 kVp, respectively, estimated from the slopes in Fig. 9b-i, b-ii, & b-iii). These findings affirm the potential of GdEuxTb1−xO3@PAA/PDA nanoparticles as CT contrast agents.Cell viability
Given that all nanoparticle samples contain Eu, Gd, and Tb, two samples of GdEuxTb1−xO3@PAA/PDA nanoparticles (x = 0 and 1) underwent MTT cell viability assay. Fig. 10 illustrates that cell viabilities for AML12 and Hek293 cells remained >90% at concentrations of up to 500 μM [Eu + Gd] and [Gd + Tb] for the two samples, indicating low cytotoxicity and thus the suitability of GdEuxTb1−xO3@PAA/PDA nanoparticles for biomedical applications.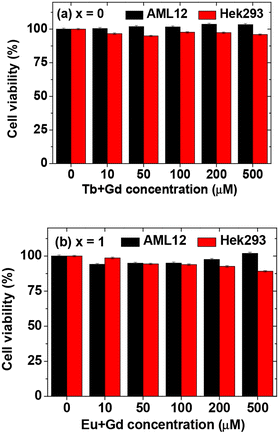 | ||
| Fig. 10 MTT cell viability assay results for AML12 and Hek293 cells following a 48 h incubation with GdEuxTb1−xO3@PAA/PDA nanoparticles [x = (a) 0 and (b) 1]. | ||
Conclusions
In summary, GdEuxTb1−xO3@PAA/PDA nanoparticles (x = 0, 0.1, 0.3, 0.5, 0.7, 0.9, and 1) were synthesized with davg = ∼2.0 nm. These nanoparticles exhibited colloidal stability (no precipitation in aqueous media for >1 year) and high cell viability (>90%). They demonstrated multiple exceptional properties within a single nanoparticle, suitable for various applications as follows:1. The nanoparticles can transition between green (545 nm) and red (616 nm) by adjusting x, along with high absolute QYs (>30%) and long emission lifetimes (∼1 ms) in aqueous media. This capability, facilitated by PDA conjugation as a photosensitizer, makes the nanoparticles suitable for optical imaging, noise-free signal detection, and colour display applications.
2. They exhibited r1 values ∼10 times higher than those of commercial Gd-chelate-based T1 MRI contrast agents, with small r2/r1 ratios (<2), and η values ∼2 times higher than those of commercial iodine-based CT contrast agents, making them suitable as both T1 MRI and CT contrast agents.
Author contributions
D. Z., Y. L. and S. L. H. conceptualized the work and performed the preparation and characterization of the nanoparticles. T. T. and A. K. A. A. S analyzed data. H. L. measured water proton spin relaxivities and map images. D. A. and H. N. measured cell viability. J. A. P. and J.-u. Y. measured X-ray attenuation power. W.-S. C. measured PL spectra and QYs. Y. C. and G. H. L. drafted the manuscript. All authors have approved the final version of the manuscript.Data availability
The raw data required to reproduce these findings will be made available upon request sent directly to the corresponding author.Conflicts of interest
There are no conflicts to declare.Acknowledgements
This work was supported by the Basic Science Research Program of the National Research Foundation (NRF) funded by the Korea government (Ministry of Science, and Information and Communications Technology: MSIT) (Basic Research Laboratory, No. 2021R1A4A1029433).References
- J.-C. G. Bünzli, Chem. Rev., 2010, 110, 2729–2755 CrossRef PubMed.
- S. V. Eliseeva and J.-C. G. Bünzli, Chem. Soc. Rev., 2010, 39, 189–227 RSC.
- A. N. Kumar, D. M. Jnaneshwara, M. R. A. Kumar, N. Basavaraju, C. R. Ravikumar, H. C. A. Murthy, H. Nagabhushana, K. M. Girish, S. Ashwini and R. Naik, Appl. Surf. Sci. Adv., 2020, 1, 100026 CrossRef.
- W. Xu, K. Kattel, J. Y. Park, Y. Chang, T. J. Kim and G. H. Lee, Phys. Chem. Chem. Phys., 2012, 14, 12687–12700 RSC.
- H. Dong, S.-R. Du, X.-Y. Zheng, G.-M. Lyu, L.-D. Sun, L.-D. Li, P.-Z. Zhang, C. Zhang and C.-H. Yan, Chem. Rev., 2015, 115, 10725–10815 CrossRef CAS PubMed.
- A. F. Cotton and G. Wilkinson, Advanced Inorganic Chemistry, John-Wiley & Sons, New York, USA, 4th edn, 1980, pp. 981–985 Search PubMed.
- J. H. Hubbell and S. M. Seltzer, Tables of X-ray Mass Attenuation Coefficients and Mass Energy-Absorption Coefficients from 1 keV to 20 MeV for elements Z = 1 to 92 and 48 Additional Substances of Dosimetric Interest, NIST, Gaithersburg, MD, 1995, https://physics.nist.gov/PhysRefData/XrayMassCoef/cover.html Search PubMed.
- T. Tegafaw, Y. Liu, S. L. Ho, S. Liu, M. Y. Ahmad, A. K. A. A. Saidi, D. Zhao, D. Ahn, H. Nam, W.-S. Chae, S.-W. Nam, Y. Chang and G. H. Lee, Langmuir, 2023, 39, 15338–15342 CrossRef CAS.
- I. Milisavljevic, Y. Wu and E. Zych, J. Lumin., 2020, 224, 117243 CrossRef CAS.
- R. B. Lauffer, Chem. Rev., 1987, 87, 901–927 CrossRef CAS.
- P. Caravan, J. J. Ellison, T. J. McMurry and R. B. Lauffer, Chem. Rev., 1999, 99, 2293–2352 CrossRef CAS PubMed.
- J. Wahsner, E. M. Gale, A. Rodríguez-Rodríguez and P. Caravan, Chem. Rev., 2019, 119, 957–1057 CrossRef CAS.
- Z. Yi, Z. Luo, X. Qin, Q. Chen and X. Liu, Acc. Chem. Res., 2020, 53, 2692–2704 CrossRef CAS PubMed.
- Q. Zhang, S. O'Brien and J. Grimm, Nanotheranostics, 2022, 6, 184–194 CrossRef.
- P. G. Sammes and G. Yahioglu, Nat. Prod. Rep., 1996, 13, 1–28 RSC.
- M. H. V. Werts, Sci. Prog., 2005, 88, 101–131 CrossRef CAS PubMed.
- L. Fu, Y. Wu and T. Fu, J. Lumin., 2022, 245, 118758 CrossRef CAS.
- A. Virender, A. Chauhan, G. Kumar, A. A. Singh, J. Solovev, J. Xiong, X. Liu and B. Mohan, J. Rare Earths, 2024, 42, 16–27 CrossRef.
- X. R. Wang, Y. P. Jiang, A. Tissot and C. Serre, Coord. Chem. Rev., 2023, 497, 215454 CrossRef CAS.
- H. Guan, M. Qi, L. Shi, W. Liu, L. Yang and W. Dou, ACS Appl. Mater. Interfaces, 2023, 15, 18114–18124 CrossRef CAS PubMed.
- W. Fan, Y. Cheng, M. Feng, P. Liu, L. Wang, Y. Liu, Q. E. Cao and L. Y. Zheng, ACS Appl. Mater. Interfaces, 2023, 15, 41977–41991 CrossRef CAS.
- M. Xiao and P. R. Selvin, J. Am. Chem. Soc., 2001, 123, 7067–7073 CrossRef CAS PubMed.
- S. Petoud, S. M. Cohen, J. C. G. Bünzli and K. N. Raymond, J. Am. Chem. Soc., 2003, 125, 13324–13325 CrossRef CAS.
- M. Latva, H. Takalo, V.-M. Mukkala, C. Matachescu, J. C. Rodríguez-Ubis and J. Kankare, J. Lumin., 1997, 75, 149–169 CrossRef.
- M. Räsänen, J. Rosenberg, J. Lukkari, K. Haapakka, J. Kankare and H. Takalo, J. Lumin., 2017, 187, 471–478 CrossRef.
- X.-F. Zhang, Y. Zhang and L. Liu, J. Lumin., 2014, 145, 448–453 CrossRef.
- P. P. Pal and J. Manam, Appl. Phys. A, 2014, 116, 213–223 CrossRef.
- G. A. Sotiriou, M. Schneider and S. E. Pratsinis, J. Phys. Chem. C, 2011, 115, 1084–1089 CrossRef CAS.
- G. V. L. Reddy, L. R. Moorthy, T. Chengaiah and B. C. Jamalaiah, Ceram. Int., 2014, 40, 3399–3410 CrossRef CAS.
- A. Podhorodecki, M. Banski, J. Misiewicz, M. Afzaal, P. O'Brien, D. Chad and X. Wang, J. Mater. Chem., 2012, 22, 5356–5361 RSC.
- D. Qin and W. Tang, RSC Adv., 2017, 7, 2494–2502 RSC.
- Y. Ding, Y. Wang, Y. Li, P. Cao and T. Ren, Photochem. Photobiol. Sci., 2011, 10, 543–547 CrossRef CAS PubMed.
- R. J. Aguado, B. O. Gomes, L. Durães and A. J. M. Valente, Molecules, 2023, 28, 6164 CrossRef CAS PubMed.
- M. Massi and M. I. Ogden, Materials, 2017, 10, 1369 CrossRef.
- R. J. Batrice, A. K. Adcock, P. M. Cantos, J. A. Bertke and K. E. Knope, Cryst. Growth Des., 2017, 17, 4603–4612 CrossRef CAS.
- E. Bartolomé, J. Bartolomé, A. Arauzo, J. Luzón, R. Cases, S. Fuertes, V. Sicilia, A. I. Sánchez-Cano, J. Aporta, S. Melnic, D. Prodius and S. Shova, J. Mater. Chem. C, 2018, 6, 5286–5299 RSC.
- J. A. Dean, Lange's Handbook of Chemistry, McGraw-Hill, Inc., New York, USA, 14th edn, 1992, p. 1.290 Search PubMed.
- Eu2O3, 1977 JCPDS-International Centre for Diffraction Data, card no. 43-1008, the lattice constant = 10.859 Å.
- Gd2O3, 1977 JCPDS-International Centre for Diffraction Data, card no. 43-1014, the lattice constant = 10.813 Å.
- Tb2O3, 1977 JCPDS-International Centre for Diffraction Data, card no. 43-1032, the lattice constant = 10.730 Å.
- W. Xu, B. A. Bony, C. R. Kim, J. S. Baeck and G. H. Lee, Sci. Rep., 2013, 3, 3210 CrossRef PubMed.
- T. Tegafaw, W. Xu, M. W. Ahmad, J. S. Baeck, Y. Chang, J. E. Bae, K. S. Chae, T. J. Kim and G. H. Lee, Nanotechnology, 2015, 26, 365102 CrossRef PubMed.
- R. D. Shannon, Acta Crystallogr., Sect. A: Cryst. Phys., Diffr., Theor. Gen. Crystallogr., 1976, 32, 751–767 CrossRef.
- K. Kattel, J. Y. Park, W. Xu, H. G. Kim, E. J. Lee, B. A. Bony, W. C. Heo, J. J. Lee, S. Jin, J. S. Baeck, Y. Chang, T. J. Kim, J. E. Bae, K. S. Chae and G. H. Lee, ACS Appl. Mater. Interfaces, 2011, 3, 3325–3334 CrossRef CAS PubMed.
- G. B. Daecon and R. J. Philips, Coord. Chem. Rev., 1980, 33, 227–250 CrossRef.
- C. B. Mendive, T. Bredow, M. A. Blesa and D. W. Bahnemann, Phys. Chem. Chem. Phys., 2006, 8, 3232–3247 RSC.
- S. J. Hug and D. Bahnemann, J. Electron Spectrosc. Relat. Phenom., 2006, 150, 208–219 CrossRef CAS.
- R. G. Pearson, J. Am. Chem. Soc., 1963, 85, 3533–3539 CrossRef CAS.
- M. K. Corbierre, N. S. Cameron and R. B. Lennox, Langmuir, 2004, 20, 2867–2873 CrossRef CAS.
- D. R. Lide, CRC Handbook of Chemistry and Physics, Internet version 2005, CRC Press, Boca Raton, FL, USA, 2005, pp. 4–57 (7.42 g cm−3; Eu2O3), p. 4–58 (7.07 g cm−3; Gd2O3), p. 4–89 (7.91 g cm−3; Tb2O3): mol% averaged bulk density = 7.49 g cm−3 (x = 0), 7.47 g cm−3 (x = 0.1), 7.42 g cm−3 (x = 0.3), 7.37 g cm−3 (x = 0.5), 7.32 g cm−3 (x = 0.7), 7.27 g cm−3 (x = 0.9), and 7.25 g cm−3 (x = 1) Search PubMed.
- C.-H. Kim, I.-E. Kwon, C.-H. Park, Y.-J. Hwang, H.-S. Bae, B.-Y. Yu, C.-H. Pyun and G.-Y. Hong, J. Alloys Compd., 2000, 311, 33–39 CrossRef.
- A. García-Murillo, C. Le Luyer, C. Dujardin, T. Martin, C. Garapon, C. Pédrini and J. Mugnier, Nucl. Instrum. Methods Phys. Res., Sect. A, 2002, 486, 181–185 CrossRef.
- I. P. Machado, V. C. Teixeira, C. C. S. Pedroso, H. F. Brito and L. C. V. Rodrigues, J. Alloys Compd., 2019, 777, 638–645 CrossRef.
- A. D. Martinis, L. Montalto, L. Scalise, D. Rinaldi, P. Mengucci, C. Michail, G. Fountos, N. Martini, V. Koukou, I. Valais, A. Bakas, C. Fountzoula, I. Kandarakis and S. David, Crystals, 2022, 12, 854 CrossRef.
- T. R. Pisanic II, Y. Zhang and T. H. Wang, Analyst, 2014, 139, 2968–2981 RSC.
- M. Y. Berezin and S. Achilefu, Chem. Rev., 2010, 110, 2641–2684 CrossRef CAS.
- X.-F. Zhang, J. Zhang and L. Liu, J. Fluoresc., 2014, 24, 819–826 CrossRef CAS.
- R. Tang, H. Lee and S. Achilefu, J. Am. Chem. Soc., 2012, 134, 4545–4548 CrossRef CAS.
- J. Xu, C. He, L. Zeng, G. Li, C. Li, H. Lin, J. Liu, L. Zhou, J. Yang and J. Tang, J. Lumin., 2024, 268, 120398 CrossRef CAS.
- S. Li, N. Guo, Q. Liang, Y. Ding, H. Zhou, R. Ouyang and W. Lu, Spectrochim. Acta, Part A, 2018, 190, 246–252 CrossRef CAS PubMed.
- A. N. Carneiro Neto, R. T. Moura Jr., A. Shyichuk, V. Paterlini, F. Piccinelli, M. Bettinelli and O. L. Malta, J. Phys. Chem. C, 2020, 124, 10105–10116 CrossRef CAS.
- H. Lusic and M. W. Grinstaff, Chem. Rev., 2013, 113, 1641–1666 CrossRef CAS.
- S.-B. Yu and A. D. Watson, Chem. Rev., 1999, 99, 2353–2378 CrossRef CAS.
Footnote |
| † Electronic supplementary information (ESI) available: EDS spectra, laser light scattering images, XRD patterns and analyzed data, excitation spectra, UV-visible absorption spectrum, FT-IR absorption peak assignments, CIE (1931) chromaticity coordinates, and PL peak assignments. See DOI: https://doi.org/10.1039/d4nr02195a |
| This journal is © The Royal Society of Chemistry 2024 |

