DOI:
10.1039/D4TA01292E
(Review Article)
J. Mater. Chem. A, 2024,
12, 18733-18750
Recent advances in scanning electrochemical microscopy for probing the sites in electrocatalysts
Received
26th February 2024
, Accepted 21st June 2024
First published on 22nd June 2024
Abstract
The insights into the active sites of catalysts have been providing ideas for efficiently designing highly active and selective catalysts in electrochemical reactions. Therefore, it is of great significance for developing a powerful in situ characterization strategy, which can provide strong evidence and persuasive power in the electrochemical process. Scanning electrochemical microscopy (SECM) has gained increasing attention as a powerful analytical tool for characterizing catalytic activity under in situ conditions. In this review, we summarized the application methods of SECM in electrochemical reactions such as the hydrogen evolution reaction (HER), oxygen evolution reaction (OER), oxygen reduction reaction (ORR), carbon dioxide reduction reaction (CO2RR), and nitrate reduction reaction (NitRR). We also briefly introduced the common operation modes of SECM. The recent progress of SECM in probing the active sites, reaction kinetics and charge transfer of electrocatalysts is reviewed. Finally, we discuss the challenges and prospects of SECM in characterizing the activity of electrocatalysts. This review provides a reference for readers on SECM experimental methods and theoretical analysis.
 Yuqin Zou | Yuqin Zou received her PhD degree in 2017 from the University of Manchester, UK. She is currently a professor at the College of Chemistry and Chemical Engineering, Hunan University. Her research interests are the electrocatalytic conversion of organics and the application of in situ spectroscopy. |
 Juan Peng | Juan Peng is currently a professor at the College of chemistry and chemical engineering, Ningxia University. She received her PhD from Nanjing University in 2012. In 2010, she visited Rice University as a joint doctoral student with Professor P. M. Ajayan. In 2019, she visited Nanyang Technological University as a CSC visiting scholar with Professor Qingyu Yan. Currently, her research interests involve two-dimensional material-based electrocatalysis and electrochemical synthesis. |
1. Introduction
A better understanding of structure/activity relationships and composition/activity is of great significance for efficient design of electrocatalysts.1 As performance is an average effect exhibited by the material during a catalytic reaction, the study of the average activity of the whole system is not sufficient to thoroughly analyze the distinctive properties of a set of catalyst active sites.2 To further visualize the dynamics of morphology evolution and infer their effects on the catalytic performance of the system, it is urgently necessary to investigate the electrocatalyst surface under in situ conditions. In previous studies, the combination of electrochemistry with various in situ spectroscopies, such as X-ray absorption spectroscopy, X-ray photoelectron spectroscopy, Fourier transform infrared (FTIR) spectroscopy, and surface-enhanced Raman spectroscopy, has been widely utilized as a powerful instrument for exploring the catalytic mechanism.3–5In situ spectroscopy and microscopy-based coupling can effectively determine the intermediates in electrochemical reaction processes and the structure and morphology of catalysts. However, the measurement of kinetic rates of electrochemical reactions remains unresolved. In addition, investigating the catalytic performance of electrocatalysts using traditional electrochemical techniques, from catalyst-by-catalyst preparation to catalyst-by-catalyst screening and optimization, not only requires a great deal of work and a long period of time, but also may lead to inaccurate evaluation of results due to the differences in the processes of material synthesis and performance testing. In addition, the wide size distribution, morphology and crystal orientation changes of nanocatalysts may obscure the determination of their catalytic properties. To better understand the relationship between the structure and activity, it is necessary to measure the electrochemical characteristics of individual active sites more clearly and accurately at the nanoscale.
Scanning electrochemical microscopy (SECM) is a type of scanning probe microscopy (SPM) that was introduced by Bard and colleagues in 1989.6,7 Unlike other probing techniques, the tip of the SECM approaches some hundred micrometers even nanometers above the sample without coming into contact with its surface.8 The resolution depends on the tip's size and its distance from the substrate,9 which can be determined by comparing the probe approximation curve with theoretical results.10–12 With the development of nanoelectrodes, SECM can be used for high-resolution imaging at the nanoscale. Ultra-microelectrodes as probes can analyze the morphology and local chemical information of the sample in solution through chemical reactions generated by electrochemically active substances at the probe.13 So far, SECM has been applied to detect the photoelectrochemical reaction (PEC),14–16 the hydrogen evolution reaction (HER),17–24 the oxygen evolution reaction (OER),25–29 the oxygen reduction reaction (ORR),30–35 the CO2 reduction reaction (CO2RR),36–42 and short-lived intermediates.43–45 In these classical electrocatalytic reactions, various working modes of SECM can be used to effectively screen the catalysts and characterize the local electrochemical activity, kinetics, and charge transfer mechanisms of the catalysts.
In recent years, SECM has gained recognition as a strong tool to characterize electrocatalytic activity. The combination with nano-electrodes enables high-resolution imaging at the nanoscale, allowing in situ probing of active sites in two-dimensional materials and nanoparticles, which is a major advantage that distinguishes it from other characterization tools. In this review, we summarize the recent applications for characterizing electrocatalyst activity using SECM in feedback mode, generation collection mode, redox competition mode, and surface interrogation mode. These applications include methods for determining and analyzing reaction kinetics, high throughput screening of catalysts, imaging electrochemical activity, and analyzing local electrochemical activity of single particles, as shown in Fig. 1.
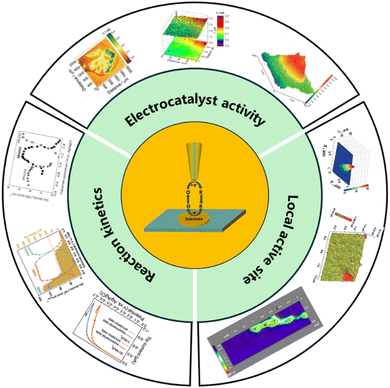 |
| | Fig. 1 Schematic diagram of overview content. | |
2. Operation mode
2.1 Feedback mode
The feedback mode is a common working mode in SECM studies and is widely used in the charge transfer kinetic mechanism of catalysts. In this mode, an ultramicroelectrode (UME) is submerged as a tip in a solution containing a redox medium R. An oxidation potential is applied to the tip, at which time the reaction occurs on the tip as
Since the redox medium is controlled by hemisphere diffusion at the tip electrode, the steady-state current iT,∞ is satisfied as the probe electrode is away from the substrate:
where
F represents the Faraday constant,
n denotes the number of electrons transferred,
D stands for the diffusion coefficient of solution R,
C represents the concentration of the solution R, and
a indicates the radius of the tip electrode. If the substrate is a conductor, it can reduce the oxidation state O to R at the substrate electrode. In this case, during the period when the tip approaches the substrate (
Fig. 2a),
iT >
iT,∞ which is referred to as positive feedback at this point. On the other hand, if the substrate is insulated and blocks diffusion of oxidized medium O between the tip and substrate electrode, then
iT <
iT,∞ as they approach each other. This process is known as negative feedback (
Fig. 2b).
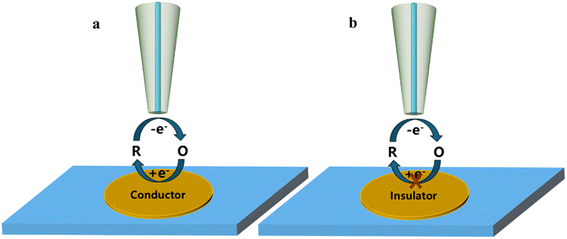 |
| | Fig. 2 Schematic diagram of feedback mode; (a) positive feedback; (b) negative feedback. | |
2.2 Generation/collection mode
In this mode of operation, both the tip and substrate can be used as working electrodes. This mode can be divided into tip generation/substrate collection mode (TG/SC) (Fig. 3a) and substrate generation/tip collection mode (SG/TC) (Fig. 3b) depending on the origin of the electrochemically active species. The SG/TC mode refers to electrochemically active substances generated from the substrate, which then diffuse onto the tip for electrochemical reactions. In this case, the tip current can represent information about the local electrochemical activity on the substrate. On the other hand, in TG/SC, electrochemically active species generated on the tip diffuse to the substrate and undergo electrochemical reactions. The commonly used method for studying local electrochemical information of catalysts in SECM is through using a SG/TC mode. However, the resolution of SECM is closely related to the size of the tip electrode, which requires the tip to be polished fine enough (nano or submicron level) to probe the active site of the catalyst better.
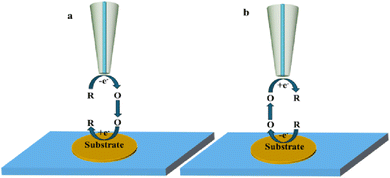 |
| | Fig. 3 Schematic diagram of generation collection mode, (a) tip generation – substrate collection mode; (b) substrate generation – tip collection mode. | |
2.3 Redox competition mode
Fig. 4 illustrates the basic principle of the redox competition mode, which was developed by Schuhmann and colleagues,46 in which the SECM tip and substrate compete together for redox species and undergo the same reaction. When the tip is placed in the inactive region, the current measured using the tip remains constant. When the tip is located in the active region, the substrate and the tip co-consume the redox mediator, at which point the current measured using the SECM tip decreases. The RC mode has significantly lower background current interference and higher sensitivity in catalytic activity measurement.
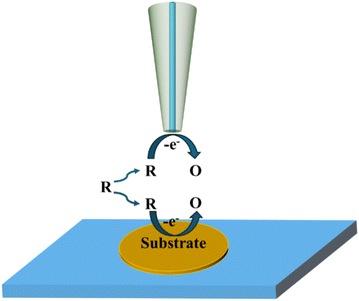 |
| | Fig. 4 Schematic diagram of the redox competition mode. | |
2.4 Surface interrogation mode
Surface interrogation mode was developed by Bard's group in 2008 which is an in situ electrochemical technique based on transient measurement.47 It has been widely applied in recent years for detecting kinetic active sites and surface adsorbents. Since the analyte is produced by one of the electrodes (tip or substrate) and the analyte cannot escape from the tip/substrate gap, two equally sized ultramicroelectrodes are required. The working mode is shown in Fig. 5. In the case where the tip electrode is kept at an open circuit, oxidation potential is first attained by a pulse or scan on the substrate electrode of the base to form absorbed species. And then reduction potential is formed by a pulse or scan on the tip when the substrate electrode is kept at the open circuit, so that the redox medium generates a titrant at the tip, which diffuses through the gap between the substrate and tip and chemically reacts with absorbed substances on the base to form a transient positive feedback loop.
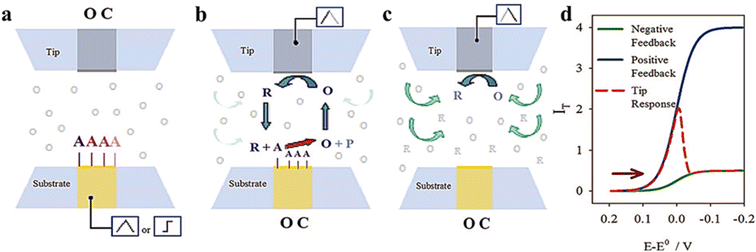 |
| | Fig. 5 Schematic diagram of surface interrogation mode. (a) A reactive species is chemically or electrochemically adsorbed at the substrate upon a potential scan or step while the tip is at an open circuit. (b) The substrate is taken to the open circuit and the tip generates a titrant that reacts at the surface of the substrate to support positive feedback. (c) After consumption of the adsorbate at the substrate, the tip experiences negative feedback. (d) Expected current feedback of the response at the tip electrode. Reproduced from ref. 47 with permission from American Chemical Society, copyright 2008. | |
3. SECM detection of electrocatalytic activity
3.1 Hydrogen evolution reaction
Hydrogen is a promising clean energy source. Therefore, the development of electrocatalysts for the HER is a hot issue. However, efficient electrocatalysts are usually made of precious metals. How to screen and develop earth-rich high-performance electrocatalysts is a key issue. SECM has a unique advantage for in situ characterization of activity of electrocatalysts. The catalytic sites can be visually monitored by the current distribution in SG/TC mode images of SECM.
It was reported that the electrochemical activity of MoS2 and WS2 at the edge exhibits a higher level compared to that on the surface base.48–50 MoS3-δ was prepared by Iffelsberger et al. through electrodeposition on glass carbon plates.51 The heterogeneous surface morphologies of the sediments, as observed in SEM images (Fig. 6a), were consistent with those recorded using feedback mode of SECM. The HER activity of sediments was characterized using SG/TC mode in a 0.5 M H2SO4 electrolyte (Fig. 6b). It can be observed from the figure that there are local variations in structural compositions within the deposited materials, resulting in differences in local HER activity. Novcic et al. prepared MoS2 and WS2 by electrodeposition. These heterojunctions were used to modify the heat-activated 3D-printed nanostructures of carbon.52 The local HER activity of sediments in porous nanocarbon structures was investigated at the cross-section of the nanocarbon electrodes using the SG/TC mode (Fig. 7e and f). In 3D nanostructures, HER active site thickness of MoS2 is about 150 μm and WS2 is about 300 μm. The electrodeposition and subsequent heterojunctions of different transition metal dichalcogenides (TMDs) by electrodeposition of 3D nanocarbon electrodes lead to its active site being located not only on the outer surface but also within internal nanocarbon. Novčić et al.53 analyzed the HER electrochemical properties of MAX-Mo2TiAlC2 from both macroscopic and microscopic perspectives. The macroscopic HER properties were evaluated using LSV, revealing a random distribution of Mo2TiAlC2 particles according to the SECM feedback mode. Subsequently, the SG/TC mode was used to evaluate the HER activity in the same region, which demonstrated an in-homogeneous distribution of highly active sites on individual particles.
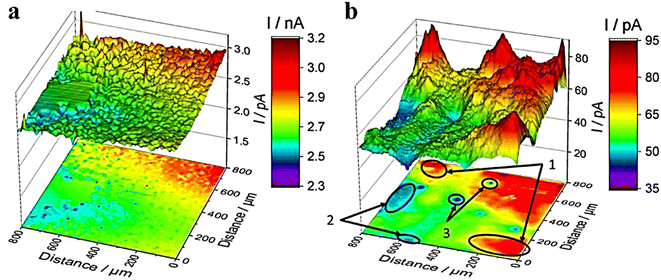 |
| | Fig. 6 SECM imaging of MoS3-δ (a) in feedback mode and (b) in the SG/TC mode. Reproduced from ref. 51 with permission from Elsevier Ltd, copyright 2020. | |
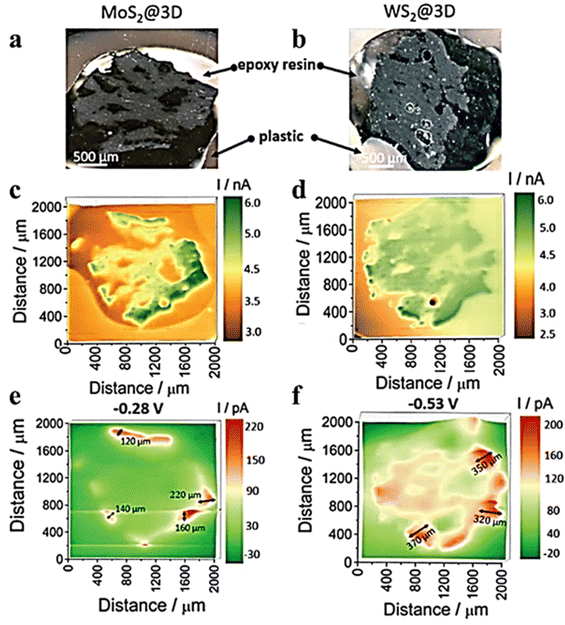 |
| | Fig. 7 Optical images of (a) MoS2@3D and (b) WS2@3D electrode surfaces. SECM images of feedback mode in FcMeOH media solution for (c) MoS2@3D and (d) WS2@3D SECM images recorded of SG/TC mode in 0.5 M H2SO4 solution for (e) MoS2@3D and (f) WS2@3D. Reproduced from ref. 52 with permission from the Royal Society of Chemistry, copyright 2021. | |
SECM also features high-throughput synthesis and electrochemical activity analysis. Liberman et al.54 utilized a tip to induce the conversion of cobalt-based ZIF-67 MOFs into cobalt sulfide substrates (Fig. 8a). Meanwhile, CoSx samples with different S contents could be obtained by regulating the parameters in the electrochemical conversion process. Other than this, the HER properties of the synthesized CoSx substrates could be characterized using the SG/TC mode. When the tip of the needle was positioned over the MOF-converted CoSx region, a distinct ring pattern was observed (Fig. 8b). Furthermore, based on energy-dispersive X-ray spectroscopy (EDS) analysis of SEM and comparison with the surrounding environment (including inside and outside of the converted region), the regions with higher content of CoSx exhibited greater HER activity. In another study, Liberman et al.55 prepared Al2(OH)2-TCPP using tip-induced localized electrodeposition (Fig. 8c). The deposited regions were then imaged for HER activity in the SG/TC mode. The high electrocatalytic HER activity was observed on the deposited regions of Al2(OH)2-TCPP, as shown in the HER activity map (Fig. 8d). However, outside the MOF-patterned region, the activity was significantly weakened because of the alumina coating acting as an insulator on the FTO (conductive glass) surface.
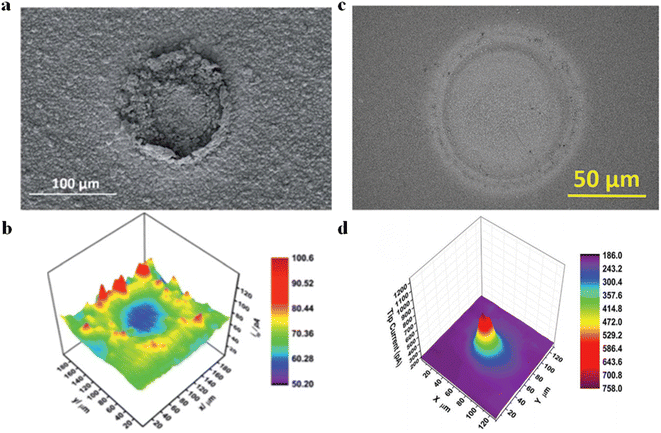 |
| | Fig. 8 (a) SEM images of localized electrochemical MOF transformed CoSx. (b) HER activity imaging of prepared CoSx substrates; reproduced from ref. 54 with permission from the Royal Society of Chemistry, copyright 2019. (c) SEM images of Al2(OH)2-TCPP MOF patterns. (d) HER activity imaging of Al2(OH)2-TCPP MOF. Reproduced from ref. 55 with permission from John Wiley & Sons, copyright 2022. | |
3.2 Oxygen evolution reaction
In SECM, similar to the HER, the SG/TC mode is usually used to characterize the OER activity of the catalyst. In a typical case, oxygen produced by the substrate diffuses to the tip for reduction, and recording the magnitude of the tip current can reflect the OER activity of the catalyst. To increase the OER performance of NiFe LDH, it is crucial to enhance the catalyst's charge transfer ability and stability. The construction of organic and inorganic hybrid materials has been demonstrated as an effective method for combining and creating new physicochemical properties, which enable hybrid materials with improved electrochemical, thermal, and mechanical properties.56 Cai et al. successfully prepared the LDH-polypyrrole (LDH-ppy) hybrid catalyst by interlayer limiting polymerization synthesis and using interlayer anion exchange characteristics of LDH and negatively charged pyrrole-3-carboxylic acid (py).57 LDH-ppy hybrids showed better activity with a low Tafel slope and lower overpotential of the OER (Fig. 9). The in situ AFM-SECM technique was employed to observe the OER activity of LDH-PPY in SG/TC mode with sub-nanometer resolution, thereby providing direct experimental evidence for confirming the beneficial role of conductive polymers in enhancing the catalytic performance of LDH.
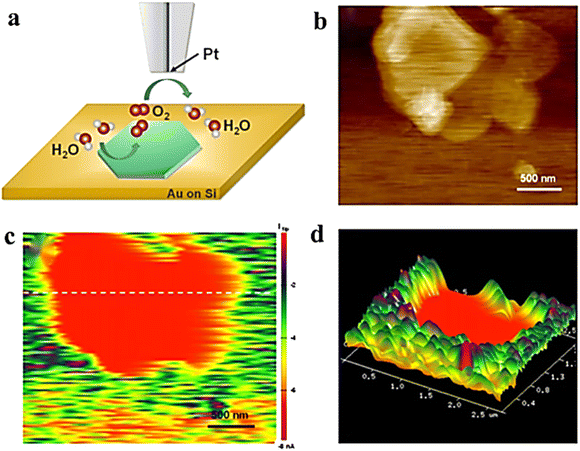 |
| | Fig. 9 (a) Schematic illustration of the SG/TC mode. (b) Height image of AFM. (c) SECM tip current image of LDH-ppy recorded and (d) corresponding 3D image. Reproduced from ref. 57 with permission from American Chemical Society, copyright 2021. | |
3.3 Oxygen reduction reaction
The ORR is a cathodic process in fuel cells and metal–air batteries that has been extensively studied in recent decades.58 When studying the ORR using SECM, the generation collection mode and RC mode are usually employed. In this part, we focus on the application of the RC mode to characterize the ORR activity. In a typical case, the tip and substrate compete for oxygen molecules within the gap, and the magnitude of the recorded tip current demonstrates catalyst activity. Singh et al.59 synthesized CoS2 crystals with (111) and (220) by using trisodium citrate and sodium thiosulfate. The octahedral CoS2 (111) plane has a higher electrocatalytic activity against the ORR. The local activity of CoS2 crystals was also characterized in 0.1 M HClO4 (perchloric acid) using the redox competition mode of SECM, and a decrease in reduction current was observed when the Pt tip was passed through the CoS2 catalyst zone during the scanning process. The decrease in the tip reduction current can be explained by competition between the Pt tip and CoS2 catalyst for dissolved oxygen present in a 10 μm gap and its subsequent reduction to water. As can be seen in Fig. 10a, there is a clear contrast between the catalytic light spot and unmodified glassy carbon electrode (lacking a catalyst). The color spectra of this image vary from blue-green to yellow to red, representing lower-to-higher ORR activity. Moreover, uniform distribution of red on the catalytic spot suggests the presence of active ORR sites. In another study, the bird-feather MnWO4 catalyst was synthesized, and its ORR performance was characterized.60 The catalyst sites synthesized with different concentrations of hydrated trisodium citrate (TSC) were imaged under alkaline conditions in RC-SECM mode (Fig. 10b), which was consistent with the rotating disk electrode (RDE) analysis results. The ORR activity is affected by the substrate potential, indicating that the topography did not significantly contribute but rather the ORR activity itself. Furthermore, under conditions of 10 and 15 mM TSC concentrations, the active sites were evenly distributed at all applied potentials. Moreover, optimum ORR activity was detected at a concentration of 10 mM TSC.
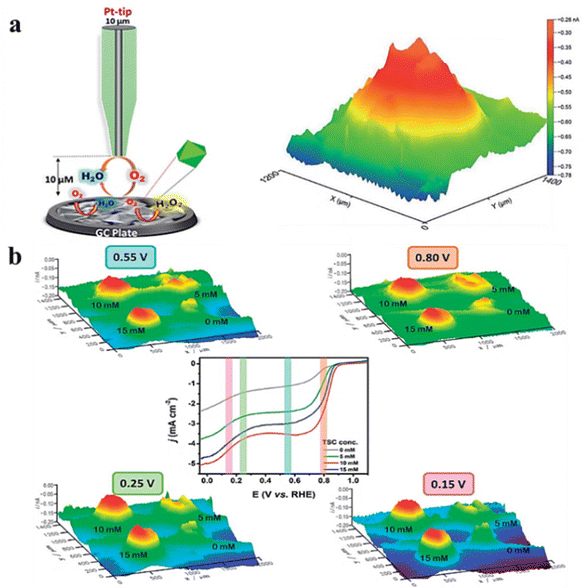 |
| | Fig. 10 (a) Schematic representation of the RC-SECM mode with the 3D image of the local ORR activity for CoS2. Reproduced from ref. 59 with permission from the Royal Society of Chemistry, copyright 2018. (b) 3D images of RC-SECM for MnWO4–BF catalysts synthesized at different applied potentials and different TSC concentrations. Reproduced from ref. 60 with permission from the Royal Society of Chemistry, copyright 2018. | |
3.4 CO2 reduction reaction
The electrocatalytic CO2RR is a current hot topic of research. However, the selectivity of products in the CO2RR remains a challenge due to the involvement of multiple products and competition with the hydrogen evolution reaction. Therefore, when using SECM to study the CO2RR, it is not possible to probe the active site of the catalyst by electrochemical imaging. This is because the oxidation currents of HCOO−, CO and H2 on the probe overlap and it is not possible to distinguish whether the contribution to the current comes from CO2 reduction or is caused by the HER. Currently, the most effective method for studying the CO2RR using SECM is cyclic voltammetry (CV) via tip electrodes in SG/TC mode for product analysis. In this working mode, the probe can react with the products of the CO2RR, and the products will change due to the different performances of the substrate, which will cause changes in the CV curve of the probe. Through these changes, the CO2RR products of the catalyst can be judged, reflecting the performance of the catalyst. However, electrochemical reduction and oxidation of C1 and C2 products (e.g., CH4 and C2H2) at the electrodes are challenging.
Mayer et al.61 prepared an array of three Sn/SnOx catalysts with different shapes through various electroreduction pretreatments and evaluated their activity in the electrocatalytic reduction of carbon dioxide to formate using the SG/TC mode of SCEM. As shown in Fig. 11, the catalysts exhibited the following order of activity for CO2 reduction to formate: Sn/SnOx (−1.25 V) > Sn/SnOx (not reduced) > Sn/SnOx (−3.0 V). Importantly, samples reduced at −1.25 V did not show any wave associated with H2 oxidation, indicating that the electroreduction of carbon dioxide achieved nearly 100% Faraday efficiency for carbon products (HCOO− and CO). This technology is suitable for high-throughput evaluation of the electrocatalytic activity of the different catalysts in the array.
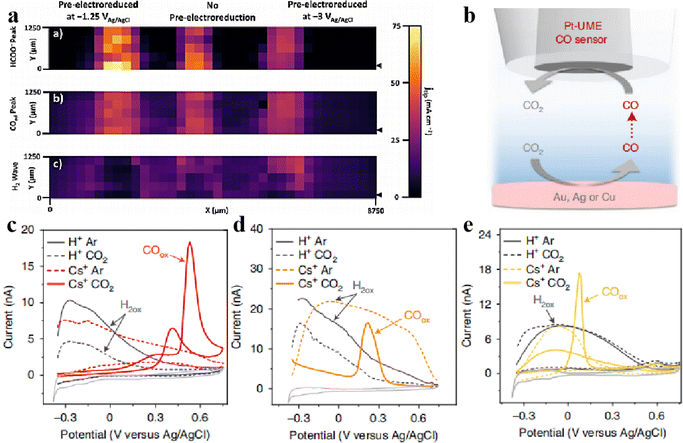 |
| | Fig. 11 (a) Images of tip current densities from CV-SECM scan. Reproduced from ref. 61 with permission from Springer Nature, copyright 2020. (b) SECM measurement scheme and characterization of the electrodes used, and CVs of the Pt-UME obtained directly after CO2 reduction on gold (c), silver (d) and copper (e) electrodes. Reproduced from ref. 41 with permission from Springer Nature, copyright 2021. | |
In the analysis of CO, SECM is more sensitive to detecting CO than other product analysis techniques such as gas chromatography and differential electrochemical mass spectrometry. CO is oxidised to CO2 at the Pt tip as tested by CV, forming a sharp oxidation peak, so SECM can be used as a qualitative tool to detect whether CO is formed. Mariana et al.41 used the SG/TC mode of SECM to detect CO2 reduction at Au, Ag and Cu electrodes in the presence or absence of Cs+ ions in solution by CV cycling using Pt UME as a probe as shown in Fig. 11b–e. This confirmed that CO2 does not undergo reduction reactions on Au, Ag, and Cu electrodes in the absence of metal cations in solution. Only in the presence of Cs+ could the oxidation peak of CO be detected on the Pt probe electrode, confirming that CO2 undergoes reduction reactions on Au, Ag, and Cu electrodes in the presence of Cs+.
Compared to conventional electrochemical tests, SECM offers several notable advantages in the application of the CO2RR. Firstly, its real-time in situ monitoring capability allows for tracking the generation of reaction products and changes in current density, thereby facilitating a better understanding of CO2RR catalyst activity. Secondly, high-throughput screening can be achieved by preparing a catalyst array on the substrate, enabling efficient screening of catalysts with superior performance. Lastly, SECM exhibits high sensitivity for CO2RR product detection typically within the nA range, allowing for reliable detection even at low concentrations of products.
4. Local active sites
Compared with ultra-microelectrodes, nano-electrodes have smaller size and higher spatial resolution. Combined with the SECM SG/TC mode enables obtaining information about the catalytic activity in the microscopic region of a single solid material, which is necessary for the analysis and design of efficient catalysts. The HER of MoS2 with the 2H and 1T phases was investigated by Sun et al.62 The feedback mode ferrocene methanol medium was used to localize the 2H and 1T phases and analyze the differences in electron transfer between them (Fig. 12a), followed by analysis of their corresponding HER activities using the SG/TC mode (Fig. 12b). It was found that the HER activity at the basal surface of the 2H phase was slow, but faster at the edges, while the 1T phase exhibited high HER activity throughout the whole part. Additionally, a study on OER activity of NiO nanosheets (Fig. 12c and d) observed that within a few nanometer wide regions of defects, its OER catalytic activity was significantly higher compared to that of the NiO(111) basal plane.63
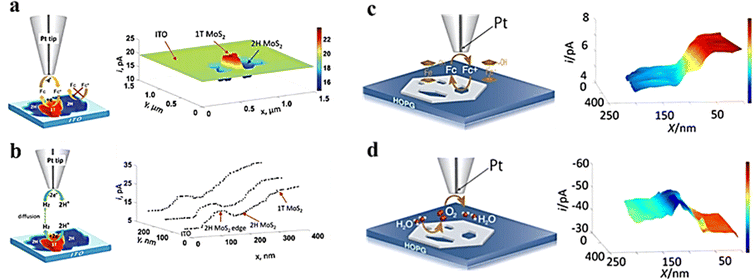 |
| | Fig. 12 (a) Schematic illustration of feedback and image of MoS2 nanosheets on ITO obtained in a ferrocene methanol redox mediator. (b) Schematic illustration of SG/TC and HER current profiles on MoS2 nanosheets. Reproduced from ref. 62 with permission from the Royal Society of Chemistry, copyright 2019. (c) Schematic illustration of feedback and imaging of NiO nanosheets in the ferrocene methanol redox mediator. (d) Schematic illustration of SG/TC mode and OER imaging on NiO nanosheets. Reproduced from ref. 63 with permission from PNAS license, copyright 2019. | |
In a recent study, Gu et al.64 utilized a Pt nano-electrode as a SECM tip to obtain the morphology information of 2H-MoS2 and SV-MoS2 depending on the feedback currents (shown in Fig. 13). The HER activities of the two were investigated by using the SG/TC mode (shown in Fig. 13b, e, and f). For 2H-MoS2, strong HER activity was observed at the sheet edges while the basal surface had a slowed HER rate. On the other hand, several high current spikes were observed in the basal plane region of SV-2H-MoS2 due to hydrogen flux generated by S vacancies. By accurately localizing S vacancies and eliminating interference from other active sites, quantitative HER information including Tafel plots and onset potentials was investigated for S vacancies using Pt nano-electrodes with a radius less than 20 nm.
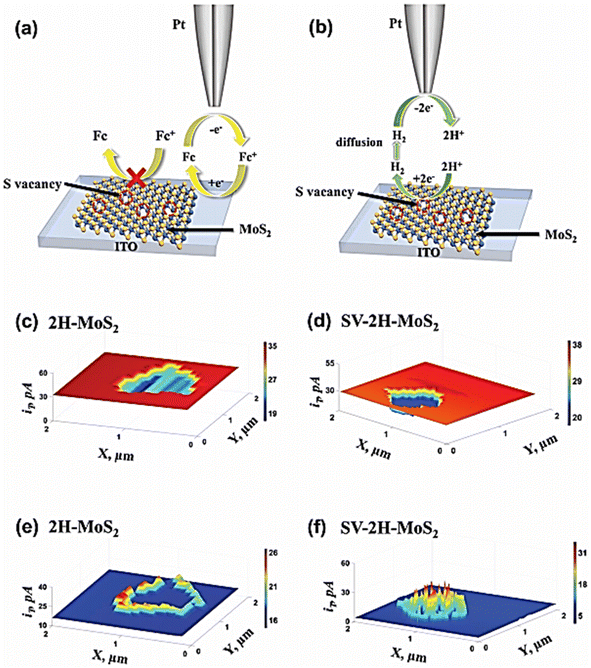 |
| | Fig. 13 Schematic representation of (a) feedback mode and (b) SG/TC mode of SECM on MoS2 samples. SECM feedback mode images of (c) 2H-MoS2 sample and (d) SV-2H-MoS2 on ITO glass obtained with ferrocene methanol redox media. (e) Corresponding SG/TC SECM images of the 2H-MoS2 sample and (f) SV-2H-MoS2 on ITO glass. Reproduced from ref. 64 with permission from John Wiley & Sons, copyright 2023. | |
MXenes, a family of two-dimensional transition metal carbides and nitrides, have demonstrated a number of superior electrochemical properties, including excellent electrocatalytic properties for the HER. These properties were assumed to be derived from active edge sites and basal planes but were not available from macroscopic electrochemical tests.65–70 To investigate the electrochemical activity of individual MXenes, Ti2NTx was prepared using an oxygen-assisted etching method adopted by Djire et al.71 The feedback mode of SECM was used to analyze the reducing ability of MXenes to Fc+, showing semiconductor properties. The HER performance monitored in SG/TC mode confirmed the overall HER activity trend of M-Ti4N3Tx. The HER active sites are mainly on the MXene basal plane. Gao et al.72 obtained a heterostructure of Ni/a-Ni(OH)2 with karst morphology by etching NF with sulfuric acid. EDS analysis revealed that the peaks mainly consisted of hydroxide of Ni, while the valley regions were predominantly composed of metal Ni. The HER/OER activity was separately analyzed using the SG/TC pattern of SECM, as depicted in Fig. 14c and d. The study confirmed that the metal Ni part in the valley region is more advantageous for the HER, whereas the hydroxide in the peak region exhibits OER activity.
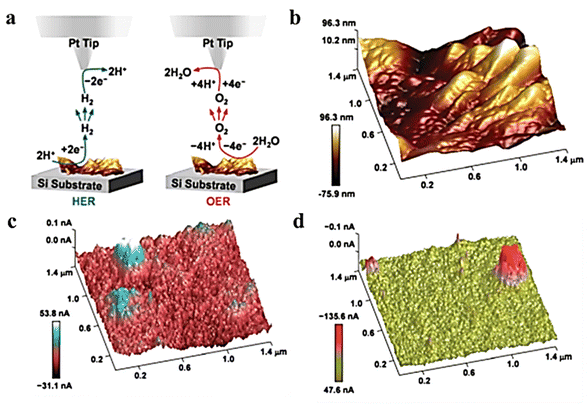 |
| | Fig. 14 (a) The illustration of SG/TC mode. (b) 3D surface topography of karst NF. The 3D electrochemical current profiles for (c) HER and (d) OER captured at a lift height of 120 nm. Reproduced from ref. 72 with permission from the Royal Society of Chemistry, copyright 2020. | |
In recent years, metal nanoparticles (NPs) have become a hot research topic due to their excellent performance in electrocatalysis. The shape, size and orientation of the surface of NPs have a great influence on the catalytic activity and reaction pathways of NPs. In order to investigate the specific effects of these factors on electrocatalysts, Sun et al.,73 using an ultra-small Pt probe, characterized the electrochemical activity of gold nanoparticles with 10 nm and 20 nm by SECM. Single-nanoparticle imaging was achieved in feedback mode (Fig. 15a and c), and the electron transfer at individual NPs was measured. In the SG/TC, mode, the SECM images reflected the HER catalytic sites on the nanoparticles (Fig. 15b and d).
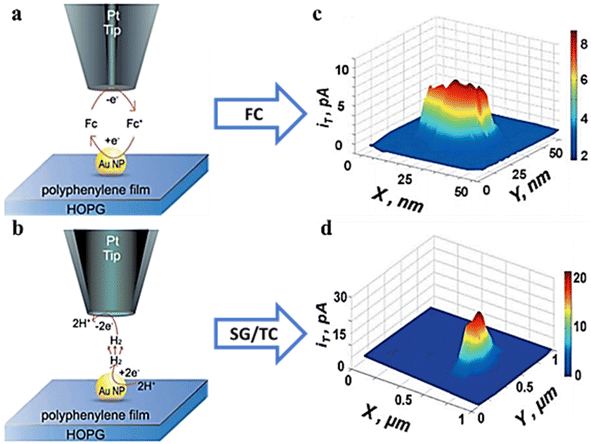 |
| | Fig. 15 (a) Feedback mode. (b) SG/TC at single NPs and the SECM micrograph (c) in feedback mode and (d) in the SG/TC mode. Reproduced from ref. 73 with permission from John Wiley & Sons, copyright 2014. | |
Exploring the relationship between the structure and reactivity of nanoparticles has a great role in the development of more efficient electrocatalysts. However, there are still a number of problems with exploring these intrinsic connections at the individual NP level. Bard's research group74 electrodeposited Pt NPs with radii of 60 nm and 120 nm on highly oriented pyrolytic graphite (HOPG) through nucleation and growth pathways without using capping agents or anchoring molecules. By creating a reliable nano-sized gap between the nanosized SECM tip and the catalyzed Pt NPs, two different types of redox media were used: an outer-sphere electron transfer medium was used to obtain the morphological data (Fig. 16a and c), and an intra-sphere medium (H+) was used to obtain the surface catalytic activity and HOR reaction rate constants (Fig. 16b and d). This work reveals the conformational relationships of metal nanoparticles at high resolution and provides guidance for designing optimal catalysts for various reactions in similar studies.
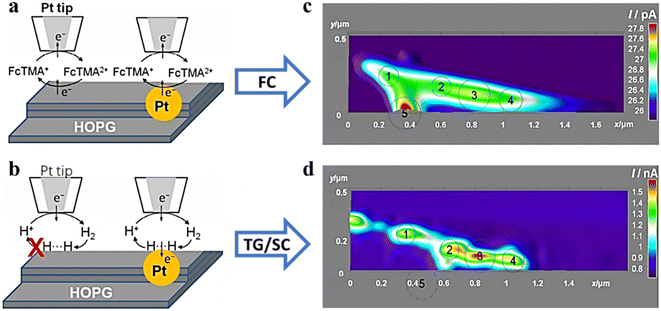 |
| | Fig. 16 SECM schematic representation of (a) feedback mode and (b) SG/TC mode. SECM imaging (c) in feedback mode and (d) in the SG/TC mode. Reproduced from ref. 74 with permission from American Chemical Society, copyright 2016. | |
The properties of NPs depend on their size and geometry, and accurately determining the NP size is crucial to explore their physical and chemical properties. However, it remains challenging to determine the size of nanometer-level ultra-small particles in solution. Ma et al.75 reported the measurement of the size of Pt NPs at nanometre resolution by in situ scanning electrochemical microscopy (SECM), demonstrating that it is possible to prepare Pt NPs down to 1 nm in size by electrode deposition on carbon substrates. A range of different Pt NPs or nanoclusters were electrodeposited and measured in situ in solution, demonstrating that ultra-small nanoparticles can be determined using the probe generation-substrate collection mode of SECM.
5. Reaction kinetics
5.1 OER kinetics
Bard et al.76 adopted the SCEM surface inquiry mode to generate a surface-selective redox titration for NiOOH, FeOOH, and Ni1−xFexOOH (0 < x < 0.27), which allowed them to measure the OER kinetics of the electrode surface. As shown in Fig. 17, TEA-iron compounds are used as redox titrants using two equally sized gold ultraelectrodes. The amount of Ni in NiOOH was insufficient to occur while it exhibited slow OER kinetic behavior. In FeOOH and Ni1−xFexOOH electrodes (x < 0.25), two types of catalytic sites were observed that exhibited “fast” and “slow” OER behavior, respectively. The fraction of “fast” sites in the Ni1−xFexOOH electrode corresponded well with the iron atom content in the film, indicating that these active sites are indeed associated with scattered iron atoms. When the iron content is more than 25%, uncontrolled phase separation of NiOOH and FeOOH was detected in the Ni1−xFexOOH electrode. It has been confirmed that the significant OER catalytic activity in nickel–iron mixed hydroxyl oxides is due to the effect of high-density catalytic sites combined with the rapid OER kinetics of iron catalytic sites in the NiOOH matrix. Recent photo-assisted water oxidation on the surface of hematite revealed discrete sites that have different rate constants on the same catalyst surface using SI-SECM.77,78 However, in order to further improve the OER performance of iron nickel catalysts, higher surface-active sites are needed. For this reason, Barforoush et al.27 reported a microwave-assisted nanocrystalline ferroelectric nickel oxide catalyst and analyzed Ni0.8Fe0.2 by microelectrochemical analysis. Compared with crystal-derived Ni0.8Fe0.2, the catalysts of Ni0.8Fe0.2 exhibit higher current density and lower overpotential. The pseudo-UME of the base was prepared using the masking technique, and the kinetics of the active site of the crystal derived Ni0.8Fe0.2 samples were directly measured in SI-SECM mode. For the surface kinetics of crystal derived Ni0.8Fe0.2, 7% fast sites and 93% slow sites were found as previously proven by Bard et al. However, there is only one fast site in the microwave assisted amorphous Ni0.8Fe0.2.
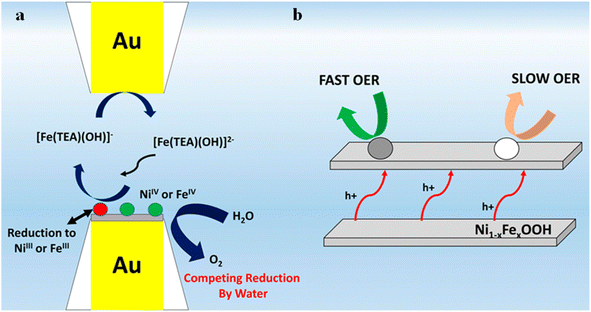 |
| | Fig. 17 (a) Reactions at the tip-substrate gap and (b) schematic illustration of the layered structure and interlayer hole transfer processes of the catalysts with “fast” and “slow” catalytic sites. Reproduced from ref. 76 with permission from American Chemical Society, copyright 2015. | |
Previous studies have shown that water molecules can desorb at high temperatures, and the movement of water and hydroxide anions into and out of the mesosphere is considered to be an important factor in the high activity of LDHs catalyzed by the OER.79,80 However, during the OER electrocatalysis process, nickel oxide undergoes a redox transition from non-conductive Ni(II) species to conductive Ni(III/IV). It is impossible to measure ECSA by traditional voltammetry, and determining the role of interlayer hydroxide ions becomes difficult. To address this issue, Barforoush et al.25 utilized the SCEM surface inquiry mode to directly measure the active site density of Ni0.8Fe0.2OOH LDH and Ni0.8Fe0.2 oxide. The analysis revealed that compared to Ni0.8Fe0.2 oxide, Ni0.8Fe0.2OOH LDH exhibited a 10-fold increase in the density of active sites. This suggests that water and hydroxides in the mesosphere can generate stable Ni(IV)/Fe(IV) active species in the layer beneath the electrode/electrolyte interface. Electrolyte permeability is also a significant factor contributing to its enhanced catalytic activity.
In order to detect the actual oxidation state of the centers of MnOx and CaMnO3 manganese in amorphous OER catalysts in amorphous or perovskite oxides, Jin et al.81 utilized the surface inquiry mode of SCEM to titrate electrodeposited MnOx and CaMnO3 in two different redox media (Fig. 18a). The figure illustrates the plot of charge density and base potential drawn by MnOx as a titration agent for IrCl62−/3−, with the dashed line representing the total charge of Mn(III) and Mn(IV). However, it takes a second leap when the base potential exceeds 1.16 V (Fig. 18b), suggesting that a higher oxidation state of Mn is generated in this process, which accounts for Mn(V). Additionally, the relationship between the valence state and the potential of Mn is also provided. Mn(V) is found in SI-SECM of CaMnO3 produced at about 1.1 V (Fig. 18c). Through time-delayed SI-SECM analysis of the OER kinetics of Mn(V), it is found that Mn(V) acts as the active site for the OER in both structures but exhibits different kinetic behaviors. There are two dynamic sites, fast and slow, in MnOx, while CaMnO3 only shows one dynamic behavior. Bard et al.82 utilized ferrocene methanol and K2IrCl6 as redox agents to independently titrate the surface of Co(III) and Co(IV), measuring the density of catalytically active sites on the surface. The time-titration method was used to measure the pseudo first-order reaction rate of Co(III), Co(IV), and water. Simultaneously, the exact OER turnover frequency (TOF) of cobalt atoms was evaluated.
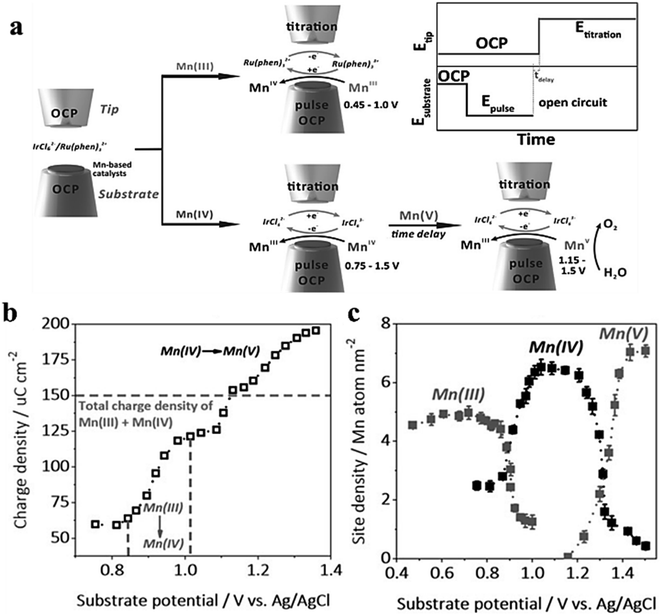 |
| | Fig. 18 (a) SECM schematic representation of the SI-SECM mode. (b) The integrated charge density plotted against substrate potential. (c) Site density of Mn(III), (IV) and (v). Reproduced from ref. 81 with permission from John Wiley & Sons, copyright 2020. | |
5.2 HER kinetics
Ni and its alloys have gained much attention as a non-precious metal catalyst and show excellent HER performance in alkaline environments. However, there is a lack of reliable in situ methods to directly measure the coverage of hydrogen intermediates at the electrode/electrolyte interface. Additionally, the oxidation of Ni in water media makes it difficult to distinguish the “true” HER current from the overlapping electrochemical reduction of oxides in polarization curves, further complicating the correlation of intrinsic activity and adsorption energy.83 In order to address these challenges, Liang et al.84 extracted the “true” cathode current associated with the HER from the total current in polarization curves using SG/TC mode (Fig. 19). Since water dissociative adsorption is enhanced at the interface between Ni and Ni oxides, the HER activity of the catalyst is improved in the presence of low-valent Ni oxides compared to Ni. Additionally, SI-SECM mode is utilized to directly measure the coverage of absorbed hydrogen on Ni at a given potential. Simulation results indicate that the hydrogen coverage follows the Frumkin isotherm with respect to the applied potential. Based on a joint analysis of the Tafel slope and surface hydrogen coverage, the rate-determining step within the studied potential window is hydrogen adsorption (Volmer).
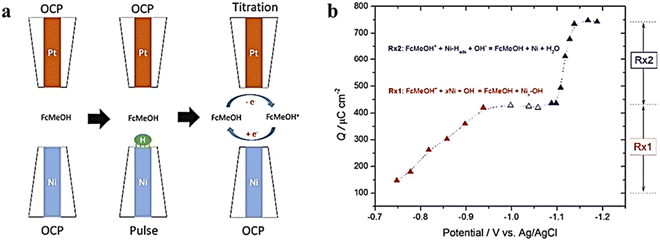 |
| | Fig. 19 (a) SECM schematic representation of the SI-SECM mode, and (b) plot of charge density vs. Esub. Reproduced from ref. 84 with permission from American Chemical Society, copyright 2017. | |
In previous studies, the HER activity of those catalysts containing sulfur vacancies (strained or unstrained) has been explained in terms of the thermodynamics of their hydrogen adsorption energy, while little is known about the kinetics of these S vacancies on the MoS2 surface.85 Li et al.86 created and stretched a monolayer of MoS2 with S-vacancies on a gold substrate. The kinetic data for unstretched and stretched S-vacancies on the monolayer MoS2 substrate were determined using the SG/TC mode, as seen in Fig. 20. The kinetic data of hydrogen oxidation reactions on V-MoS2 and SV-MoS2 were simulated using COMSOL simulation software, where kv0 = 2.3 × 10⁻⁴ cm s−1 and ksv0 = 1.0 × 10⁻³ cm s−1. It is confirmed that the electron transfer rate constant increases by nearly four times with a uniaxial tensile strain of about 2%. This confirms that the tensile elastic strain accelerates HER kinetics of S-vacancies in MoS2.
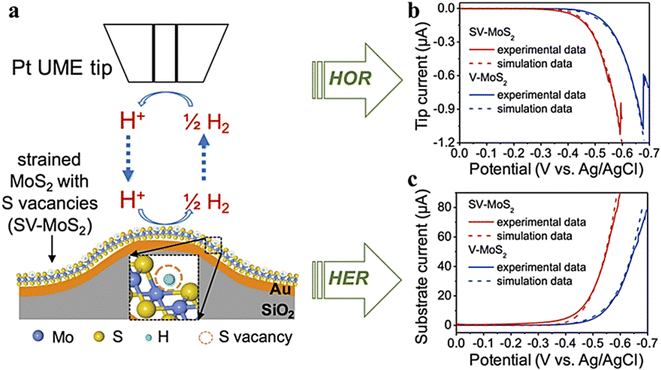 |
| | Fig. 20 (a) Schematic illustration of the SG/TC mode, (b) Pt tip and V-MoS2, (c) Pt tip and SV-MoS2 substrate voltammograms and the corresponding simulation results (dashed lines) in 0.1 M HClO4 electrolyte. Reproduced from ref. 86 with permission from American Chemical Society, copyright 2016. | |
5.3 NitRR kinetics
Single-atom catalysts (SACs) are a family of metal catalysts that are atomically dispersed on a solid carrier, combining the advantages of non-homogeneous and homogeneous catalysts with unique activity and selectivity.87–90 However, due to the very low metal loading of SACs, most spectra do not provide localization analysis of the catalytic site behavior or address the measurement of kinetic rates.91 Recently, in an electrochemical nitrate reduction reaction, Li et al.92 reported a single-atom iron-based catalyst and demonstrated a polymer-hydrogel strategy for preparing nitrogen-ligated iron sites with homogeneous atomic dispersion on carbon. This catalyst exhibited nearly 100% selectivity for ammonia production. To investigate the kinetic behavior of the relevant redox species, the authors analyzed the site density of the single-site iron fraction with a dynamic oxidation state at a given potential using SI-SECM in a time-dependent manner. As shown in Fig. 21a, the catalyst was used as a substrate electrode, Pt-UME was used as a tip electrode, and the solution containing ferrocene ethanol was used as the redox mediator with potassium hydroxide as the supporting electrolyte. Fig. 21b illustrates the charge recorded by the tip for different potentials based on the integration of the current–time titration curve. Two distinct jumps, Fe(III) → Fe(II) and Fe(II) → Fe(0) reduction, indicate a transition in oxidation states at their respective potentials. The kinetic behavior of the HER and NitRR was separately measured using SI-SECM. According to the titration results, at 0 V, the Fe sites were not reduced to a metallic state. However, no nitrate reduction signal was observed at such a positive potential. A time-delayed titration of Fe(II) and Fe(0) in nitrate solutions revealed that both monatomic Fe(II)–Nx and Fe(0)–Nx can react with nitrate due to decay of the Fe concentration over time before producing titrates at the tip. In contrast, the catalytic activity of the transition state for Fe NPs does not depend on delay time. Furthermore, nitrate adsorption only occurred when surface-bound Fe(0) was formed. No reaction between water and either monoatomic or nanoparticle catalysts containing Fe(II) was observed in nitrate-free potassium hydroxide solutions; however, water dissociation induced by Fe(0) occurred in both Fe-PPy SACs and Fe NPs.
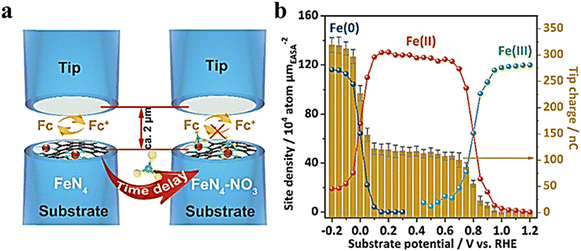 |
| | Fig. 21 (a) Schematic of the SI-SECM setup. (b) Electrochemically active surface area (ECSA)-normalized active site density and corresponding titration charges of the Fe-PPy SACs plotted against different potentials. Reproduced from ref. 92 with permission from the Royal Society of Chemistry, copyright 2021. | |
5.4 ORR kinetics
Jin et al.93 determined the site density of active Fe atoms in Fe SACs using SI-SECM and plotted it against the sites determined by STEM for the electrochemical ORR process. Subtle differences were observed between the site density determined by SI-SECM and the calculated numbers. The activity of sites intrinsic to Fe SACs was further evaluated by SI-SECM, and the active site densities of Fe SACs were determined at 0.8 V and 0.85 V. Based on the kinetic currents normalized by the number of active Fe sites, TOF has a significant relationship with these sites (Fig. 22). Specifically, when the distance between sites is less than 1.2 nm, there is a strong interaction between Fe–N4 components that alters their electronic structure and leads to an increase in intrinsic ORR activity. In addition, the site properties continue to increase significantly closer to the neighboring Fe atoms at 0.7 nm, following which their intrinsic activity tends to decrease.
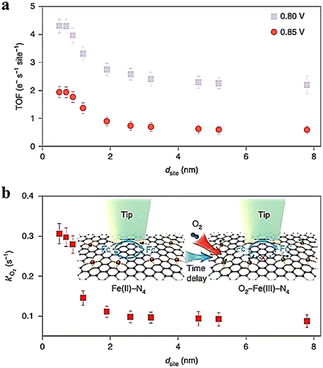 |
| | Fig. 22 (a) The imaging of TOF at 0.85 and 0.80 V, (b) time-delay SI-SECM titration imaging and the reaction rate constant (k′ of O2) for O2 binding on Fe(III)–N4 sites. Reproduced from ref. 93 with permission from Springer Nature, copyright 2021. | |
6 Conclusion and perspectives
In this review, we summarize the advances in SECM for probing electrocatalytic activity and screening catalysts in the HER, OER, ORR, CO2RR, and NitRR processes. Overall, SECM is a powerful in situ characterization tool for studying catalyst activity as well as reaction kinetics and charge transfer kinetics in electrochemical techniques. SECM can realize the determination of the electrochemical properties of a sample through the reaction of electrochemically active substances on the probe while providing localized information with high spatial and temporal resolution. However, there are still some issues that need to be addressed, which we summarize as follows and for which we propose possible solutions.
(1) The combination of nano-electrode technology can enhance the spatial resolution of SECM to achieve a more detailed study of the catalysts. This can deeply investigate the active sites on the individual level of the catalysts and obtain information on their sizes, shapes, and spatial orientations, which will provide a guideline for designing the structure–performance relationship of the catalysts. However, there are still many challenges. The major one is the spatial and temporal resolution, which is limited by the size of the tip and the distance between the tip and the sample. The need for higher resolution requires finer electrode sizes, which are influenced by the environment including table vibrations, noise, electromagnetic interference, convection, ambient temperature, and humidity variations. These can also affect the effectiveness of the test. Correspondingly, the working distance of the tip is shortened, which places greater demands on the substrate factors such as the flatness, size and area of the sample, the degree of dispersion, and the positioning of the sample. The time resolution is mainly influenced by the scanning speed of the tip during the test. The exploration of manufacturing smaller-sized probes and the search for methods to achieve more uniform catalyst loading on the electrode surface are imperative in response to these challenges.
(2) In the CO2RR system, the characterization mode of catalyst activity is relatively single. At present, the products HCOO− and CO are widely detected by cyclic voltammetry and the timing current method. The analysis of polycarbon products has not been reported in the literature. And due to the complexity of the product, the in situ characterization of the local activity of the catalyst and the activity imaging analysis of a single entity cannot be performed by electrochemical activity imaging methods. Beyond this, methods to study CO2RR dynamics using SECM have not been reported. It is expected to establish reliable experimental methods and kinetic models for the CO2RR in future studies. To address the complexity of CO2RR products, different materials of UME can be explored to respond differently to different products, thereby distinguishing the products accordingly.
(3) In the future, it is still important to improve the high spatio-temporal resolution of SECM testing. Improving the sensitivity of the instrument and the manufacturing technology and repeatability of the nanoelectrode are conducive to improving the resolution of SECM. In the analysis of products, the combination of other spectral technologies is a major trend of future development, such as infrared spectroscopy, Raman spectroscopy, etc., which can widely analyze the activity of catalysts and the selectivity of products.
Author contributions
Jie Li: conceptualisation and writing – original draft; Heng Yang: writing – original draft; Xiaofeng Gu: writing – original draft; Yuqin Zou: review and editing and project administration; Dongping Zhan: review and editing; Juan Peng: conceptualisation, project administration, supervision, writing, review and editing.
Conflicts of interest
There are no conflicts to declare.
Acknowledgements
The authors gratefully acknowledge the financial funding from the National Natural Science Foundation of China (No. 22262027, 22132003, and 22122901).
References
- D. T. Jantz and K. C. Leonard, Ind. Eng. Chem. Res., 2018, 57, 7431–7440 CrossRef CAS.
- H. Mistry, A. S. Varela, S. Kühl, P. Strasser and B. R. Cuenya, Nat. Rev. Mater., 2016, 1, 16009 CrossRef CAS.
- A. D. Handoko, F. Wei, Jenndy, B. S. Yeo and Z. W. Seh, Nat. Catal., 2018, 1, 922–934 CrossRef CAS.
- X. Li, S. Wang, L. Li, Y. Sun and Y. Xie, J. Am. Chem. Soc., 2020, 142, 9567–9581 CAS.
- Y. Yang, Y. Xiong, R. Zeng, X. Lu, M. Krumov, X. Huang, W. Xu, H. Wang, F. J. DiSalvo and J. D. Brock, ACS Catal., 2021, 11, 1136–1178 CrossRef CAS.
- A. J. Bard, F. R. F. Fan, J. Kwak and O. Lev, Anal. Chem., 1989, 61, 132–138 CrossRef CAS.
- J. Kwak and A. J. Bard, Anal. Chem., 1989, 61, 1221–1227 CrossRef CAS.
- J. Kim, C. Renault, N. Nioradze, N. Arroyo-Curras, K. C. Leonard and A. J. Bard, Anal. Chem., 2016, 88, 10284–10289 CrossRef CAS PubMed.
- S. C. Lai, J. V. Macpherson and P. R. Unwin, MRS Bull., 2012, 37, 668–674 CrossRef CAS.
-
A. J. Bard and M. V. Mirkin, Scanning Electrochemical Microscopy, CRC Press, 2012 Search PubMed.
- R. Cornut, M. Mayoral, D. Fabre and J. Mauzeroll, J. Electrochem. Soc., 2010, 157, F77 CrossRef CAS.
- R. Cornut, S. Poirier and J. Mauzeroll, Anal. Chem., 2012, 84, 3531–3537 CrossRef CAS PubMed.
-
W. Schuhmann and M. Bron, in Polymer Electrolyte Membrane and Direct Methanol Fuel Cell Technology, Elsevier, 2012, pp. 399–424 Search PubMed.
- Z. Yu, Q. Huang, X. Jiang, X. Lv, X. Xiao, M. Wang, Y. Shen and G. Wittstock, Anal. Chem., 2021, 93, 12221–12229 CrossRef CAS PubMed.
- X. Li and S. Pan, Anal. Chem., 2021, 93, 15886–15896 CrossRef CAS PubMed.
- Y. Ma, P. S. Shinde, X. Li and S. Pan, ACS Omega, 2019, 4, 17257–17268 CrossRef CAS PubMed.
- H. S. Ahn and A. J. Bard, Anal. Chem., 2017, 89, 8574–8579 CrossRef CAS PubMed.
- X.-R. Li, Q.-H. Zhang, X.-Z. Meng, L.-K. Wu and F.-H. Cao, Corros. Sci., 2021, 191, 109726 CrossRef CAS.
- K. C. Leonard and A. J. Bard, J. Am. Chem. Soc., 2013, 135, 15890–15896 CrossRef CAS PubMed.
- G. Li, T. Sun, H. J. Niu, Y. Yan, T. Liu, S. Jiang, Q. Yang, W. Zhou and L. Guo, Adv. Funct. Mater., 2023, 33, 2212514 CrossRef CAS.
- D. Jasion, J. M. Barforoush, Q. Qiao, Y. Zhu, S. Ren and K. C. Leonard, ACS Catal., 2015, 5, 6653–6657 CrossRef CAS.
- H.-J. Niu, Y. Yan, S. Jiang, T. Liu, T. Sun, W. Zhou, L. Guo and J. Li, ACS Nano, 2022, 16, 11049–11058 CrossRef CAS PubMed.
- S. Kumar, P. K. Sahoo and A. K. Satpati, ACS Omega, 2017, 2, 7532–7545 CrossRef CAS PubMed.
- H. S. Ahn and A. J. Bard, J. Phys. Chem. Lett., 2016, 7, 2748–2752 CrossRef CAS PubMed.
- J. M. Barforoush, T. E. Seuferling, D. T. Jantz, K. R. Song and K. C. Leonard, ACS Appl. Energy Mater., 2018, 1, 1415–1423 CrossRef CAS.
- B. Konkena, J. Masa, A. J. R. Botz, I. Sinev, W. Xia, J. Koßmann, R. Drautz, M. Muhler and W. Schuhmann, ACS Catal., 2016, 7, 229–237 CrossRef.
- J. M. Barforoush, D. T. Jantz, T. E. Seuferling, K. R. Song, L. C. Cummings and K. C. Leonard, J. Mater. Chem. A, 2017, 5, 11661–11670 RSC.
- M. Steimecke, G. Seiffarth and M. Bron, Anal. Chem., 2017, 89, 10679–10686 CrossRef CAS PubMed.
- J. Lorenz, M. Yu, H. Tuysuz, C. Harms, A. Dyck and G. Wittstock, J. Phys. Chem. C, 2020, 124, 7737–7748 CrossRef CAS.
- A. Tiwari, V. Singh, D. Mandal and T. C. Nagaiah, J. Mater. Chem. A, 2017, 5, 20014–20023 RSC.
- Q. Zhang, P. Liu, Z. Zhu, J. Zhang and F. Cao, Corros. Sci., 2020, 164, 108312 CrossRef CAS.
- L. Ma, H. Zhou, Y. Sun, S. Xin, C. Xiao, A. Kumatani, T. Matsue, P. Zhang, S. Ding and F. Li, Electrochim. Acta, 2017, 252, 338–349 CrossRef CAS.
- B. Sidhureddy, S. Prins, J. Wen, A. R. Thiruppathi, M. Govindhan and A. Chen, ACS Appl. Mater. Interfaces, 2019, 11, 18295–18304 CrossRef CAS.
- P. Li, Z. Jin, Y. Qian, Z. Fang, D. Xiao and G. Yu, ACS Energy Lett., 2019, 4, 1793–1802 CrossRef CAS.
- S. Xin, Z. Liu, L. Ma, Y. Sun, C. Xiao, F. Li and Y. Du, Nano Res., 2016, 9, 3795–3811 CrossRef CAS.
- C. I. Shaughnessy, D. T. Jantz and K. C. Leonard, J. Mater. Chem. A, 2017, 5, 22743–22749 RSC.
- M. Steimecke, A. M. Araújo-Cordero, E. Dieterich and M. Bron, ChemElectroChem, 2021, 9, 922–934 RSC.
- M. Michalak, A. Roguska, W. Nogala and M. Opallo, Nanoscale Adv., 2019, 1, 2645–2653 RSC.
- D. Filotás, T. Nagy, L. Nagy, P. Mizsey and G. Nagy, Electroanalysis, 2017, 30, 690–697 CrossRef.
- N. Sreekanth, M. A. Nazrulla, T. V. Vineesh, K. Sailaja and K. L. Phani, Chem. Commun., 2015, 51, 16061–16064 RSC.
- M. C. O. Monteiro, F. Dattila, B. Hagedoorn, R. García-Muelas, N. López and M. T. M. Koper, Nat. Catal., 2021, 4, 654–662 CrossRef CAS.
- N. Sreekanth and K. L. Phani, Chem. Commun., 2014, 50, 11143–11146 RSC.
- T. J. Stockmann, J.-M. Noël, S. Ristori, C. Combellas, A. Abou-Hassan, F. Rossi and F. Kanoufi, Anal. Chem., 2015, 87, 9621–9630 CrossRef CAS PubMed.
- M. Zhou, Y. Yu, K. Hu and M. V. Mirkin, J. Am. Chem. Soc., 2015, 137, 6517–6523 CrossRef CAS.
- J.-M. Noël, A. Latus, C. Lagrost, E. Volanschi and P. Hapiot, Am. Chem. Soc., 2012, 134, 2835–2841 CrossRef PubMed.
- K. Eckhard, X. Chen, F. Turcu and W. Schuhmann, Phys. Chem. Chem. Phys., 2006, 8, 5359–5365 RSC.
- J. Rodriguez-Lopez, M. A. Alpuche-Aviles and A. J. Bard, J. Am. Chem. Soc., 2008, 130, 16985–16995 CrossRef CAS PubMed.
- C. L. Bentley, M. Kang, F. M. Maddar, F. Li, M. Walker, J. Zhang and P. R. Unwin, Chem. Sci., 2017, 8, 6583–6593 RSC.
- C. L. Bentley, M. Kang and P. R. Unwin, J. Am. Chem. Soc., 2019, 141, 2179–2193 CrossRef CAS PubMed.
- B. Tao, P. R. Unwin and C. L. Bentley, J. Phys. Chem. C, 2019, 124, 789–798 CrossRef.
- C. Iffelsberger, S. Ng and M. Pumera, Appl. Mater. Today, 2020, 20, 100654 CrossRef.
- K. A. Novcic, C. Iffelsberger, S. Ng and M. Pumera, Nanoscale, 2021, 13, 5324–5332 RSC.
- K. A. Novčić, C. Iffelsberger and M. Pumera, J. Mater. Chem. A, 2022, 10, 3206–3215 RSC.
- I. Liberman, W. He, R. Shimoni, R. Ifraemov and I. Hod, Chem. Sci., 2020, 11, 180–185 RSC.
- I. Liberman, R. Ifraemov, R. Shimoni and I. Hod, Adv. Funct. Mater., 2022, 32, 2112517 CrossRef CAS.
- N. Feng, R. Meng, L. Zu, Y. Feng, C. Peng, J. Huang, G. Liu, B. Chen and J. Yang, Nat. Commun., 2019, 10, 1372 CrossRef PubMed.
- M. Ju, R. Cai, J. Ren, J. Chen, L. Qi, X. Long and S. Yang, ACS Appl. Mater. Interfaces, 2021, 13, 37063–37070 CrossRef CAS PubMed.
- M. Shao, Q. Chang, J. P. Dodelet and R. Chenitz, Chem. Rev., 2016, 116, 3594–3657 CrossRef CAS PubMed.
- V. Singh, A. Tiwari and T. C. Nagaiah, J. Mater. Chem. A, 2018, 6, 22545–22554 RSC.
- A. Tiwari, V. Singh and T. C. Nagaiah, J. Mater. Chem. A, 2018, 6, 2681–2692 RSC.
- F. D. Mayer, P. Hosseini-Benhangi, C. M. Sánchez-Sánchez, E. Asselin and E. L. Gyenge, Commun. Chem., 2020, 3, 155 CrossRef CAS PubMed.
- T. Sun, H. Zhang, X. Wang, J. Liu, C. Xiao, S. U. Nanayakkara, J. L. Blackburn, M. V. Mirkin and E. M. Miller, Nanoscale Horiz., 2019, 4, 619–624 RSC.
- T. Sun, D. Wang, M. V. Mirkin, H. Cheng, J. C. Zheng, R. M. Richards, F. Lin and H. L. Xin, Proc. Natl. Acad. Sci. U. S. A., 2019, 116, 11618–11623 CrossRef CAS PubMed.
- C. Gu, T. Sun, Z. Wang, S. Jiang and Z. Wang, Small Methods, 2023, 7, 2201529 CrossRef CAS PubMed.
- A. D. Handoko, K. D. Fredrickson, B. Anasori, K. W. Convey, L. R. Johnson, Y. Gogotsi, A. Vojvodic and Z. W. Seh, ACS Appl. Energy Mater., 2017, 1, 173–180 CrossRef.
- Z. W. Seh, K. D. Fredrickson, B. Anasori, J. Kibsgaard, A. L. Strickler, M. R. Lukatskaya, Y. Gogotsi, T. F. Jaramillo and A. Vojvodic, ACS Energy Lett., 2016, 1, 589–594 CrossRef CAS.
- J. Zhang, Y. Zhao, X. Guo, C. Chen, C.-L. Dong, R.-S. Liu, C.-P. Han, Y. Li, Y. Gogotsi and G. J. N. C. Wang, Nat. Catal., 2018, 1, 985–992 CrossRef CAS.
- Z. Guo, J. Zhou, L. Zhu and Z. Sun, J. Mater. Chem. A, 2016, 4, 11446–11452 RSC.
- J. Ran, G. Gao, F. T. Li, T. Y. Ma, A. Du and S. Z. Qiao, Nat. Commun., 2017, 8, 13907 CrossRef CAS PubMed.
- D. Er, J. Li, M. Naguib, Y. Gogotsi and V. B. Shenoy, ACS Appl. Mater. Interfaces, 2014, 6, 11173–11179 CrossRef CAS PubMed.
- A. Djire, X. Wang, C. Xiao, O. C. Nwamba, M. V. Mirkin and N. R. Neale, Adv. Funct. Mater., 2020, 30, 2070313 CrossRef CAS.
- X. Gao, Y. Chen, T. Sun, J. Huang, W. Zhang, Q. Wang and R. Cao, Energy Environ. Sci., 2020, 13, 174–182 RSC.
- T. Sun, Y. Yu, B. J. Zacher and M. V. Mirkin, Angew. Chem., Int. Ed., 2014, 53, 14120–14123 CrossRef CAS PubMed.
- J. Kim, C. Renault, N. Nioradze, N. Arroyo-Curras, K. C. Leonard and A. J. Bard, J. Am. Chem. Soc., 2016, 138, 8560–8568 CrossRef CAS PubMed.
- W. Ma, K. Hu, Q. Chen, M. Zhou, M. V. Mirkin and A. J. Bard, Nano Lett., 2017, 17, 4354–4358 CrossRef CAS PubMed.
- H. S. Ahn and A. J. Bard, J. Am. Chem. Soc., 2016, 138, 313–318 CrossRef CAS PubMed.
- J. Y. Kim, H. S. Ahn and A. J. Bard, Anal. Chem., 2018, 90, 3045–3049 CrossRef CAS PubMed.
- M. R. Krumov, B. H. Simpson, M. J. Counihan and J. Rodriguez-Lopez, Anal. Chem., 2018, 90, 3050–3057 CrossRef CAS PubMed.
- A. I. Khan and D. O'Hare, J. Mater. Chem., 2002, 12, 3191–3198 RSC.
- Y. Zhang, B. Cui, C. Zhao, H. Lin and J. Li, Phys. Chem. Chem. Phys., 2013, 15, 7363–7369 RSC.
- Z. Jin and A. J. Bard, Angew. Chem., Int. Ed., 2021, 60, 794–799 CrossRef CAS PubMed.
- H. S. Ahn and A. J. Bard, J. Am. Chem. Soc., 2015, 137, 612–615 CrossRef CAS PubMed.
- P. Quaino, F. Juarez, E. Santos and W. Schmickler, Beilstein J. Nanotechnol., 2014, 5, 846–854 CrossRef PubMed.
- Z. Liang, H. S. Ahn and A. J. Bard, J. Am. Chem. Soc., 2017, 139, 4854–4858 CrossRef CAS PubMed.
- H. Li, C. Tsai, A. L. Koh, L. Cai, A. W. Contryman, A. H. Fragapane, J. Zhao, H. S. Han, H. C. Manoharan and F. J. N. M. Abild-Pedersen, Nat. Mater., 2016, 15, 48–53 CrossRef CAS PubMed.
- H. Li, M. Du, M. J. Mleczko, A. L. Koh, Y. Nishi, E. Pop, A. J. Bard and X. Zheng, J. Am. Chem. Soc., 2016, 138, 5123–5129 CrossRef CAS PubMed.
- A. Wang, J. Li and T. Zhang, Nat. Rev. Chem., 2018, 2, 65–81 CrossRef CAS.
- X.-F. Yang, A. Wang, B. Qiao, J. Li, J. Liu and T. J. Zhang, Acc. Chem. Res., 2013, 46, 1740–1748 CrossRef CAS PubMed.
- Z. Fang, P. Li and G. Yu, Adv. Mater., 2020, 32, 2003191 CrossRef CAS PubMed.
- Y. Guo, J. Bae, Z. Fang, P. Li, F. Zhao and G. Yu, Chem. Rev., 2020, 120, 7642–7707 CrossRef CAS PubMed.
- Z. Jin, P. Li, Z. Fang and G. Yu, Acc. Chem. Res., 2022, 55, 759–769 CrossRef CAS PubMed.
- P. Li, Z. Jin, Z. Fang and G. Yu, Energy Environ. Sci., 2021, 14, 3522–3531 RSC.
- Z. Jin, P. Li, Y. Meng, Z. Fang, D. Xiao and G. Yu, Nat. Catal., 2021, 4, 615–622 CrossRef CAS.
Footnote |
| † These authors contributed equally to the work. |
|
| This journal is © The Royal Society of Chemistry 2024 |
Click here to see how this site uses Cookies. View our privacy policy here.  *b,
Dongping
Zhan
 c and
Juan
Peng
 *a
*a


