Ultra-wide band near-infrared (NIR) optical thermometry (12–673 K) performance enhanced by Stark sublevel splitting in Er3+ ions near the first biological window in the PbZr0.53Ti0.47O3:Er3+/Yb3+ phosphor†
Received
7th August 2024
, Accepted 20th November 2024
First published on 21st November 2024
Abstract
The fluorescence intensity ratio (FIR) approach, which relies on thermally coupled levels (TCLs), is significantly important for optical thermometry at room temperature and above, but was found to be impractical for low temperature sensing due to limited population density (thermal) or lack of spectrum at extremely low temperatures. Herein, we report a wide temperature range (12–673 K) sensing capability of the PbZr0.53Ti0.47O3:Er3+/Yb3+ (C1:PZT) phosphor utilising the bandwidth of Stark sublevel split near-infrared (NIR) emission bands as one sensing parameter and FIR as another. Motivated by our previous studies on upconversion (UC) and the promising thermometry performance of the C1:PZT phosphor for real time nanothermometer monitoring (using visible TCLs), this work extends to the same thermometry application using UC-NIR emission as TCLs. The temperature-dependent UC spectra were measured across the ranges of 12–313 K and 313–673 K under 980 nm excitation, and their sensing capabilities were thoroughly evaluated. An enveloped single emission band, comprising multiple peaks in the NIR region, was observed and subsequently deconvoluted using Gaussian fitting. These individual peaks were analyzed in relation to Stark sublevel splitting, which was particularly evident at 12 K, and the variations in their full width at half maximum (FWHM) were compared across temperatures up to 313 K. Based on the temperature-dependent bandwidth, two prominent peaks ∼11![[thin space (1/6-em)]](https://www.rsc.org/images/entities/char_2009.gif) 655 cm−1 (858 nm) and 11454 cm−1 (873 nm), were identified as TCL levels, and a sensitivity (Sr) of 0.68 ± 0.01% K−1 at 673 K was observed, making it a suitable thermometer for reading low temperatures using NIR bands.
655 cm−1 (858 nm) and 11454 cm−1 (873 nm), were identified as TCL levels, and a sensitivity (Sr) of 0.68 ± 0.01% K−1 at 673 K was observed, making it a suitable thermometer for reading low temperatures using NIR bands.
1. Introduction
The advancement of optical thermometry in the biophotonics window (including NIR-I & NIR-II) is practically limited in the region between 700 nm and below 1300 nm and has drawn considerable attention from researchers due to exceptional spatial resolution and deep tissue penetration capability.1,2 Potential phosphor materials such as organic dyes,3 quantum dots, semiconductors,3 and rare-earth (RE3+) ion-doped nanocrystals4,5 have been extensively explored for various applications, including optical nanothermometry in the Near-Infrared I (NIR-I) region. Among these, NIR-I emitting RE ion-doped phosphors stand out due to their excellent photostability, resistance to photobleaching, tunable emission profiles, and extended fluorescence decay times. These properties make them highly desirable for applications requiring durable and reliable luminescent probes. However, a key challenge with NIR-I emitting RE-doped phosphors is the temperature and doping concentration-dependent quenching of fluorescence intensity. This quenching is often linked to cross-relaxation (CR), inefficient energy transfer (ET) mechanisms, and other energy dissipation pathways inherent to RE3+ doping. In contrast, several studies have reported instances of suppressed NIR-II emissions6,7 in comparison to NIR-I emissions,8 with conclusions indicating that minimizing energy dissipation pathways can significantly enhance emission efficiency. Further studies have shown that coating of NaGdF4:Nd3+@NaGdF4 nanocrystals9 with a passivating layer of NaGdF4 of appropriate thickness can lead to notable improvements in NIR-II emission. Similar findings suggest that the application of various coatings on RE-doped core–shell structures can enhance overall NIR-II emissions by reducing surface quenching and improving energy transfer efficiency.10,11 These conclusive improvements in NIR-II emitting phosphors differ partially from those of NIR-I emitting phosphors. Furthermore, extensive studies8–12 have been conducted on UC luminescence emissions in the NIR-I (700–1000 nm) region compared to the NIR-II region, owing to its specific applications. Recently, Wang et al. reported excellent NIR-NIR temperature sensing via TCL variation of Tm3+ in a layered polarizing host.13 They utilized Tm3+ doped anisotropic Bi7F11O5 nanosheets (layered polarizing host) to achieve wavelength selective and intense NIR-I (800 nm) UC luminescence. Typically, RE-doped TCL band emitters produce broad NIR-I emissions, which can be advantageous in some applications due to the broader spectral coverage. However, sharp NIR-I emissions, such as the 808 nm band, are particularly valuable for laser applications; for instance, the 808 nm emission from TCL can serve as an input wavelength for Nd:YAG lasers. In our previous study,14 we investigated UC emission and optical thermometry of Er3+/Yb3+:PZT across a temperature range of 313–673 K, revealing interesting NIR emissions with TCL variation. The performance of this flexible thin-film thermometer, composed of Er3+/Yb3+:PZT on a PDMS substrate, was validated through visible green and reddish emission bands, highlighting its potential for accurate temperature measurement in electronic devices. These findings, particularly the temperature-dependent NIR emissions, underscore the potential for further exploration of its sensing properties. Dong et al.15 presented related work, demonstrating NIR-NIR thermometry using Tm3+-based thermometers that exploit Stark transitions of the 3H4 sublevels. According to research by Lili Xing et al.,16 the host's crystal structure is correlated with spectral splitting, i.e. the degree of splitting is proportional to sensitivity (Sr) within 323–773 K. In the majority of publications on NIR thermometry insights on either Er3+ or Tm3+ ion doped phosphors, especially at room temperature, and in the low temperature range, the sensitivity is explained using Stark sublevels. The present work on the C1:PZT (Er3+/Yb3+:PZT) phosphor represents a novel approach, aiming to correlate Stark level splitting with NIR thermometry, while also enabling low-temperature measurements with Er3+ ions within a single phosphor sample.
As a continuation of our previous study, this work will examine the NIR-to-NIR optical thermometry performance of Er3+/Yb3+:PZT phosphor (C1:PZT)14 samples. The choice of doping PZT with Er3+/Yb3+ ions, optimization and concentration quenching has been elaborated in our previous studies.14,17–19 In particular, in the morphotropic phase boundary region i.e. the PbZr0.53Ti0.47O3 composition, the coexistence of both tetragonal (PT) and rhombohedral (PZ) crystal phases endows PZT with exceptional hosting capabilities and enhanced piezoelectric properties. These properties peak around the MPB due to abrupt changes in crystal symmetry, as discussed in our earlier works.14,18,19 This study employs two strategic approaches to derive its conclusions: (1) conducting absolute sensitivity analyses of (C1:PZT) samples14 across a broad temperature range (313–673 K) with NIR-I emission; (2) the overall performance of optical thermometry based on UC emission (NIR-I) in relation to TCL change is discussed on the basis of low perturbation crystal field introduction and Stark splitting. To the extent of our understanding, this report emphasizes the importance of explaining closely spaced NIR bands, which were identified using a parametric model. The deconvoluted bands were then used for wide-range temperature sensing, with FWHM/FIR as the sensing parameter. The multiplet splitting of Er3+ ion energy levels into (2J + 1)/2 Stark components due to small perturbations is analyzed based on FIR and sensitivity calculations. Because the variation in these NIR bands with temperature could not be defined within a single calibration, three distinct temperature regions were individually calibrated using the FIR to calibrate NIR emissions and address these limitations. This study follows a systematic approach, beginning with the identification and deconvolution of upconverted NIR emission bands, utilizing a parametric model and Gaussian distribution to account for Stark splitting within the Er3+ ion. Subsequently, absolute and relative sensitivities are calculated based on the FIR of Stark-split emission bands, specifically the 4S3/2(II) → 4I13/2 transition at 875 nm (i = 4) and the 4S3/2(II) → 4I13/2 transition at 897 nm (i = 9), across a wide temperature range. With this method, a sensitivity calibration curve may be predicted with NIR emitting upconverted bands. Moreover, these results also comply with absolute and relative sensitivity with excellent stability throughout the calibrating region.
2. Experimental
2.1 Synthesis
The optimized phosphor, designated as C1:PZT, was prepared using a low temperature assisted combustion route described in our previous work.14 The UC optimization studies were performed, and the concentration of Erx3+/Yby3+ ratio i.e. (x = 0.3 mol% and y = 3.0 mol%) was found to be suitable for performing NIR-NIR temperature sensing studies. It should be noted that the concentration of Yb3+ ions was kept at 3.0 mol% due to the optimized concentration ratio (10:1) for efficient energy transfer, as already demonstrated in our previous studies.14,17,18,20,21 The final C1:PZT powder sample was first made into a dispersed solution in toluene and then coated using a spin-coating unit from POLOS (SPS POLOS-SPIN150-Standard), Germany, on an electronic printed circuit board (PCB) from Novastar, Alibaba Corp., China for measuring the temperature of the electronic counterpart. Detailed NIR temperature sensing studies for real time optical thermometry (thin film thermometer) were conducted, examining both absolute and relative sensitivity. For this purpose, the authors have prepared a solution by dispersing C1:PZT powder in approximately 20 mL of ethanol. The phosphor solution (SOL) was coated onto a p-type Si-wafer (100) using a spin-coating technique. After dispensing the solution onto the horizontal substrate, it was spun at 2500 rpm for 30 seconds to create a thin gel film, allowing excess liquid to evaporate quickly. The resulting film was then heat-treated at 900 °C for 1 hour in a muffle furnace. Finally, the prepared thin-film Si substrate underwent UC temperature sensing performance evaluation.
2.2 Characterization
The structural and optical characterization of the optimized C1:PZT sample, including X-ray powder diffraction (XRPD) with Rietveld analysis, UV-vis spectroscopy, and UC measurements, has been detailed in our previous work.14 The room temperature UC emission spectra indicated that the NIR emission bands vary in a power-dependent manner, suggesting a correlation with thermally coupled level (TCL) bands. Consequently, NIR optical thermometry was performed using a different setup, as detailed below: temperature fluctuations were measured with a heating–cooling vacuum/gas stage (MHCS600, Microptik Instruments), which offers a temperature adjustment range of 100 to 870 K with 0.1 K stability. Additionally, a resistive temperature detection sensor and a K-type hybrid thermocouple sensor were employed for accurate temperature readings. Approximately 100 to 300 accumulations of UC emission spectra were recorded at each stage, once the probe reached thermodynamic equilibrium, in order to minimize the signal-to-noise ratio (SNR) (Signal/Noise - 2N). The UC emission data were collected using a spectrograph (FLS F980, Edinburgh instruments), connected to a Hamamatsu R931 PMT and a InGaAs 1.7 DU490A high-resolution detection system. For rapid optical thermometry measurement, a fiber-coupled spectrometer from the Avantes (AvaSpec-650) low resolution detection system was used to measure the emission spectra.
3. Results and discussions
3.1 X-ray powder diffraction analysis
The powder XRD profile of the optimized C1:PZT (Er3+/Yb3+:PZT) sample confirms the formation of rhombohedral crystal symmetry with the (R3m) space group from profiles of PbZrTiO3 (JCPDS #732022), as mentioned in our previous work.14 The Rietveld refinement was also conducted for the formed phases and crystal structural parameters mentioned in detail in our earlier report. For convenience, the powder XRD patterns for the PbZr0.53Ti0.47O3:Er3+/Yb3+ (C1:PZT) samples are provided in the ESI,† as Fig. S1.
3.2 Discussion
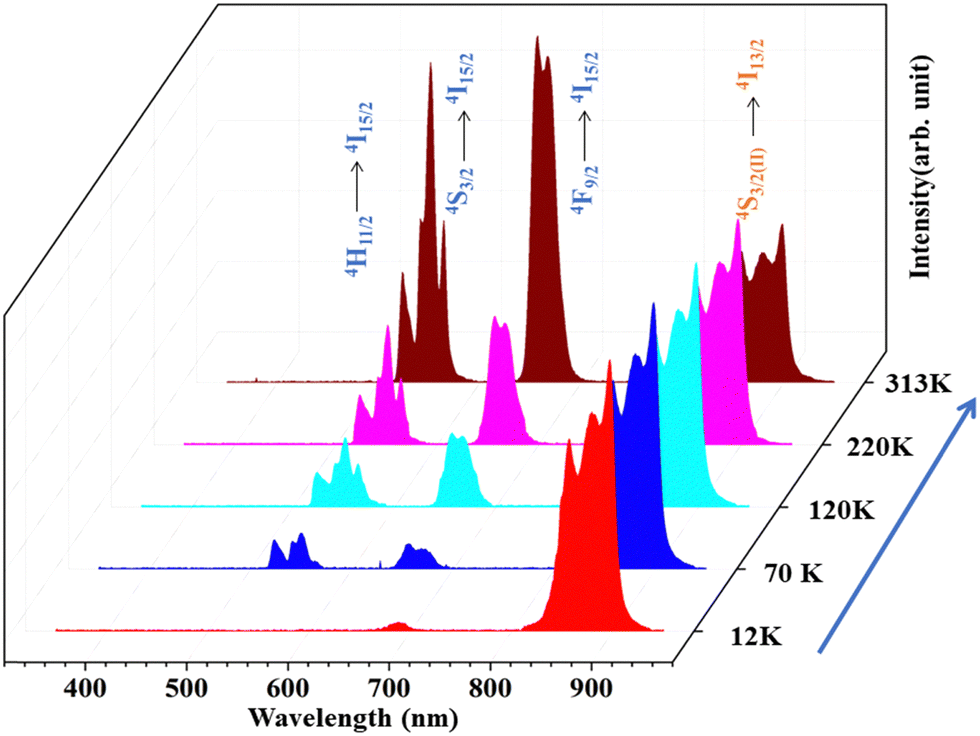
The UC emission spectrum of the C1:PZT phosphor at 313 K with 980 nm excitation (∼35 mW cm−2) is shown in Fig. 1 and 2, respectively. It is evident that the phosphor displays a wide array of NIR emission bands consisting of different narrow intense peaks. Splitting of the 4S3/2(II) level of Er3+ into seven Stark sublevels in the PZT crystal field has been established by the UC mechanism depicted in the inset of Fig. 1 using a low temperature (12 K) narrow spectrum.
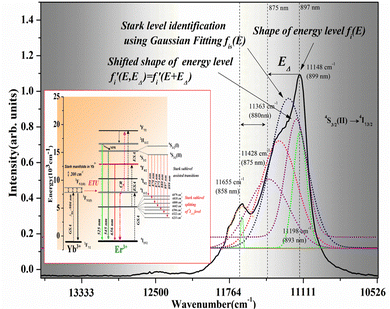 |
| | Fig. 1 UC emission spectrum of the C1:PZT phosphor at 313 K, with 980 nm excitation. The inset displays the possible UC mechanism responsible for the NIR emission process, for accommodating Stark sublevel splitting 4S3/2(II) (j) (j = 1, 2, 3, 4, 5, 6 and 7) of the Er3+ ion. | |
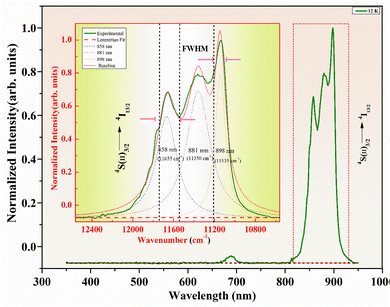 |
| | Fig. 2 UC emission spectra of the C1:PZT phosphor at 12 K, with 980 nm excitation. The zoomed red region displays the UC spectrum at 12 K within the range of 810–940 nm (12345–10638 cm−1). | |
We observed three primary emission bands, with centers at ∼11655 cm−1 (858 nm), 11350 cm−1 (881 nm), and 11135 cm−1 (898 nm) as shown in Fig. 2. With temperature variations, the bands shift to 11494 cm−1 (870 nm), 11454 cm−1 (873 nm), 11428 cm−1 (875 nm), and 11123 cm−1 (898 nm) as shown in Fig. 1 with deconvolution using Gaussian fitting. These are the results of transitions from Stark sublevels 4S3/2(II) to 4I13/2(i) (i = 7, 6, 5, 4, 3, 2, and 1). With an increase in temperature from room temperature up to 673 K, these transitions exhibit a well-defined upconversion (UC) luminescence variation, resulting in notable FIR sensitivity across the thermally coupled luminescence (TCL) bands.
The C1:PZT phosphor's temperature sensing behaviour was investigated by measuring the UC spectra in the 12–300 K range, which (at 12, 70, 120, 220 and 313 K) are shown in Fig. 3. Throughout the studies, the excitation power was limited to reduce the photo-thermal effect. It is noteworthy that there is a considerable correlation between temperature and the intensity of luminescence, as well as the bandwidths. The increase in bandwidths can be attributed to the increase in electron–phonon interaction22 occurring in the temperature range of 12–313 K.
 |
| | Fig. 3 UC emission spectra of the C1:PZT phosphor with 980 nm excitation (35 mW cm−2) at different temperatures (12 K, 70 K, 120 K, 220 K and 313 K). | |
Interestingly, the Boltzmann relationship in FIR based optical thermometry is correlated with the temperature dependent FWHM22,23 of the emission bands and can be expressed in a simplified equation,23
here,
A and
R0 are the fitting constants used where
T indicates the absolute temperature and Δ
ν0 is the bandwidth. It is observed that among different Stark sublevel emission bands, these two bands at 11
655 cm
−1 (858 nm) and 11
454 cm
−1 (873 nm) are likely to be thermally coupled bands, which led us to show interest in their thermometry behaviour. Thus, the FWHM of the emission bands at 11
655 cm
−1 (858 nm) and 11
454 cm
−1 (873 nm) may be represented as a function of temperature,
| | | Δν11454 = 17 + 2.9exp(1.05 × 10⁻²T) | (2) |
| | | Δν11123 = 11 + 5.1exp(7.15 × 10⁻³T) | (3) |
The FWHMs of these two TCL emission bands, 11655 cm−1 (858 nm) and 11454 cm−1 (873 nm), are shown in Fig. 4(a) and (b). Simultaneously, the FIR of these bands originated due to Stark splitting from very low temperature to room temperature (12–313 K), as shown in Fig. 4(c).
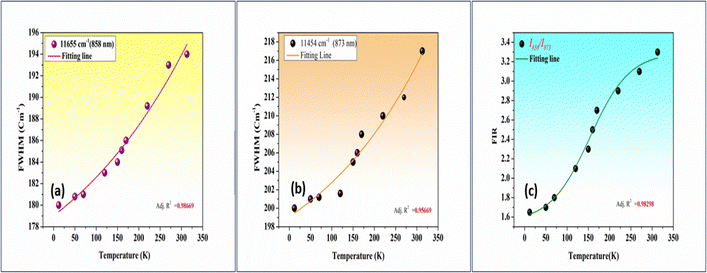 |
| | Fig. 4 The full width at half maximum (FWHM) of (a) 11655 cm−1 (858 nm) and (b) 11454 cm−1 (873 nm) bands as a function of temperature and (c) FIR of 11655 cm−1 (858 nm) and 11454 cm−1 (873 nm) emission bands as a function of temperature (cryogenic to room temperature). | |
To detect an accurate temperature utilising the present sample in the NIR region, the UC spectra (∼NIR region) of C1:PZT with the strongest emission intensity at different temperatures within the range from 313 to 673 K were recorded and are shown in Fig. 5.
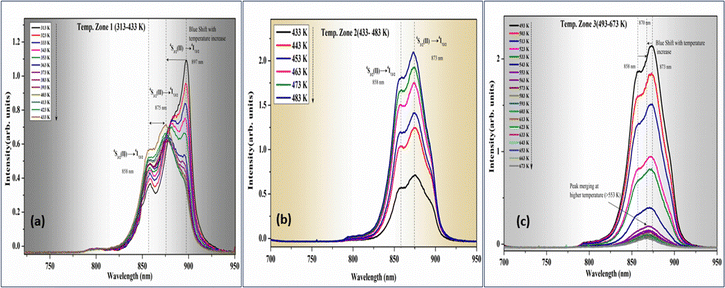 |
| | Fig. 5 Stark level splitting assisted UC emission (NIR region) of the C1:PZT phosphor sample in wide temperature regions (a) temp. zone 1 (313–433 K), (b) temp. zone 2 (443–483 K), and (c) temp. zone 3 (493–673 K), under 980 nm excitation. | |
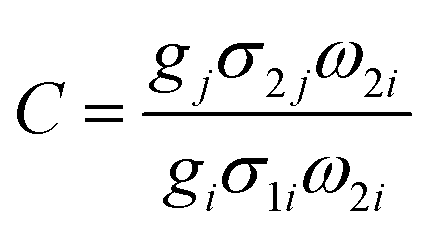
Three temperature regions were divided and the sensing behaviour was observed in the NIR region to be similar to our previous study,14 where sensing behaviour was studied in the visible region. The main reason for the distinctive three temperature region can be interpreted as UC emission peaks (three major transitions) showing either an incremental or decremental nature with temperature variation which is unique. Therefore, to calculate sensitivity in a wide temperature region, three temperature regions with distinctive incremental or decremental natures are reported. In practice, the UC based FIR technique utilizes the intensity ratio variation to measure sensitivity, which is advantageous and does not rely on the incremental/decremental nature. The FIR variation between 4S3/2(II) → 4I13/2(i=4) (875 nm) and 4S3/2(II) → 4I13/2(i=9) (λem = 897 nm) i.e. Stark energy level transitions of the Er3+ ion established the basis of dual mode temperature sensing if we consider (2H11/2/4S3/2 → 4I15/2) transitions in the visible region as another TCL pair from the same sample. Moreover, the following transitions, 4S3/2(II) → 4I13/2(Er3+) and 2F5/2 → 2F7/2(Yb3+) achieve normalization at 899 nm and 979 nm, resulting in an inverse nature of UC emission with temperature in the 4S3/2(II) → 4I13/2(Er3+ion) transition. The energy level difference between TCLs of Er3+i.e.4S3/2(II) and 4S3/2(I) is around 250 cm−1, which is under the suitable range (200–2000 cm−1) for excellent sensing using the TCL pair referred to. However, the 4S3/2(II) → 4I13/2 transitions have greater probability of relative population gathering, which makes the transitions being referred to, 11655 cm−1 (858 nm) and 11454 cm−1 (873 nm) emissions, that originated due to Stark level splitting, a suitable TCL pair. The Boltzmann relationship governs the relationship between the relative population of TCLs and FIR, and can be described as,
| | 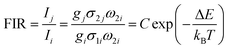 | (4) |
where

is the proportionality constant and Δ
E is the energy difference between the TCLs;
kB (0.6950 cm
−1 K
−1) is the Boltzmann constant,
T is the absolute temperature, and
g,
σ, and
ω are the degeneracy, emission cross-section, and angular frequency of the fluorescence transitions from the upper (
j) to lower level (
i), respectively. The aforementioned formula may be expressed as a linear equation as follows:
| |  | (5) |
| | | ln(FIR) = −B(1/T) + lnC | (6) |
where
B = Δ
E/
k.
Fig. 6 illustrates the FIR variation with incremental temperature of the sample.
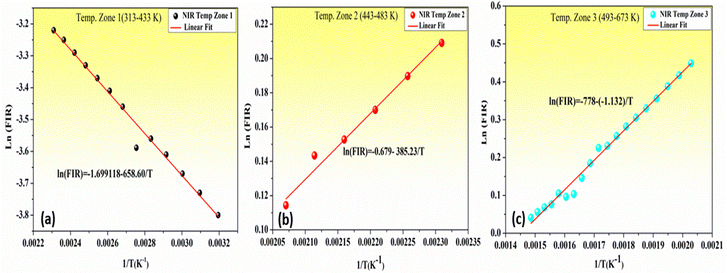 |
| | Fig. 6 Experimental and fitted FIR vs. temperature plots for the NIR emission in (a) temp. zone 1 (313–433 K), (b) temp. zone 2 (443–483 K), and (c) temp. zone 3 (493–673 K). | |
When ln(FIR) is fitted linearly to 1/T, the slope is B = ΔE/k, and the intercept is ln(C). The slope and intercept, which represent the proportionality constant (C) and ΔE value for each of the three temperature zones shown in Fig. 6(a), (b), and (c), respectively, were derived by fitting the experimental data. Here,  is the proportionality constant that depends on g, σ, and ω, which are the degeneracy, emission cross-section, and angular frequency of the two levels involved in the occurrence of transitions.
The fitting of temperature zones (1), (2), and (3) yielded values of C and ΔE. Accordingly, they are 1.1699, 658.60 ± 2.31 cm−1, 0.679 ± 0.15, 385.23 ± 1.29 cm−1, and 7.78 ± 0.29 and −1.132 ± 10 cm−1.
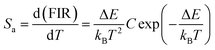
It is now possible to determine the material's sensitivity by deriving from eqn (4). As we have previously reported, the relationship may generally be used to analyze two types of sensitivity: absolute and relative. However, when using it in a real-world thermometer for sensing purposes, the absolute sensitivity (Sa) is more crucial,
| |  | (7) |
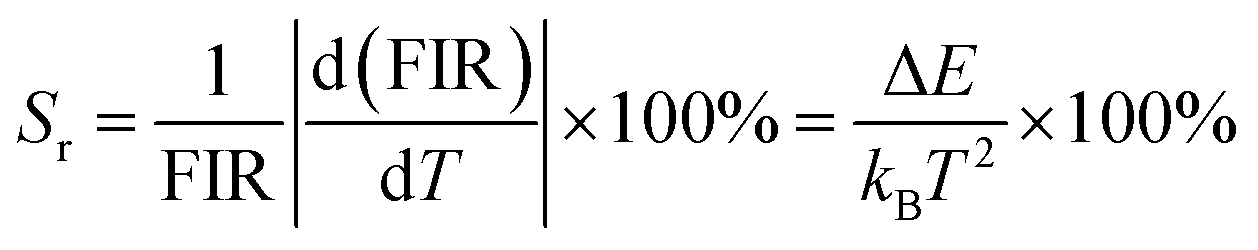
However, the relative thermal sensitivity (Sr), is used to compare the performance of various thermometers and can be written in the formula as,
| | 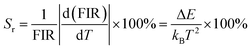 | (8) |
where Δ
E is in cm
−1,
kB is in cm
−1 per K and
T is in K. According to
eqn (8),
Sr is proportionally correlated with the energy difference between the TCL energy levels. However, energy levels that are energetically too far apart should be avoided, as chances of thermalization loss in this situation will be lower. Additionally, the upper thermalizing level depopulates and the emission intensity increases with the energy difference between the levels. It may not be feasible to measure very low intensity signals, which would not be economically viable as per the detection system. The Eu
3+ ion as a thermal probe
24 has shown its potential as an optical nanothermometer with identical
Sr values that can operate at various temperature ranges including 180 K (
7F
0 →
7F
1)
i.e. in cryogenic, 300 K (
7F
0 →
7F
2)
i.e. in physiological, and even in further temperature ranges using (
7F
0 →
7F
3) transitions because of its suitable energy difference among
7F
J energy levels.
In our previous study14 we demonstrated that Er3+ ions can be used efficiently using the green (2H11/2/4S3/2 → 4I15/2) TCL emission bands for thermometry within an extensive temperature range (313–673 K). In the current study, we further explore the capability of Er3+ ions to operate at different temperature ranges, such as the cryogenic near 12 K (4S3/2(II) → 4I13/2), the physiological near 313 K and beyond for temperatures above the physiological up to 700 K utilizing NIR upconverted emission due to Stark sublevel splitting (4S3/2(II) → 4I13/2). Combining insights from these two studies, this level of tunability is highly advantageous for optical temperature probes, as it enables consistent relative sensitivity across a wide range of temperature regions. Practical demonstration in practical device fabrication as in a thin film thermometer has already been reported.14 The NIR emission bands of the Er3+ ion offer reliable strategic insight of the relative sensitivity parameter. We have evaluated both absolute (Sa) and relative (Sr) sensitivities of the TCL pair at 11655 cm−1 (858 nm) and 11454 cm−1 (873 nm) across the three temperature regions as shown in Fig. 7(a–f). The absolute sensitivity (Samax) values observed were notably high across the defined temperature zones, with a maximum of 0.0144 K−1 at 313 K in temperature zone 1 (313–433 K), 0.0884 K−1 at 433 K in temperature zone 2 (433–484 K), and 0.045 K−1 at 493 K in temperature zone 3 (493–673 K). These values surpass those of other NIR-emitting TCL bands in similar luminescent centers. Additionally, the maximum relative sensitivity (Srmax) recorded was 0.68 ± 0.06% K−1 at 313 K in temperature zone 1, 0.357 ± 0.02% K−1 at 433 K in temperature zone 2, and 0.286 ± 0.09% K−1 at 483 K in temperature zone 3. These Sr values are the highest reported for Er3+ ions within the context of NIR TCLs, highlighting the exceptional sensitivity achievable in this system. The PbZrTiO3:Er3+/Yb3+ combination in the current C1:PZT phosphor is significant as a nanothermometer (Srmax = 0.68% K−1 at 313 K) among the many luminous thermometers based on Er3+/Yb3+ ion dopant hosts. Indeed, several papers12,25–30 exploiting Er3+ as a dopant exhibit larger sensitivities exploiting energy levels that are not thermally coupled and emission in the NIR region as well. Table 1 illustrates that the use of different dopants can yield varying sensitivity values. The table also indicates that among different dopants, the present work exhibits higher maximum sensitivities (Srmax) using NIR-I (800–980 nm) TCL bands, and also maintains stability over a wide temperature range. The significance of the present work lies in two main areas: first, although larger sensitivities have been reported with Er3+/Yb3+ ion-doped hosts, optical thermometry performed using NIR bands, with detailed explanations of their origins from Stark sublevel splitting, is crucial and seldom discussed. Second, the Stark sublevel split NIR bands demonstrate effective optical thermometry across a broad temperature range, spanning both low (12–313 K) and high temperatures (313–673 K). However, these materials have excitation wavelengths that are not in line with the biological windows, limiting their applicability in in vivo measurements due to poor spectral resolution and image quality. Additionally, their thermal sensitivity is optimized for temperatures higher than those typically required for biomedical applications. Interestingly, the current phosphor could be employed in temperature sensing using more than one TCL pair, a salient feature uncommon among other luminescent centers. Moreover, the relative sensitivity of the NIR emitting TCL pair remains good at higher temperatures and maintains good thermal sensitivity from the low temperature region (12 K) to the higher order temperatures (673 K), exhibiting promising capabilities as a higher yield thermometry phosphor.
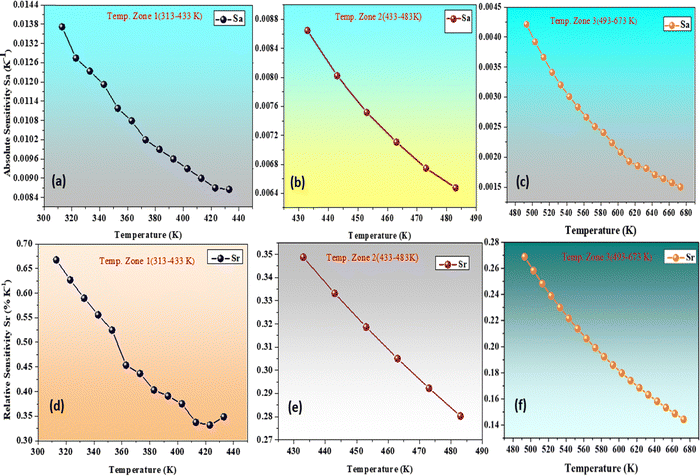 |
| | Fig. 7 The absolute sensitivities (Sa) of the TCL pair, 11655 cm−1 (858 nm) and 11454 cm−1 (873 nm) in the three temperature regions in: (a) temp. zone 1 (313–433 K), (b) temp. zone 2 (443–483 K), and (c) temp. zone 3 (493–673 K), and the relative sensitivities (Sr) in the three temperature regions in: (d) temp. zone 1, (e) temp. zone and (f) temp. zone 3, respectively. | |
Table 1 Relative temperature sensitivity of different nanothermometers
| Host |
λ
em (nm) |
Temperature range (K) |
S
r (Max) (% K−1) |
Ref. |
| PbZrTiO3:Er,Yb |
858, 878 |
300–673 |
1.56 |
This work |
| α-NaYF4:Yb/Tm@CaF2 |
802, 820 |
313–373 |
0.43 |
31
|
| SrF2:Gd,Nd |
858, 866 |
293–338 |
0.61 |
32
|
| YNbO4:Nd |
893, 930 |
303–473 |
0.28 |
33
|
| Fluoroin-dogallate glass:Nd |
820, 890 |
288–323 |
0.3 |
30
|
| Y2O3:Er |
800 |
293–353 |
2.02 ± 0.06 |
26
|
| Gd2O3:Nd |
825, 890 |
288–323 |
1.75 |
34
|
| NaYF4:Er |
837, 980 |
113–443 |
2.15 |
35
|
3.3 NIR temperature sensor
To demonstrate the practical application of PbZrTiO3:Er3+/Yb3+ (C1:PZT), as an optical thermometer, the temperature-dependent NIR emission spectra were collected over the temperature range of 313–673 K, as shown in Fig. 8(a)–(c). A test of the temperature sensitivity of the C1:PZT sensor was conducted by measuring temperatures using a thin-film phosphor sensor (C1:PZT deposited on a Si-100 substrate) and an infrared thermal camera under 980 nm excitation. The initial procedures for fabricating the thermometer device were followed as previously described.14 A NIR sensor and a thermal infrared imager, with varying irradiation times, were used to measure the temperature of electronic components on a printed circuit board (PCB) using FIR technology at 980 nm. The measurement process was as follows: first, the UC spectra of the as-prepared thin-film FIR thermometer were collected under continuous wave (CW) excitation with a 980 nm laser. The temperature of the electronic components was then calculated by correlating the FIR curves to the temperature values. Fig. 9(a) shows the temperatures of the electronic components, while Fig. 9(b) presents a comparison between the temperatures measured using an infrared thermal camera (x-axis) and those obtained using the FIR method (y-axis). The recorded temperatures from the NIR thermal imaging camera were found to be in close agreement with the FIR-based measurements, as the NIR thermal imaging captured the surface temperature of the samples, which closely reflects the actual temperature at the measurement location.
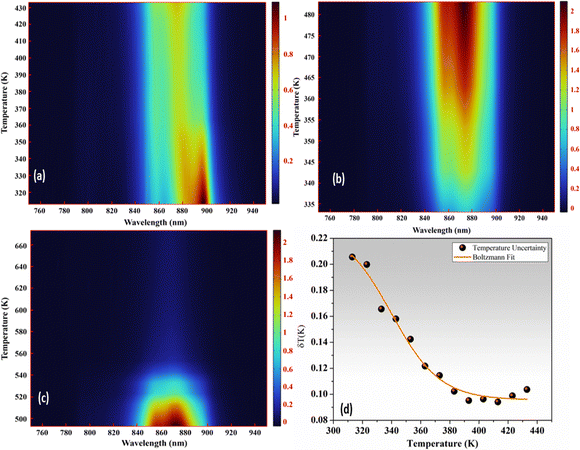 |
| | Fig. 8 The near-infrared UC spectra (temperature dependent) of the C1:PZT phosphor using NIR TCL emission bands in (a) temp. zone 1 (313–433 K), (b) temp. zone 2 (443–483 K), and (c) temp. zone 3 (493–673 K) and (d) temperature uncertainty of the C1:PZT sample while measuring relative sensitivity. | |
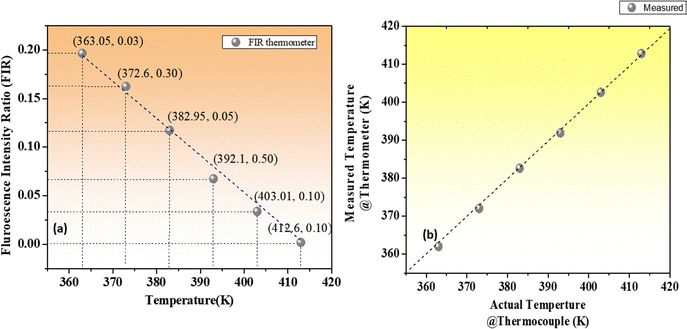 |
| | Fig. 9 (a) Temperature measurements via the calibrated FIR curves; (b) temperature of electronic components using FIR and an infrared thermal imager. | |
One of the other significant characteristics, expressed in terms of Sr values, is the temperature uncertainty (δT), which may be explained by,
| |  | (9) |
where δ
Δ could be calculated by error propagation theory.
36Fig. 7 shows the temperature uncertainty of the TCL bands referred to. For these samples, the computed values of δ
T were 0.10–0.21 K (313–433 K) [refer to
Fig. 8(d)]. Comparing this sample to other oxides previously reported in the literature, it demonstrated superior temperature uncertainty and sensitivity.
37
3.4 Correlation of Stark sublevel splitting in Er3+ ions and optical temperature sensing
In order to explain the correlation between NIR upconverted emission with optical thermometry within a broad temperature spectrum, we need to analyze the erbium ion energy diagrams including Stark levels. Stark splitting significantly affects the shape and peak shifts of energy levels in many optical transitions within rare-earth ion matrices. Typically, the intra-configurational 4f–4f transitions in Er3+ ions are forbidden by the LaPorte rule due to parity conservation. However, the interaction of rare-earth ions with the crystal field or lattice vibrations can mix states of different parities into the 4f states, making these forbidden transitions observable. To explain the observed NIR emissions in the 850–900 nm range, along with their variable peak positions, we must consider the effect of small perturbations that shift and split the free ion energy levels. Additionally, these perturbated electronic states may interact in a variety of ways with the crystal lattice's phonon states. As a result, thermally coupled levels in Er3+ ions are observed. For instance, Huang et al.38 previously reported the splitting of the 4I15/2 level at T = 12 K, identifying eight distinct Stark components with a spread of 341 cm−1. Identical results were also proposed by Bigot et al.39 where the 4I13/2 → 4I15/2 transition (T = 1.5 K) in the IR regime has a ground state spreading of 314.4 cm−1 with the simultaneous creation of several Stark splittings. However, limited reports are available on the near-infrared 4S3/2 → 4I13/2 transition within the first biological window. To precisely determine the location and splitting of each Stark level within the 4S3/2 multiplet of Er3+, upconversion (UC) spectra can be utilized. The J-manifolds divide into (2J + 1)/2 Stark splitting in erbium ions in the presence of a crystal field, which results in two manifolds from the 4S3/2 level and seven Stark split components40i.e. 6879, 6818, 6800, 6602, 6596, 6522 and 6233 cm−1, through the 4I13/2 level, respectively. Generally, this Stark sub-level splitting assisted transition in the Er3+ ion can be seen by excitations close to 1.5 μm, also in 1.532, 1.470 or 1.455 μm. Considering a quasi-two-level laser process where a higher laser level represents a Stark sublevel the same as the pump level and the lower level belongs to the electrical ground state manifold. The low quantum defect leads to reduced heat deposition in the gain medium and enhances the laser process's high quantum efficiency. However, the UC mechanism, assisted by excited state absorption (ESA) and visible through the crystal's green emission, significantly influences the laser process. Consequently, maintaining an erbium concentration below 1 at% is essential to optimize the emission and minimize undesired effects. While the accuracy of the number and width of Stark level splitting depends on the crystal's symmetry, the intensity is influenced by variations in the crystal field,41 as noted in previous studies. Due to these variations, differing crystal fields across ions result in distinct Stark splitting, thereby broadening the observed width of Stark levels when measured across an ion ensemble. However, in this case, the broadening and shifting of emission peaks with temperature correspond to various transition energies, which can be described using the following nomenclatures.
1 Parametric model for the shape of the energy levels based on Stark level splitting.
A parametric model42 characterising the shape of Stark levels should take into account that the shape dictates the dominancy of Stark levels in Er3+ energy levels. The parameterization involves assigning a Gaussian distribution to every Stark level Si.| |  | (10) |
here, the scaling factor (xis,scale) determines the relative height of the width (xis,width) and xis,splitting represents the divergence of the Stark sublevel from the center (Ei,center) of the discrete level i, (2S+1LJ) in the absence of Stark splitting. The parameters xis,scale, xis,width and xis,splitting are the free parameters of the model. The shape of each level (i) is determined by calculating the sum over the Stark levels (si):| |  | (11) |
Fig. 1 displays the shape of wide bands consisting of seven Stark level transitions including temperature dependent peaks, respectively.
3 The Stark sublevel parameters.
It is possible to determine the energy level's shape by a reverse optimisation method which uses a model described by Steinkemper et al.42 and Krammers theorem, and the maximum permissible limit for expanding the FWHM as well as the Stark level splitting can be found under <200 cm−1 which for the current case is shown in Fig. 5.
All of the described methods were considered in the present case and it was concluded that the Stark sublevel splitting is possible certainly in low temperature measurements and even in the room temperature to higher temperature range. Plausible Stark sublevel splitting of 4S3/2 and 4I13/2 could be observed and hence can show thermometry performance using those transitions referred to (inset of Fig. 1). The decreasing trend of fluorescence of Stark level transitions with increasing temperature from 12 K to 313 K is caused by the phonon assisted excitation between 4S3/2(I) and 4S3/2(II). The fluorescence intensity of the NIR emission bands is thermally quenched as a result of the Er3+ ions in the Stark level 4S3/2(I) being instantly thermally excited to the adjacent sublevel 4S3/2(II) with rising temperature due to an energy gap of 50 cm−1 (Fig. 3).
3.5 Probability of Stark sublevel splitting in Yb3+ ions and anti-Stokes population inversion in Yb3+ manifolds
The aforementioned section has established a clear justification for the Stark level splitting among the Er3+ ions which leads to the upconverted NIR emissions based on Yb3+ → Er3+ ion ET mechanisms. However, it is necessary to further explore the behavior of Yb3+ ions at low temperatures and consider revising the energy transfer model to account for potential anti-Stokes population inversion in the Yb3+ ion, as well as map this effect accordingly. The anti-Stokes fluorescence process43,44 is a phenomenon where a material absorbs photons of lower energy and subsequently emits photons of higher energy, resulting in a net loss of thermal energy from the material. Ytterbium (Yb3+) ions are particularly well-suited for laser-induced fluorescence cooling because they exhibit minimal multiphonon relaxation, concentration quenching, and excited-state absorption. Ytterbium (Yb3+) has two manifolds, the 2F7/2 ground state and the 2F5/2 excited state, separated by approximately ∼104 cm−1, with moderate electron–phonon coupling. In a glass (ZBLAN & BIG)44 host, Stark sub-level splitting occurs approximately by ∼200 cm−1, enabling thermalization within a manifold when population distributions are perturbed. To investigate and map the possibility of anti-Stokes population inversion in the current sample, the authors synthesized an Yb3+:PbZrTiO3 phosphor without Er3+ ions using the same experimental procedure outlined in this work.14 The Yb3+ ion concentration was maintained at 3.0 mol%, consistent with previous experiments.
The absorption and emission spectra were recorded from 12–313 K to evaluate the theoretical minimum operating temperatures and cooling efficiencies under optimal conditions as described in the reports.43,44Fig. 10 illustrates the temperature-dependent absorption and emission spectra for the Yb3+:PbZrTiO3 phosphor sample. The long-wavelength absorption tail, which is indicative of cooling potential, shifts with temperature as the absorption coefficient decreases at lower temperatures. This observation supports the idea that Yb3+ ions doped in the current host material may undergo sub-Stark anti-Stokes transitions, as predicted by Murtagh et al.44 However, the emission and absorption spectra of the Er3+ ion doped C1:PZT phosphor sample do not exhibit the broad 976 nm emission, as shown in Fig. 10, when measured using a similar pump–probe spectrophotometer43 system. Although the authors verified the possibility of Yb3+ manifold-assisted Stark transitions, the energy transfer (ET) process from Yb3+ to Er3+ is more likely in the current system. This conclusion is consistent with previous findings on energy bridging mechanisms20 in Er3+-doped phosphors, modelled using rate equations. The emission observations on Yb3+:PbZrTiO3 phosphor further supports the Yb3+ Stark sub level split manifolds at lower temperatures as reported by Mungan et al.43 However, in the present work, the observed NIR emission bands around 800–900 nm occur within a broad emission envelope. These emissions are more accurately explained by Stark sublevel splitting of Er3+ ions rather than Yb3+ ions, which typically emit in the 900–1000 nm range.
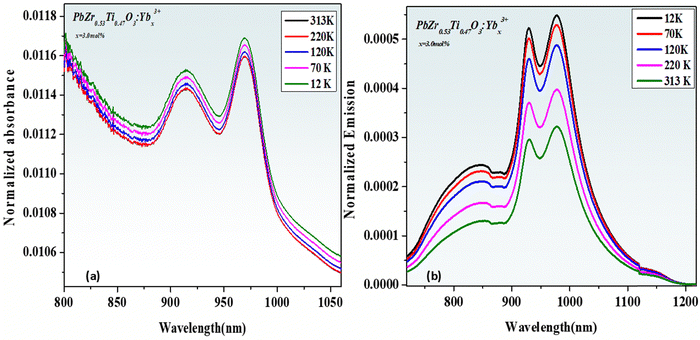 |
| | Fig. 10 Normalized (a) absorption and (b) emission spectra of the Yb3+:PZT host at different temperatures. | |
4. Conclusion
In summary, optical temperature sensing and real time temperature monitoring were investigated using NIR upconverted emissions from C1:PZT samples, which have shown excellent thermometry using visible upconversion emission in our previous work. The current work on optical thermometry completes the extension of the Er3+ ion optical thermometry performance using visible to NIR upconverted emission bands as TCLs. Detailed analysis of UC emissions under 980 nm excitation across temperatures from 12 K to over 300 K reveals that these NIR emissions arise from Stark sublevel transitions. The observed single NIR emission band, comprising multiple peaks, was deconvoluted using Gaussian fitting and shows temperature-dependent changes from 12 K to 313 K. The FWHM of the emission bands centred at 11655 cm−1 (858 nm) and 11454 cm−1 (873 nm) was observed to increase with rising temperature, suggesting its potential as a reliable sensing parameter. By utilizing temperature-dependent FWHM modulation, a peak relative sensitivity (Srmax) around 1.56 ± 0.09% K−1 at 673 K was achieved at 673 K. This sensitivity represents the highest reported value for Er3+ ions in the context of NIR-TCLs. Moreover, these higher values of sensitivity in a wide temperature range (12–683 K) using NIR upconverted TCL bands were explained and correlated on the backdrops of Stark sublevel splitting. A parametric model nomenclature was demonstrated to confirm the splitting of the 4I13/2 level of the Er3+ ion and to determine the line shape function using boundary conditions, shown in the work. These findings indicate that this material demonstrates significant potential for a range of applications, particularly in low-temperature sensing utilizing NIR emissions. The results further indicate that these NIR emissions possess strong sensing capabilities with excellent repeatability for temperature detection in microelectronic devices, as maintaining a sensitivity of 1.56 ± 0.09% K−1 at 673 K presents challenges in precision. Additionally, the relative sensitivity Sr is nearly 1.0% K−1 within the biologically relevant temperature range of 270 K to 320 K, highlighting its potential for biomedical applications, particularly in photo-thermal treatments.
Author contributions
The original idea, design, conceptualization of the work, experiments, data analysis and interpretation and drafting of the article were carried out by PPS. Data analysis of the article was carried out by YS. Critical review, scientific suggestions and editing were carried out by HCS.
Data availability
Data will be made available on request.
Conflicts of interest
The authors have no conflicts of interest to declare. All co-authors have seen and agree with the contents of the manuscript and there is no financial interest to report. We certify that the submission is original work and is not under review at any other publication.
Acknowledgements
The authors express their sincere thanks to the South African Research Chairs Initiative of the Department of Science and Technology and the National Research Foundation of South Africa (84415). The financial assistance from the University of the Free State, South Africa is highly recognized.
References
- M. Dai, Z. Fu, Z. Wang and H. Xu, Sc3+-Induced Double Optimization Strategies for Boosting NIR-II Luminescence and Improving Thermometer Performance in CaF2:Nd3+, Nd3+/Yb3+ @NaYF4 Nanocrystals, Chem. Eng. J., 2023, 452, 139133, DOI:10.1016/j.cej.2022.139133
 .
.
- M. Li, J. Zhou, R. Lei, H. Wang, D. Deng and S. Xu, An Effective Way to Improve Near-Infrared-II Luminescence and Optical Thermometry Performance via Gd3+ Incorporation in Er3+, Yb3+:ZrO2 Nanocrystals, Opt. Commun., 2021, 496, 127111, DOI:10.1016/J.OPTCOM.2021.127111 .
- K. Xue, C. Wang, J. Wang, S. Lv, B. Hao, C. Zhu and B. Z. Tang, A Sensitive and Reliable Organic Fluorescent Nanothermometer for Noninvasive Temperature Sensing, J. Am. Chem. Soc., 2021, 143(35), 14147–14157, DOI:10.1021/jacs.1c04597 .
- L. Wortmann, S. Suyari, T. Ube, M. Kamimura and K. Soga, Tuning the Thermal Sensitivity of β-NaYF4:Yb3+, Ho3+, Er3+ Nanothermometers for Optimal Temperature Sensing in OTN-NIR (NIR II/III) Biological Window, J. Lumin., 2018, 198, 236–242, DOI:10.1016/j.jlumin.2018.01.049 .
- D. L. Silva, R. S. Pugina and J. M. Almeida Caiut, Green, Red, and near-Infrared up-Conversion Emission of NaY(MoO4)2:Er3+ Submicrometric Particles Obtained by One-Step Synthesis, and Its Thermometric Application, J. Lumin., 2022, 243, 118639, DOI:10.1016/j.jlumin.2021.118639 .
- N. Liao, L. Su, Y. Cao, L. Qiu, R. Xie, F. Peng, Z. Cai, X. Liu, J. Song and Y. Zeng, Tracking Cell Viability for Adipose-Derived Mesenchymal Stem Cell-Based Therapy by Quantitative Fluorescence Imaging in the Second Near-Infrared Window, ACS Nano, 2022, 16(2), 2889–2900, DOI:10.1021/acsnano.1c09960 .
- M. Jia, Z. Fu, G. Liu, Z. Sun, P. Li, A. Zhang, F. Lin, B. Hou and G. Chen, NIR-II/III Luminescence Ratiometric Nanothermometry with Phonon-Tuned Sensitivity, Adv. Opt. Mater., 2020, 8(6), 1901173, DOI:10.1002/adom.201901173 .
- C. Hazra, S. Ullah, Y. E. Serge Correales, L. G. Caetano and S. J. L. Ribeiro, Enhanced NIR-I Emission from Water-Dispersible NIR-II Dye-Sensitized Core/Active Shell Upconverting Nanoparticles, J. Mater. Chem. C, 2018, 6(17), 4777–4785, 10.1039/C8TC00335A .
- K. A. Abel, J.-C. Boyer and F. C. J. M. Veggel, van. Hard Proof of the NaYF4/NaGdF4 Nanocrystal Core/Shell Structure, J. Am. Chem. Soc., 2009, 131(41), 14644–14645, DOI:10.1021/ja906971y .
- C. Cao, N. Wu, W. Yuan, Y. Gu, J. Ke, W. Feng and F. Li, Ln3+-Doped Nanoparticles with Enhanced NIR-II Luminescence for Lighting up Blood Vessels in Mice, Nanoscale, 2020, 12(15), 8248–8254, 10.1039/D0NR01098G .
- B. Xu, D. Li, Z. Huang, C. Tang, W. Mo and Y. Ma, Alleviating Luminescence Concentration Quenching in Lanthanide Doped CaF2 Based Nanoparticles through Na+ Ion Doping, Dalt. Trans, 2018, 47(22), 7534–7540, 10.1039/C8DT00519B .
- D. Jaque and F. Vetrone, Luminescence Nanothermometry, Nanoscale, 2012, 4(15), 4301–4326, 10.1039/c2nr30764b .
- T. Wang, Y. Li, T. Liu, Y. Peng, Z. Yin, Z. Yang, J. Qiu and Z. Song, NIR-NIR Upconverting Optical Temperature Sensing Based on the Thermally Coupled Levels of Yb3+-Tm3+ Codoped Bi7F11O5 Nanosheets, J. Lumin., 2020, 221, 117034, DOI:10.1016/j.jlumin.2020.117034 .
- P. P. Sukul and H. C. Swart, Synergistic Red Dominancy over Green Upconversion Studies in PbZrTiO3:Er3+/Yb3+ Phosphor Synthesized via Two Different Modified Technique and Flexible Thin-Film Thermometer Demonstration on C1:PbZrTiO3@PDMS Substrates, J. Alloys Compd., 2023, 966, 171656, DOI:10.1016/j.jallcom.2023.171656 .
- N.-N. Dong, M. Pedroni, F. Piccinelli, G. Conti, A. Sbarbati, J. E. Ramírez-Hernández, L. M. Maestro, M. C. Iglesias-de la Cruz, F. Sanz-Rodriguez, A. Juarranz, F. Chen, F. Vetrone, J. A. Capobianco, J. G. Solé, M. Bettinelli, D. Jaque and A. Speghini, NIR-to-NIR Two-Photon Excited CaF2:Tm3+,Yb3+ Nanoparticles: Multifunctional Nanoprobes for Highly Penetrating Fluorescence Bio-Imaging, ACS Nano, 2011, 5(11), 8665–8671, DOI:10.1021/nn202490m .
- L. Xing, W. Yang, D. Ma and R. Wang, Effect of Crystallinity on the Optical Thermometry Sensitivity of Tm3+/Yb3+ Codoped LiNbO3 Crystal, Sens. Actuators, B, 2015, 221, 458–462, DOI:10.1016/j.snb.2015.06.132 .
- P. P. Sukul and H. C. Swart, Crystal Phase Modified Blue Upconversion on Tm3+/Yb3+:BCZT Ceramic Phosphor Benefits Multifunctionality in White-Light Applications, Dalt. Trans, 2022, 51, 11515–11525, 10.1039/D2DT01962K .
- P. P. Sukul, Amitabh and K. Kumar, Near Infrared to Visible Upconversion Studies on Er3$+/Yb3+$/Tm3+ Doped PbZrTiO3 Multifunctional Ceramics, OSA Contin., 2018, 1(3), 1087–1096, DOI:10.1364/OSAC.1.001087 .
- P. P. Sukul, K. Kumar and H. C. Swart, Photoluminescence Spectroscopy of Eu3+: An Economical Technique for the Detection of Crystal Phase Transformation in PbZr053Ti047O3 Ceramics, OSA Contin, 2018, 1(3), 971, DOI:10.1364/osac.1.000971 .
- P. P. Sukul, K. Kumar and H. Swart, Erbium Energy Bridging Upconversion Mechanism Studies on BAKL:Er3+/Yb3+ Glass-Ceramics and Simultaneous Enhancement of Color Purity of the Green Luminescence, Dalt. Trans., 2022, 51(7), 2827–2839, 10.1039/D1DT03918K .
- P. P. Sukul, M. K. Mahata, U. K. Ghorai and K. Kumar, Crystal Phase Induced Upconversion Enhancement in Er3+/Yb3+ Doped SrTiO3 Ceramic and Its Temperature Sensing Studies, Spectrochim. Acta, Part A, 2019, 212, 78–87, DOI:10.1016/j.saa.2018.12.039 .
- B. M. Walsh and B. Di Bartolo, On the Analysis of the Thermal Line Shift and Thermal Line Width of Ions in Solids, J. Lumin., 2015, 158, 265–267, DOI:10.1016/j.jlumin.2014.10.015 .
- I. E. Kolesnikov, A. A. Kalinichev, M. A. Kurochkin, E. V. Golyeva, E. Y. Kolesnikov, A. V. Kurochkin, E. Lähderanta and M. D. Mikhailov, YVO4:Nd3+ Nanophosphors as NIR-to-NIR Thermal Sensors in Wide Temperature Range, Sci. Rep., 2017, 7(1), 18002, DOI:10.1038/s41598-017-18295-w .
- M. G. Nikolić, Ž. Antić, S. Ćulubrk, J. M. Nedeljković and M. D. Dramićanin, Temperature Sensing with Eu3+ Doped TiO2 Nanoparticles, Sens. Actuators, B, 2014, 201, 46–50, DOI:10.1016/j.snb.2014.04.108 .
- M. D. Dramićanin, Trends in Luminescence Thermometry, J. Appl. Phys., 2020, 128(4) DOI:10.1063/5.0014825 .
- A. S. Laia, A. C. Brandão-Silva, M. A. Gomes, Z. S. Macedo, M. E. G. Valério, J. J. Rodrigues and M. A. R. C. Alencar, Temperature Sensing with Er3+ Doped Y2O3 Nanoparticles Operating within the 1st and 2nd Biological Window: The Influence of Particle Size on the Relative Sensitivity of Thermally Decoupled Levels, J. Alloys Compd., 2022, 926, 166816, DOI:10.1016/j.jallcom.2022.166816 .
- A. Bednarkiewicz, L. Marciniak, L. D. Carlos and D. Jaque, Standardizing Luminescence Nanothermometry for Biomedical Applications, Nanoscale, 2020, 12(27), 14405–14421, 10.1039/d0nr03568h .
-
C. D. S. Brites; A. Millán and L. D. Carlos, In Chapter 281 - Lanthanides in Luminescent Thermometry, Including Actinides, ed. Jean-Claude, B., Vitalij K., P. B. T.-H. on the P. and C. of R. E., Elsevier, 2016, Vol. 49, pp. 339–427. DOI:10.1016/bs.hpcre.2016.03.005 .
- C. D. S. Brites, R. Marin, M. Suta, A. N. Carneiro Neto, E. Ximendes, D. Jaque and L. D. Carlos, Spotlight on Luminescence Thermometry: Basics, Challenges, and Cutting-Edge Applications, Adv. Mater., 2023, 35(36), 2302749, DOI:10.1002/adma.202302749 .
- L. A. O. Nunes, A. S. Souza, L. D. Carlos and O. L. Malta, Neodymium Doped Fluoroindogallate Glasses as Highly-Sensitive Luminescent Non-Contact Thermometers, Opt. Mater., 2017, 63, 42–45, DOI:10.1016/j.optmat.2016.08.038 .
- R. Wu, J. Zhou, L. Lei, S. Zhang, Z. Xiao, J. Zhang and S. Xu, α-NaYF4:Yb3+-Tm3+@CaF2 Nanocrystals for NIR-to-NIR Temperature Sensing, Chem. Phys. Lett., 2017, 667, 206–210, DOI:10.1016/j.cplett.2016.10.040 .
- L. Wang, X. Yang, M. Yuan, Z. Yang, K. Han, H. Wang and X. Xu, Determination of Near-Infrared Downconversion Emission of Yb3+ and Optical Temperature Sensing Performances in Nd3+-Sensitized SrF2 Nanocrystals, Opt. Mater., 2022, 123, 111823, DOI:10.1016/j.optmat.2021.111823 .
- L. Đačanin Far, S. R. Lukić-Petrović, V. Đorđević, K. Vuković, E. Glais, B. Viana and M. D. Dramićanin, Luminescence Temperature Sensing in Visible and NIR Spectral Range Using Dy3+ and Nd3+ Doped YNbO4, Sens. Actuators, A, 2018, 270, 89–96, DOI:10.1016/j.sna.2017.12.044 .
- Y. Zhang, P. Wang, H. Wang, X. Zheng, Y. Guo, N. Zhang and H. Liu, Visible and Near-Infrared Luminescence Properties of Nd3+/Yb3+ Co-Doped Gd2O3 Phosphors for Highly Sensitive Optical Thermometry, Dalt. Trans., 2022, 51(27), 10612–10622, 10.1039/D2DT01271E .
- F. Zhuohong, L. Lin, W. Zhezhe and Z. Zhiqiang, NIR Optical Temperature Sensing with Efficiently Relative Sensitivity Based on β-NaYF4:Er3+ Nanoparticles, J. Lumin., 2020, 221, 117005, DOI:10.1016/j.jlumin.2019.117005 .
- F. H. Borges, J. C. Martins, F. J. Caixeta, L. D. Carlos, R. A. S. Ferreira and R. R. Gonçalves, Luminescent Thermometry Based on Er3+/Yb3+ Co-Doped Yttrium Niobate with High NIR Emission and NIR-to-Visible Upconversion Quantum Yields, J. Lumin., 2022, 248, 118986, DOI:10.1016/j.jlumin.2022.118986 .
- F. H. Borges, J. C. Martins, F. J. Caixeta, R. R. Pereira, L. D. Carlos, R. A. S. Ferreira and R. R. Gonçalves, Primary Thermometers Based on Sol–Gel Upconverting Er3+/Yb3+ Co-Doped Yttrium Tantalates with High Upconversion Quantum Yield and Emission Color Tunability, J. Sol-Gel Sci. Technol., 2022, 102(1), 249–263, DOI:10.1007/s10971-021-05673-0 .
- Y. D. Huang, M. Mortier and F. Auzel, Stark Level Analysis for Er3+-Doped ZBLAN Glass, Opt. Mater., 2001, 17(4), 501–511, DOI:10.1016/S0925-3467(01)00109-4 .
- L. Bigot, A.-M. Jurdyc, B. Jacquier, L. Gasca and D. Bayart, Resonant Fluorescence Line Narrowing Measurements in Erbium-Doped Glasses for Optical Amplifiers, Phys. Rev. B:Condens. Matter Mater. Phys., 2002, 66(21), 214204, DOI:10.1103/PhysRevB.66.214204 .
- H. Fritsche, O. Lux, C. Schuett, S. W. Heinemann, M. Dziedzina, W. Gries and H. J. Eichler, Increased Efficiency of Er:YAG Lasers at 1645 Nm Using Narrow Bandwidth Diode Lasers and Dual-Wavelength Resonant Pumping. Solid State Lasers XXIII Technol, Devices, 2014, 8959, 895907, DOI:10.1117/12.2040427 .
- G. H. Dieke and H. M. Crosswhite, The Spectra of the Doubly and Triply Ionized Rare Earths, Appl. Opt., 1963, 2(7), 675–686, DOI:10.1364/AO.2.000675 .
- H. Steinkemper, S. Fischer, M. Hermle and J. C. Goldschmidt, Stark Level Analysis of the Spectral Line Shape of Electronic Transitions in Rare Earth Ions Embedded in Host Crystals, New J. Phys., 2013, 15(5), 53033, DOI:10.1088/1367-2630/15/5/053033 .
- C. E. Mungan, M. I. Buchwald, B. C. Edwards, R. I. Epstein and T. R. Gosnell, Internal laser cooling of Yb3+-doped glass measured between 100 and 300 K, Appl. Phys. Lett., 1997, 1460, 1458–1460 CrossRef .
- M. T. Murtagh, G. H. Sigel, J. C. Fajardo, B. C. Edwards and R. I. Epstein, Compositional Investigation of Yb3+-Doped Heavy Metal Fluoride Glasses for Laser-Induced Fluorescent Cooling Applications, J. Non. Cryst. Solids, 1999, 256, 207–211, DOI:10.1016/S0022-3093(99)00326-9 .
|
| This journal is © the Owner Societies 2025 |
Click here to see how this site uses Cookies. View our privacy policy here. 
 Open Access Article
 This Open Access Article is licensed under a Creative Commons Attribution-Non Commercial 3.0 Unported Licence
 *a,
Yadvendra
Singh
*a,
Yadvendra
Singh


 is the proportionality constant and ΔE is the energy difference between the TCLs; kB (0.6950 cm−1 K−1) is the Boltzmann constant, T is the absolute temperature, and g, σ, and ω are the degeneracy, emission cross-section, and angular frequency of the fluorescence transitions from the upper (j) to lower level (i), respectively. The aforementioned formula may be expressed as a linear equation as follows:

 is the proportionality constant that depends on g, σ, and ω, which are the degeneracy, emission cross-section, and angular frequency of the two levels involved in the occurrence of transitions.