DOI:
10.1039/D4YA00587B
(Paper)
Energy Adv., 2025,
4, 281-295
In situ synthesis of VO2@C nanocomposites for enhanced visible-light photocatalysis in wastewater remediation and sustainable hydrogen generation
Received
5th November 2024
, Accepted 16th December 2024
First published on 2nd January 2025
Abstract
In this study, we explored the efficacy of VO2/carbon nanocomposites as promising photocatalysts for hydrogen generation and dye degradation under natural sunlight. These nanocomposites were synthesized using a facile one-step hydrothermal method at 180 °C using dextrose as the carbon source with optimized reaction time. The synthesized materials were characterized using X-ray diffraction (XRD), Raman spectroscopy, field emission scanning electron microscopy (FESEM), high-resolution transmission electron microscopy (HRTEM) and X-ray photoelectron spectroscopy (XPS) analysis, to confirm their structural and physiochemical properties. FESEM analysis revealed the monoclinic crystalline structure of VO2, accompanied by the formation of nanosheets surrounding carbon spheres of ∼50 nm in diameter. Optical analysis indicated that the material shows broad absorption in the visible region with a band gap range from 2.24 to 1.87 eV. XPS and Raman spectroscopy provided further confirmation of the successful formation of the VO2/C composite. Among the synthesized samples, the VO2/C composite synthesized within 48 hours of hydrothermal treatment (VC-5) exhibited the highest photocatalytic activity. The VC-5 composite exhibited a hydrogen production rate of 2545.24 μmol h−1 g−1 and demonstrated notable photocatalytic efficiency, achieving 97% degradation of methylene blue within 5 minutes and 80% degradation of Victoria blue within 15 minutes under natural sunlight. The enhanced photocatalytic performance of these hybrid nanomaterials is attributed to their large surface area, high porosity, uniform morphology, and the synergistic interaction between VO2 and carbon. These factors enhance visible light absorption and charge carrier dynamics, significantly improving the photocatalytic performance of VO2/C nanocomposites.
1. Introduction
Vanadium oxide-based materials, particularly VO2 and V2O5, have gained significant attention in the field of nanotechnology due to their unique electronic, structural, and catalytic properties. These materials are distinguished by their ability to exist in multiple oxidation states, ranging from +2 to +5, which enables them to participate in a variety of redox reactions important for applications in energy storage, catalysis, and environmental remediation.1–4 Among the vanadium oxides, VO2 stands out due to its narrow band gap (0.7 eV) and its capability to undergo a reversible metal–insulator transition at approximately 68 °C. This transition not only fine-tunes the electronic properties of VO2 but also enhances its photocatalytic activity under different thermal conditions, making it an attractive candidate for photocatalysis and other advanced applications. A variety of techniques have been developed to synthesize vanadium oxide nanomaterials with different sizes and shapes. These techniques include hydrothermal/solvothermal methods, thermal pyrolysis, chemical vapor deposition (CVD), electrospinning, liquid exfoliation, pulsed laser deposition (PLD) and electron/ion beam lithography. Among these, the hydrothermal technique is gaining more attention due to its versatility, offering control over numerous preparation parameters such as time, temperature, pH, concentration, and precursor selection. This method is particularly advantageous for producing VO2 with desired morphologies and exploring new phases. The structural stability and phase transition behavior of VO2, as discussed by Popuri et al.,5 are crucial for maintaining catalytic performance under operational conditions, while the quantum confinement effects explored by Khan et al. further enhance its electronic properties at the nanoscale, thereby improving its photocatalytic efficiency.6
Vanadium oxides are widely utilized in catalysis and electrochemistry owing to their redox-active properties. Vanadium pentoxide (V2O5), for example, provides good capacitive performance in neutral solutions, making it a popular choice as an electrode material. The switchable activity and optoelectronic and magnetic properties of vanadium oxides have led to their use in various technological applications such as energy storage systems (EES), sensors, solar cells, electrochromic displays, and thermochromic smart windows. These materials’ ability to undergo structural transformation and exhibit unique electronic and magnetic properties positions them as key players in the development of next-generation technologies.7,8
VO2, with its distinct phase transition behavior and robust structural stability, offers a promising alternative for photocatalytic applications. Despite its potential, the utility of VO2 in photocatalytic systems, particularly for dye degradation, remains relatively underexplored. Pure carbon materials, although ineffective in water splitting reactions on their own, can significantly enhance photocatalytic activity when combined with vanadium oxides as impurities, co-catalysts, or structural defects. This makes VO2 a compelling candidate for advanced photocatalytic applications. The formation of heterojunctions by integrating VO2 with other nanomaterials could further enhance charge separation and the overall photocatalytic performance.9
The primary objective of this study is to develop and explore the dual functionality of VO2/C nanocomposites for enhanced photocatalytic applications, specifically in dye degradation and hydrogen generation. While previous studies have demonstrated the catalytic and smart coating properties of VO2, as well as its applications in phase transition-promoted hydrogen evolution, dye degradation, electrocatalytic oxygen evolution, and heterojunction synthesis, this work aims to extend these findings by introducing a novel VO2/C composite.10–15 The novelty of the current work lies in the one-step hydrothermal synthesis of VO2/C nanocomposites, utilizing dextrose as a carbon source. This method not only simplifies the synthesis process but also ensures uniform distribution and close contact between VO2 and carbon, which is crucial for optimizing the photocatalytic activity. The resulting composite features extended absorption in the visible region, a property that enhances its suitability for photocatalytic applications. Furthermore, the study investigates the unique synergistic interactions between VO2 and carbon, which play a critical role in enhancing charge carrier dynamics and broadening light absorption within the visible spectrum. These interactions significantly improve the efficiency of the VO2/C composite in facilitating both photocatalytic dye degradation and hydrogen evolution reactions under visible light irradiation. This dual functionality underscores the potential of the VO2/C composite as an effective and versatile photocatalyst for environmental and energy applications.
In this study, we have successfully synthesized VO2/C nanocomposites via a one-step hydrothermal method using dextrose as the carbon source. The structural, optical, and photocatalytic properties of the composite were systematically characterized. We demonstrated its enhanced photocatalytic performance in both dye degradation and hydrogen generation, attributing the improved activity to the synergistic effects between VO2 and carbon.
2. Materials and method
2.1 Chemical
Vanadium pentoxide (V2O5) of extra-purity grade was procured from Loba Chemie Pvt. Ltd, ensuring high-quality standards for our experimental protocols. Dextrose monohydrate of analytical reagent (AR) grade was obtained from Thomas Baker. Distilled water served as the solvent medium. Methylene blue dye, sourced from Sigma-Aldrich, a well-characterized compound, was employed for our dye-related investigations.
2.2 Synthesis of vanadium dioxide/carbon composites
Vanadium dioxide/carbon (VO2/C) composites were synthesized using commercial V2O5, dextrose and water using a hydrothermal method. In the typical synthesis, 0.6 g of V2O5 was added to a glucose solution (3.24 g of dextrose in 140 mL of water) with vigorous stirring at room temperature for 1 h; after that, the reaction mixture was transferred into a 200 mL Teflon-lined stainless steel autoclave, sealed and maintained at 180 °C for varying reaction times 6 h, 12 h, 24 h, 36 h and 48 h. After cooling, a product was collected and washed with distilled water and ethanol solution several times and then dried in a vacuum oven at 80 °C for 12 h. The samples were designated as VC-1, VC-2, VC-3, VC-4, and VC-5, corresponding to reaction times of 6 h, 12 h, 24 h, 36 h, and 48 h, respectively (Scheme 1).
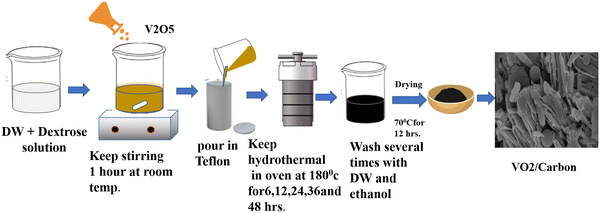 |
| | Scheme 1 Schematic diagram of VO2/carbon synthesis. | |
2.3 Photocatalytic study
2.3.1 Photocatalytic hydrogen generation from water.
Photocatalytic hydrogen generation was carried out in a 70 mL total volume air-tight cylindrical quartz reactor with a cooling jacket for water circulation. The intensity of solar light was measured using a digital Lux meter. The measured average intensity of solar light reaching the surface of the Earth is 97![[thin space (1/6-em)]](https://www.rsc.org/images/entities/char_2009.gif) 000 Lux. In a typical photocatalytic experiment, 15 mg of a photocatalyst was dispersed in 25 mL total volume containing 20% methanol (v/v) in an aqueous solution. The 45 mL free space of the photoreactor was made airtight with a rubber septum followed by ultrasonication for 5 min to ensure uniform dispersion of the catalyst. The solution mixture was then purged with ultra-high purity nitrogen gas (UHP-99.999%) to remove all the gases in the headspace of the reactor and dissolved oxygen from the reaction mixture. Before and after irradiation with solar light, the gas in the free space of the reactor was analyzed using gas chromatography (GC). The generated gas was analyzed immediately using GC with a specific time interval.
000 Lux. In a typical photocatalytic experiment, 15 mg of a photocatalyst was dispersed in 25 mL total volume containing 20% methanol (v/v) in an aqueous solution. The 45 mL free space of the photoreactor was made airtight with a rubber septum followed by ultrasonication for 5 min to ensure uniform dispersion of the catalyst. The solution mixture was then purged with ultra-high purity nitrogen gas (UHP-99.999%) to remove all the gases in the headspace of the reactor and dissolved oxygen from the reaction mixture. Before and after irradiation with solar light, the gas in the free space of the reactor was analyzed using gas chromatography (GC). The generated gas was analyzed immediately using GC with a specific time interval.
2.3.2 Dye degradation.
Methylene blue (MB) dye was used to study the photocatalytic activity of the synthesized VO2/C nanocomposites. The VO2/C nanocomposites (25 mg) were dispersed in 50 mL of MB (25 ppm) dye solution and maintained under constant stirring under sunlight. Aliquots of 2 mL solution were removed periodically after every 1 min from the reaction mixture and centrifuged to separate the catalyst from the dye solution and UV-Vis spectra for the obtained dye solution were recorded. The percentage degradation of methylene blue by the catalyst was calculated from the following equation.| |  | (1) |
where C0 represents the initial time in absorption and Ct represents the absorption after ‘t’ minutes.
2.4 Sample characterization
The crystalline phase and structure of nanocomposites were analyzed by XRD (Bruker AXS D8, CuKα1 radiation), while the optical bandgap was determined using a UV-VIS spectrophotometer (PerkinElmer, 200–800 nm). Morphological studies were conducted using FESEM (Hitachi S-4800) at accelerating voltages of 5 kV and 10 kV and high-resolution transmission electron microscopy (HRTEM, Philips EM-CM-12) operated at 200 kV. BET surface area analysis, XPS, and PL measurements were conducted using an Autosorb instrument (Quantachrome Inc., USA), a PHI 5000 Versa Probe III X-ray photoelectron spectrometer, and a Shimadzu RF-5301PC spectrofluorophotometer, respectively.
3. Results and discussion
3.1 XRD
Structural characterization of the synthesized material (VO2/C) was performed using powder X-ray diffraction (XRD), depicted in Fig. 1. Prominent diffraction peaks were observed at 2θ values of 25.73°, 30.44°, 34.04°, 45.77°, and 49.48°, corresponding to the lattice planes (1 1 0), (1 1 1), (−3 1 1), (−5 1 0), and (3 1 2), respectively, with lattice constants a = 12.03 Å, b = 3.693 Å, c = 6.42 Å, and beta = 106.6°. Additionally, weaker diffraction peaks were discerned in the XRD pattern. These observed peaks exhibited excellent agreement with the monoclinic crystalline phase of VO2(B), which matches well with JCPDS file no. 34-1438,16 suggesting that the sample primarily comprises a crystalline VO2(B) phase, alongside an amorphous carbon phase.17 Remarkably, the absence of the apparent diffraction peaks corresponding to other phases or impurities underscores the material's purity.
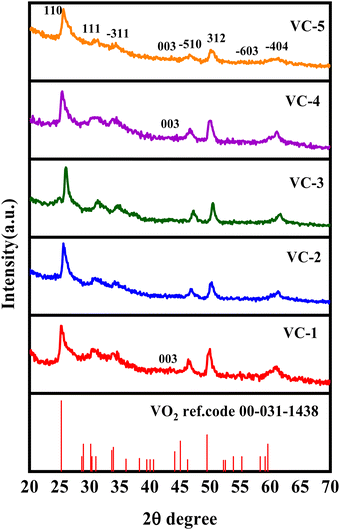 |
| | Fig. 1 pXRD pattern of the VO2/carbon composites (VC-1 to VC-5). | |
3.2 FRSEM and HRTEM
The morphology and surface properties of nanocomposites were analyzed by field emission scanning electron microscopy (FE-SEM) and high-resolution transmission electron microscopy (HR-TEM). FE-SEM images depicted carbon spheres with sizes ranging from 600 to 800 nm (Fig. 2(a) and (b)). VO2/C synthesized at 6 hours exhibited spherical particles with nanoplates of VO2, with sphere sizes around 50 nm (Fig. 2(c) and (d)). Agglomerated spheres of approximately 700 nm in size, featuring rough surfaces and observable clumps, were observed at extended reaction times (Fig. 2(e) and (f)). With increasing reaction time, the size of carbon spheres increased, indicating an almost complete conversion of dextrose to a carbon core covered by vanadium oxide (VO2).18 Spherical carbon entities characterized by their spherical geometry were interspersed within the matrix, while the VO2 components exhibited a plate-like structure dispersed throughout the composite material, as shown in Fig. 2(g)–(l).19 The microstructures of the VC-5 composites were further elucidated by HR-TEM analysis (Fig. 3), revealing spheres of carbon with deposited VO2 plates on their surfaces. Agglomerated nanospheres, approximately 500 nm in size, were observed, attributed to van der Waals forces of attraction between smaller particles, reducing surface free energy under high-pressure conditions (Fig. 3(d) and (e)). Additionally, a d-spacing value of 0.21 nm, matching well with the monoclinic phase of the (003) plane, was identified. The corresponding selected area electron diffraction (SAED) pattern (Fig. 3(f)) further confirmed the crystallinity of the sample.
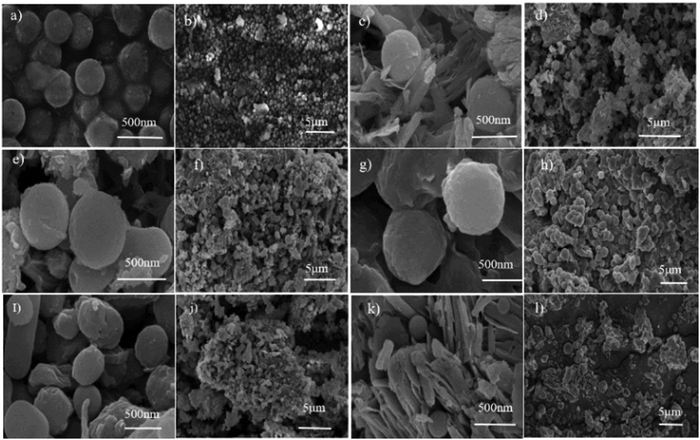 |
| | Fig. 2 FESEM images: (a) and (b) carbon, (c) and (d) VO2/C-6 h (VC-1), (e) and (f) VO2/C-12 h (VC-2), (g) and (h) VO2/C-24 h (VC-3) (i) and (j) VO2/C-36 h (VC-4), and (k) and (l) VO2/C-48 h (VC-5). | |
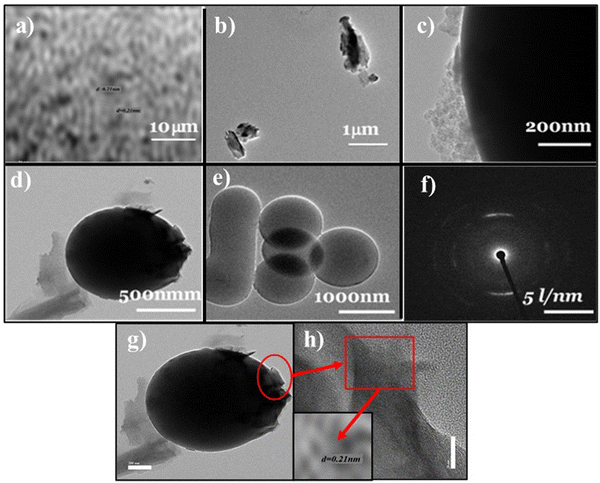 |
| | Fig. 3 TEM images and SAED pattern of the VC-5 nanocomposite (a–h). | |
3.3 Raman study
The structural bonding between vanadium, oxygen, and carbon in the vanadium oxide/carbon (VO2/C) composite was investigated using Raman spectroscopy. Fig. 4(a) presents the Raman spectra for all VO2/carbon nanocomposites.20,21 The observed Raman bands correspond to the monoclinic phase of VO2, with a space group C2/m, and lattice parameters a = 12.03 Å, b = 3.693 Å, c = 6.42 Å, and β = 106.6°. Specifically, the Raman bands located at wavenumbers 192, 285, 403, 525, 690, and 989 cm−1 are attributed to the Ag and Bg vibrational modes.22,23 The peak located at wavenumber 1582 cm−1 corresponds to the G-band, indicative of sp2-hybridized carbon structures. Although this peak is present in both amorphous and crystalline forms of carbon, its broadness and the presence of a D-band around 1350 cm−1 suggest a disordered or amorphous carbon structure.24 The peaks ranging from 100 to 1000 cm−1 are indicative of V–O vibrational modes, which are characteristic of vanadium oxide structures. These vibrational modes, including stretching, bending, and translational modes of V–O bonds, confirm the successful formation of VO2/C nanocomposites.25
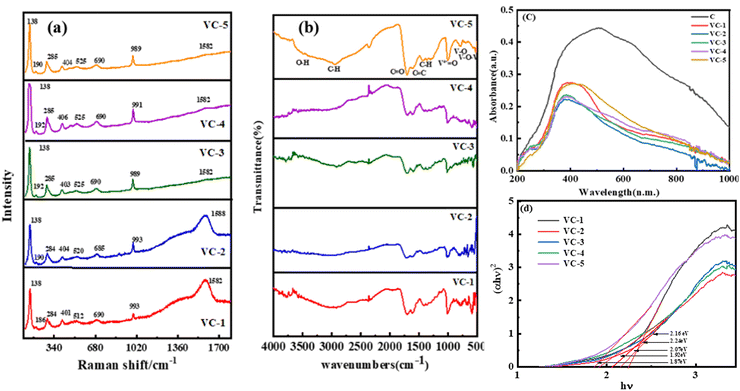 |
| | Fig. 4 (a) and (b) Raman and FTIR spectra of VC-1 to VC-5 composites; (c) UV-visible spectra of carbon and VC-1 to VC-5 composites, and (d) Tauc plot of VC-1 to VC-5 composites. | |
3.4 FTIR study
FT-IR results for analysis of VO2/C nanocomposites are shown in Fig. 4(b), which depicts the information on V–O, V–C and V–O–C bonding. The FTIR spectrum of the VO2/C composite exhibits stretching frequencies at 3500–2931 cm−1, 1700 cm−1, 1615 cm−1, 1432 cm−1, 1361 cm−1, and 1295 cm−1, which are characteristic of –OH, C–H, C![[double bond, length as m-dash]](https://www.rsc.org/images/entities/char_e001.gif) O, C–C, C–H bending, and C–O stretching vibrations, respectively. These signals can be related to dextrose utilized as a carbon precursor in the hydrothermal process. However, the reduced intensity or disappearance of these peaks suggests the effective transformation of dextrose into a carbon matrix in the formation of VO2/C nanocomposites. The peaks located at lower wavenumbers 1004 cm−1, 790 cm−1, 524 cm−1, and 422 cm−1 are due to intrinsic V
O, C–C, C–H bending, and C–O stretching vibrations, respectively. These signals can be related to dextrose utilized as a carbon precursor in the hydrothermal process. However, the reduced intensity or disappearance of these peaks suggests the effective transformation of dextrose into a carbon matrix in the formation of VO2/C nanocomposites. The peaks located at lower wavenumbers 1004 cm−1, 790 cm−1, 524 cm−1, and 422 cm−1 are due to intrinsic V![[double bond, length as m-dash]](https://www.rsc.org/images/entities/char_e001.gif) O and they match well with previous reports.26,27 The broad vibrational bands at 520 cm−1 and 410 cm−1 are assigned to V–O–V octahedral bending modes. The bands at 1000 cm−1 and 710 cm−1 are attributed to the coupled vibration of the V–O bond.28 The FTIR spectra of the reused sample remained unchanged after the photocatalytic reaction, indicating the stability of the material under visible light irradiation.
O and they match well with previous reports.26,27 The broad vibrational bands at 520 cm−1 and 410 cm−1 are assigned to V–O–V octahedral bending modes. The bands at 1000 cm−1 and 710 cm−1 are attributed to the coupled vibration of the V–O bond.28 The FTIR spectra of the reused sample remained unchanged after the photocatalytic reaction, indicating the stability of the material under visible light irradiation.
3.5 Optical properties
Fig. 4(c) shows a UV absorption spectrum of VO2/C nanocomposites. The band gap energy of all the samples was determined by extrapolating the Tauc plot obtained from their diffuse reflectance spectra, as VO2 is a direct band gap material. The optical band gaps of VO2/C were obtained as 2.24, 2.16, 2.07, 1.92 and 1.87 eV, for VC-1, VC-2, VC-3, VC-4, and VC-5 respectively.29 The optical band gap of VO2/C is attributed to the direct transition of O 2p to unoccupied V 3d bands from VO2. Furthermore, it is reported that band maxima of vanadium-based oxides depend on the charge transfer transition of O atom to Vn+ atoms.30 As the reaction time increases, the band gap of the material tends to decrease, likely because the particles grow larger. Larger particles have more atoms, which allows their energy levels to merge and form continuous energy bands. On the other hand, smaller particles have fewer atoms, leading to less overlap of energy levels and a wider band gap.31 This narrowing of the band gap at a higher reaction time facilitates the absorption of nanocomposites towards longer wavelengths.
3.6 XPS
Furthermore, X-ray photoelectron spectroscopy (XPS) was employed to study the presence of V, O, and C and the bonding between them (Fig. 5). The XPS spectrum of the VO2 sample shows the presence of C 1s, O 1s and V 3d core-levels. The XPS spectrum for C can be deconvoluted into three peaks as shown in Fig. 5(a). The peaks A, B and C at 284.8, 286.6 and 288.5 correspond to C 1s, C–O and C![[double bond, length as m-dash]](https://www.rsc.org/images/entities/char_e001.gif) O respectively.32Fig. 5(b) shows the broad and asymmetric spectrum of the O 1s peaks and it is deconvoluted into three peaks which specify the presence of three different oxygen species. The first two peaks observed at binding energies 530 and 531.7 eV are assigned to O 1s of the V–O bond of VO2 and V2O5.33 The higher binding energy peak which is located at 533.4 eV is attributed to surface contamination such as by hydroxides or carbon oxides.34 The vanadium V 2p spectrum is split into two peaks V 2p3/2 and V 2p1/2 at ∼516 and 524 eV. The V 2p3/2 peak is also deconvoluted into two peaks at 516.3 and 517.4 eV as shown in Fig. 5(c).35 The low binding energy peak is assigned to the V4+ state whereas the higher binding energy peak is attributed to the V5+ state. The binding energy value corresponds to the reported values of V 2p3/2 for V4+ and V5+, respectively.36 The binding energy separation which gives the spin–orbit splitting between the V 2p3/2 and the V 2p1/2 peak is ∼7.3 eV for V5+ and 7 eV for V4+ ions which match well with a previous report.37 In the sample, V5+ was observed from the surface oxidation of the sample in air.
O respectively.32Fig. 5(b) shows the broad and asymmetric spectrum of the O 1s peaks and it is deconvoluted into three peaks which specify the presence of three different oxygen species. The first two peaks observed at binding energies 530 and 531.7 eV are assigned to O 1s of the V–O bond of VO2 and V2O5.33 The higher binding energy peak which is located at 533.4 eV is attributed to surface contamination such as by hydroxides or carbon oxides.34 The vanadium V 2p spectrum is split into two peaks V 2p3/2 and V 2p1/2 at ∼516 and 524 eV. The V 2p3/2 peak is also deconvoluted into two peaks at 516.3 and 517.4 eV as shown in Fig. 5(c).35 The low binding energy peak is assigned to the V4+ state whereas the higher binding energy peak is attributed to the V5+ state. The binding energy value corresponds to the reported values of V 2p3/2 for V4+ and V5+, respectively.36 The binding energy separation which gives the spin–orbit splitting between the V 2p3/2 and the V 2p1/2 peak is ∼7.3 eV for V5+ and 7 eV for V4+ ions which match well with a previous report.37 In the sample, V5+ was observed from the surface oxidation of the sample in air.
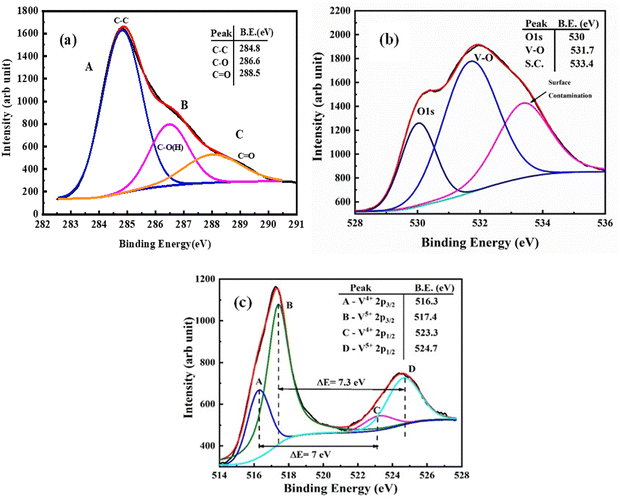 |
| | Fig. 5 XPS spectra of VC-5: (a) C 1s, (b) O 1s and (c) V 2p. | |
3.7 PL spectra
The photoluminescence (PL) spectra of VO2/C composites synthesized with varying hydrothermal reaction times (VC-1 to VC-5) show a broad emission band in the range of 430–580 nm, corresponding to radiative recombination of photoinduced charge carriers (Fig. 6). The intensity of the PL emission decreases from VC-1 to VC-5, indicating changes in the structural or electronic properties induced by prolonged reaction times. In all of the five samples, the carbon content remains constant, and the extended reaction time probably influences the crystallinity, particle size, or defect density of the VO2 phase. These changes enhance non-radiative recombination pathways, reducing the PL intensity. The diminished emission with increasing reaction time reflects improved charge carrier separation efficiency, potentially due to reduced defect-related recombination centers or better interfacial properties within the composites.38,39
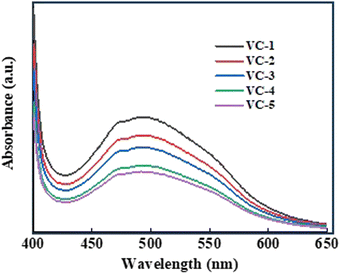 |
| | Fig. 6 PL spectra of VC-1 to VC-5 composites. | |
3.8 EIS study
Electrochemical impedance spectroscopy (EIS) was employed to study the charge transfer properties of VO2/C composites (VC-1 to VC-5) synthesized with varying hydrothermal reaction times. EIS measurements were conducted using a three-electrode system in a 0.1 M KCl electrolyte. The VO2/C composite films (VC-1 to VC-5) coated on nickel foam served as the working electrode, platinum was used as the counter electrode, and Ag/AgCl as the reference electrode. The frequency range was set from 0.1 Hz to 1 MHz with an AC amplitude of 10 mV at open circuit potential. The Nyquist plots for the composites display semicircles, representing the charge transfer resistance (Rct) at the electrode/electrolyte interface (Fig. 7). A systematic decrease in the diameter of the semicircles is observed from VC-1 to VC-5, indicating improved charge transfer dynamics with increasing reaction time. This indicates a significant reduction in Rct, suggesting enhanced charge transfer at the electrode/electrolyte interface. The smaller semicircle of VC-5 indicates the lowest charge transfer resistance (Rct), facilitating enhanced photocatalytic properties.40
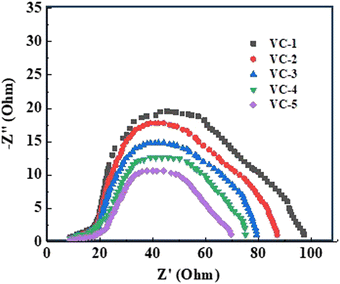 |
| | Fig. 7 EIS study of VC-1 to VC-5 composites. | |
4. Photocatalytic study
4.1 Photocatalytic H2 evolution from H2O splitting
The photocatalytic hydrogen generation graph for VC-1 to VC-5 is shown in Fig. 8. The initial hydrogen production rate for VC-1 was considerably low but exhibited a significant increase with VC-5. In the hydrogen evolution reaction, methanol served as a sacrificial reagent, effectively suppressing the oxygen evolution rate through radical formation. Moreover, methanol irreversibly reacted with VB photogenerated holes, reducing charge carrier recombination rates and thereby enhancing the photocatalytic activity.41–43
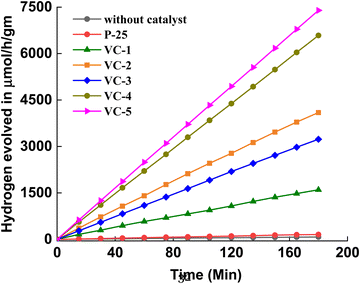 |
| | Fig. 8 Photocatalytic hydrogen generation via H2O splitting of a system without catalyst, P25, VC-1 to VC-5. | |
The photocatalytic water splitting mechanism involves the absorption of sunlight by semiconductor photocatalysts, generating electrons in the conduction band (CB) and holes in the valence band (VB). The holes in the VB oxidize methanol, producing protons (H+) and radicals, while electrons from the CB reduce proton ions into molecular hydrogen (H2).44,45 In order to validate the photocatalytic performance of the VO2/C nanocomposites, control experiments were conducted without any catalyst and with the well-known commercial photocatalyst P25. As expected, the control without any catalyst produced a negligible amount of hydrogen, underscoring the essential role of the photocatalyst in the water splitting process. The reference trial with P25 yielded a hydrogen evolution rate of 54 μmol h−1 g−1, which, while demonstrating the photocatalytic capability of P25, is significantly lower than that of the VO2/C nanocomposites. The hydrogen generation data for all samples are summarized in Table 1, with the highest hydrogen evolution rate observed for VO2/C synthesized over 48 hours, reaching 2545.24 μmol h−1 g−1. This observation highlights the superior photocatalytic activity of VO2/C nanocomposites compared to pure VO2 and other commercial photocatalysts.46,47
Table 1 The H2 generation rates for the as-synthesized VC-1 to VC-5
| S. no. |
Sample |
Band gap (eV) |
BET surface area (m2 g−1) |
H2 evolution rate (μmol h−1 g−1) |
| 1 |
VC-1 |
2.24 |
9.19999 |
637.40 |
| 2 |
VC-2 |
2.16 |
10.7058 |
1178.43 |
| 3 |
VC-3 |
2.07 |
17.4871 |
1491.65 |
| 4 |
VC-4 |
1.92 |
22.5042 |
2288.66 |
| 5 |
VC-5 |
1.87 |
26.3423 |
2545.24 |
The reaction mechanism for hydrogen generation by the VO2/C composite can be summarized as follows:
| | | VO2/C + hν → eCB− + hVB+ | (2) |
| | | CH3OH + h+ → CH2OH + H | (3) |
| | | CH2OH + h+ → HCHO + H+ | (4) |
Several factors contribute to the high hydrogen generation rates observed in the VO
2/C composites. The enhanced photocatalytic performance of the VO
2/C composite can be attributed to the synergistic interaction between VO
2 and carbon, which facilitates efficient charge carrier separation. Upon light irradiation, VO
2 generates electron–hole pairs, and the conductive carbon network rapidly transfers the photogenerated electrons, minimizing recombination. The formation of a Schottky junction at the VO
2–carbon interface creates an internal electric field that further drives the separation of charge carriers, directing electrons toward the carbon phase and retaining holes in VO
2.
48 Additionally, carbon acts as an electron reservoir and extends the lifetime of charge carriers by trapping electrons, while its light-absorbing properties enhance the composite's ability to utilize a broader spectrum. These combined effects ensure a greater availability of active species for photocatalytic reactions, resulting in superior catalytic efficiency. Additionally, the VO
2/C composites exhibit a high specific surface area, characterized by closely packed surface crystals and numerous nanostructures such as nanospheres or cracks. This morphology increases the number of active sites available for water molecule adsorption and subsequent photocatalytic reactions, thereby enhancing the overall hydrogen generation efficiency. Furthermore, surface defects in the VO
2/C composite, along with high carrier concentrations and rapid carrier transfer rates, further contribute to its superior photocatalytic performance. The highest hydrogen generation rates were observed in the VC-5 nanocomposites, which were synthesized at 48 hours. The extended reaction time allows for the complete conversion of the precursors, resulting in improved crystallinity, phase purity, and optimized morphology. This, in turn, facilitates effective carbon incorporation, leading to enhanced catalytic activity and stability.
Table 2 compares the photocatalytic hydrogen generation of the present work with other related studies.
49–52
Table 2 Comparison of the photocatalytic hydrogen generation of VO2/carbon with other relevant work
| S. no. |
Nanocomposite |
H2 evolution rate (μmol h−1 g−1) |
Quantum efficiency (%) |
Ref. |
| 1 |
VO2 |
800 |
38.7 |
49
|
| 2 |
VO2 |
3.75 |
— |
50
|
| 3 |
Zn3V2O8/rGO |
104.6 |
— |
51
|
| 4 |
VO2/carbon nitrite |
645 |
0.42 |
52
|
| 5 |
VO2–carbon |
2545.24 |
9.89 |
Present work |
4.2 Photodegradation of methylene blue and Victoria blue
The photocatalytic activities of VO2/C nanocomposites were further evaluated by the photodegradation of methylene blue (C16H18ClN3S) and Victoria blue (C29H32ClN3). During the photodegradation experiments, 25 mg of the photocatalyst was dispersed in 50 mL of 25 ppm dye aqueous solution and stirred in the dark to achieve adsorption–desorption equilibrium. After 1 h, the dye solution containing the catalyst was exposed to sunlight. The progress of the photodegradation process was monitored using the change in intensities of the characteristic absorption of MB dye at 630 nm and Victoria blue absorption at 600 nm.53,54 The experimental results pertain to MB and VB dye adsorbed and degraded at different time intervals under different experimental conditions and for comparison, a blank experiment without any catalyst was also performed. In the absence of a catalyst, MB and VB dye barely degraded, but degradation of MB and VB dye was achieved in the presence of a catalyst under sunlight irradiation. The 97% degradation of MB dye and 81% degradation of VB dye can be achieved in the presence of VO2/C 48 h within 05 minutes and 15 minutes respectively. However, the photodegradation efficiency is significantly enhanced in the presence of VO2/C 48 h. The spectral changes during the photodegradation of MB and VB dye in the presence of VO2/C nanocomposites under sunlight illumination are shown in Fig. 9(a) and (c). The enhanced photoactivity of VC-5 nanocomposites can be accredited to their increased surface area (Table 1) and reduced band gap, facilitating improved light absorption and charge carrier dynamics along with decreased electron–hole (e−/h+) recombination, achieved through the effective coupling of VO2 and carbon.55 Furthermore, the experimental data were utilized for studying the photodegradation kinetics. The corresponding plots of ln![[thin space (1/6-em)]](https://www.rsc.org/images/entities/char_2009.gif) C0/Ctvs. irradiation time are depicted in Fig. 9(b) and (d). The rate constants for the VO2/C samples are summarized in Table 2. Thus, the maximum photodegradation rates (i.e. 2.65, 1.80 min−1) with excellent linear correlation (Table 3) were demonstrated by the VC-5 photocatalyst, suggesting pseudo-first-order kinetics for MB and VB respectively. Table 4 compares the photocatalytic dye degradation in the present work with other relevant studies.56–59
C0/Ctvs. irradiation time are depicted in Fig. 9(b) and (d). The rate constants for the VO2/C samples are summarized in Table 2. Thus, the maximum photodegradation rates (i.e. 2.65, 1.80 min−1) with excellent linear correlation (Table 3) were demonstrated by the VC-5 photocatalyst, suggesting pseudo-first-order kinetics for MB and VB respectively. Table 4 compares the photocatalytic dye degradation in the present work with other relevant studies.56–59
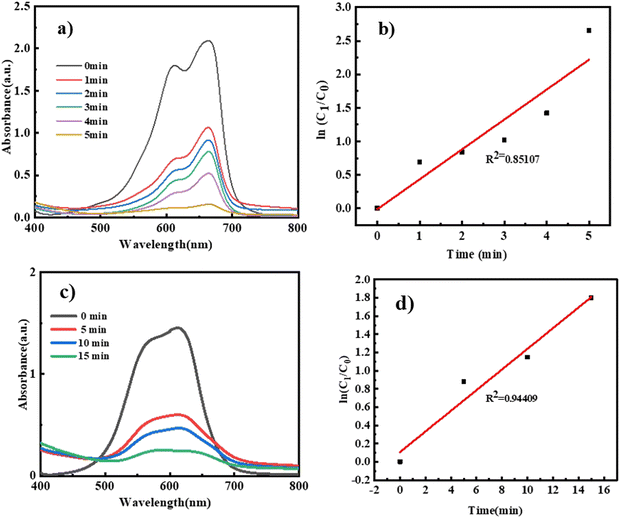 |
| | Fig. 9 (a) and (c) UV-Vis spectra of MB and VB degradation using VC-5 and (b) and (d) adsorption kinetics of MB and VB dye using VC-5. | |
Table 3 Rate constant and percentage degradation of MB and VB using VC-1 to VC-5
| S. no. |
|
Sample |
Time (min) |
Rate constant (K) |
Regression coefficient R2 |
% degradation |
| 1 |
MB |
VC-1 |
20 |
0.44 |
0.92453 |
35.31 |
| 2 |
|
VC-2 |
20 |
2.20 |
0.95421 |
88.75 |
| 3 |
|
VC-3 |
20 |
2.37 |
0.77624 |
90.62 |
| 4 |
|
VC-4 |
20 |
2.40 |
0.70143 |
90.93 |
| 5 |
|
VC-5 |
5 |
2.65 |
0.85107 |
96.87 |
| 6 |
VB |
VC-5 |
15 |
1.80 |
0.94409 |
80.61 |
Table 4 Comparison of the photocatalytic dye degradation of VO2/carbon with other relevant work
| S. no. |
Material |
Synthesis method |
Dye |
Time (min) |
% degradation |
Ref. |
| 1 |
VO2@TiO2 |
Hydrothermal |
RhB (0.01 M) |
150 |
81 |
56
|
| 2 |
VO2/Ag3VO4 |
Hydrothermal |
RhB (1 × 10⁻⁵ mol L−1) |
90 |
73.2 |
57
|
| 3 |
VO2–CuWO4 |
Hydrothermal |
AZ II (8 mg L−1) |
75 |
80–90 |
58
|
| AO (4 mg L−1) |
| 4 |
VO2@CeO2 |
Hydrothermal |
RhB (10 ppm) |
180 |
66 |
59
|
| 5 |
VO2/carbon |
Hydrothermal |
MB (25 ppm) |
5 |
94 |
Present work |
| VB (25 ppm) |
15 |
81 |
4.2.1 Reusability studies for VC-5.
The reusability of the photocatalyst was evaluated through five repeated cycles. The catalyst (VO2/carbon; VC-5) was extracted after use, then washed twice and dried. The dried powder was again utilized to degrade the methylene blue dye. In this set of experiments, the ratio of the catalyst and dye was maintained the same in all cycles. It was observed that the degradation of MB decreased from 99%, 97%, 96%, and 85% to 68% at the end of every cycle (Fig. 10(a) and (b)).
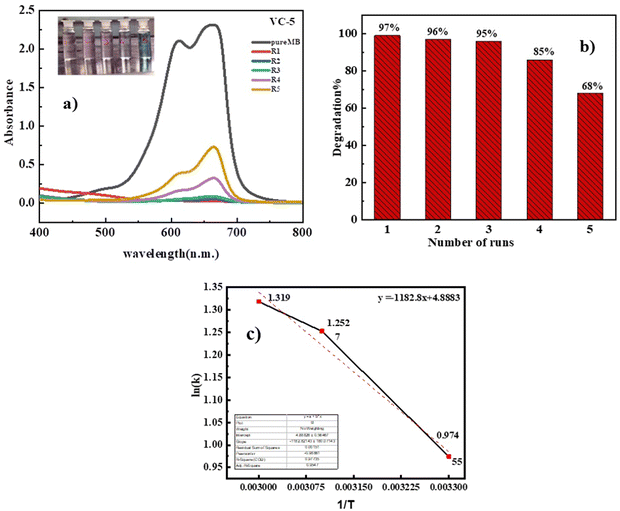 |
| | Fig. 10 (a) Photocatalysis reusability performance of VC-5 and (b) adsorption kinetics of VB dye. (c) Graph of ln(k) against 1/T for VC-5 at temperatures 30 °C, 40 °C, and 50 °C. | |
4.2.2 Activation energy calculation of VC-5.
In our investigation, we conducted a comprehensive analysis of the photocatalytic degradation rates of a specific catalyst, VC-5, across varying temperatures (30 °C, 40 °C, and 50 °C) to ascertain the activation energy associated with its performance. The determination of activation energy is crucial for understanding the catalyst's efficiency under different thermal conditions.
The activation energy of a catalyst is calculated using the Arrhenius equation, which relates the rate constant of a reaction to temperature, as follows:
| |  | (7) |
where
k is the rate constant at a given temperature,
A is the pre-exponential factor or frequency factor,
Ea is the activation energy,
R is the gas constant (8.314 J (mol K)
−1), and
T is the absolute temperature.
This equation can be rearranged to linearize the relationship between ln(k) and 1/T:
| |  | (8) |
We calculate the activation energy of the catalyst having higher performance among all. Given three rate constants at different temperatures, we plot a graph of ln(
k) against 1/
T using the data points for each temperature and then determine the slope and intercept of the line (
Fig. 10(c)).
By performing linear regression on the plotted data, the slope of the resulting line will give you  (the units of the slope must be consistent with the units of activation energy divided by the gas constant
  , which is in Kelvin; K). Therefore, by rearranging the equation, you can solve for Ea by multiplying the slope by the gas constant R (Table 5).
The calculated slope from our analysis was found to be −1182.8 K. By substituting this value into
eqn (4), we calculated the activation energy of the VC-5 catalyst to be 9.8 kJ mol
−1.
Table 5 Rate constant value for photocatalytic degradation of MB at 30, 40 and 50 °C
| Sample name |
Temperature in Kelvin |
Time (min) |
Rate constant (K) |
1/T |
ln(k) |
| VC-5@30 °C |
303 |
5 |
2.65 |
0.0033 |
0.97455 |
| VC-5@40 °C |
313 |
4 |
3.50 |
0.0031 |
1.2527 |
| VC-5@50 °C |
323 |
4 |
3.74 |
0.0030 |
1.3190 |
This calculated activation energy value serves as a significant indicator of the energy threshold required for the photocatalytic degradation process facilitated by the VC-5 catalyst. The higher calculated activation energy suggests a more efficient and robust catalytic performance under the tested temperature conditions, highlighting the potential suitability of VC-5 for practical applications in photocatalysis.
5. Total organic carbon (TOC) and biocompatibility of photo-catalytically treated MB dye solution
5.1 TOC study
Total organic carbon (TOC) was determined to know the amount of carbon found in methylene blue dye that was degraded to CO2 during oxidation. The methylene blue dye was analyzed for mineralization based on the total organic carbon (TOC) removal (%). The TOC analysis was performed using a TOC analyser (TOC-VCPN, Shimadzu, Japan) before and after the photocatalysis of the MB dye using the standard SM 5310B method. The TOC removal efficiency was calculated as shown in eqn (10):| |  | (10) |
where TOCi and TOCt are the total organic carbon concentrations (mg L−1) of the MB dye before and after photocatalysis, respectively. The % TOC before and after degradation of methylene blue dye is measured by using catalyst VC-5 under sunlight. A remarkable decrease in TOC was obtained which implies efficient mineralization of MB dye with VC-5. The TOC decreased from 68 to 6 mg L−1, which corresponded to 94% removal of the MB dye. This result was supported by experimental photocatalytic degradation of the MB dye (96%) using a VC-5 catalyst.
5.2 Biocompatibility test (seed germination and plant growth)
For the biocompatibility test using a fully randomized design, a 20 cm round bottom glass dish was used for the germination experiment. 150 similar Mung (Vigna radiata L.) seeds are placed in each plate and are treated at room temperature with (T1) tap water, (T2) MB dye, and (T3) degraded MB dye. The 150 seeds were put in dishes lined with cotton, soil, water, and solutions containing 25 parts per million of MB dye or degraded MB dye. Once the radicle length reached half of the seed length, the experiment was constantly observed, and the seed was considered to have germinated. The germination properties were calculated using the following formula:60
where plant growth was measured such as the number of roots, shoot, and root/shoot lengths by meter scale and expressed as cm plant−1.
The germination process of mung bean (Vigna radiata L.) seeds was investigated with three distinct treatments: tap water, 25 ppm MB (methylene blue), and degraded MB, each comprising 50 mL of the respective samples. Growth dynamics were monitored daily post-germination. At 2 days after sowing (DAS), superior germination rates were observed in the degraded MB (T3) treatment (92.66%) compared to tap water (T1) (84%), while 25 ppm MB (T2) exhibited the lowest germination percentage (78.66%). Similar trends were noted in plant growth at 15 DAS (Fig. 1). Roots play a pivotal role in mineral and nutrient absorption from the soil and water. In the current study, metrics such as the root number, leaf number, and average root and shoot lengths were significantly higher in the degraded MB treatment (T3) compared to tap water (T1) and 25 ppm MB (T2). However, the application of MB dye (T2) led to a reduction in plant growth, particularly evident in total plant height (−18.86%), whereas after MB dye degradation (T3), an increase in plant height (19.22%) was observed relative to tap water (T1) (Fig. 11). A study conducted by Sonu et al.61 evaluated untreated MB samples at concentrations of 6 ppm, 20 ppm, and 40 ppm, revealing root and shoot lengths of 6.5 cm and 9 cm, 5.5 cm and 7.25 cm, and 2.75 cm and 6.25 cm, respectively.
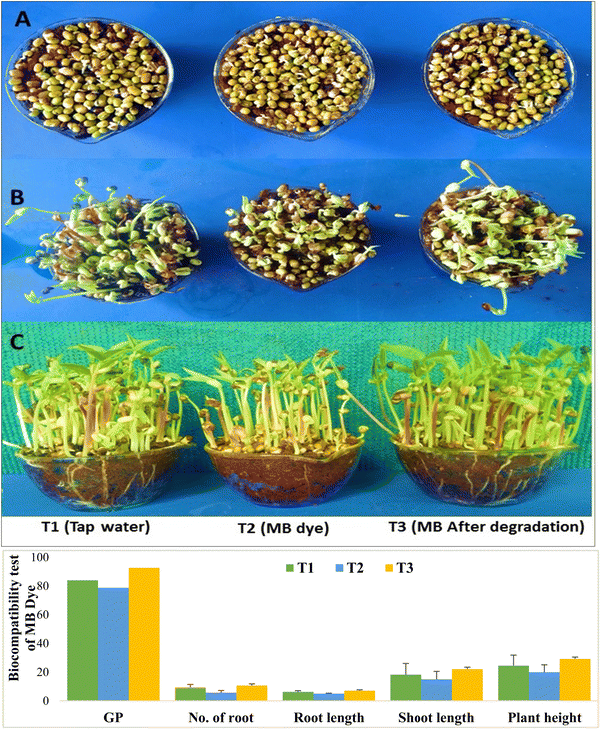 |
| | Fig. 11 Seed germination rate and plant growth parameters using (T1) tap water, (T2) MB dye and (T3) degraded MB dye at 2 DAS (A), 7 DAS (B) and 15 DAS (C). | |
6. Conclusions
This study reveals the successful synthesis of a highly efficient VO2/C nanocomposite, showcasing its potential as an advanced photocatalyst. The comprehensive analysis through XRD unveils the presence of a monoclinic VO2(B) phase alongside amorphous carbon, confirmed by the standard (JCPDS, no. 34-1438). Further morphological investigations via FESEM and TEM showcase interesting variations in particle size and surface features with reaction time. Optical property assessments reveal a notable trend in band gap energy (ranging from 2.24 to 1.87 eV) corresponding to different reaction times. XPS analysis confirms the presence of V, O, and C elements and their respective chemical states. Regarding the photocatalytic performance, the VO2/C composite exhibits improved efficiency in hydrogen evolution and organic dye degradation under visible light. Notably, the 48-hour synthesized composite (VC-5) shows superior performance, displaying a hydrogen evolution rate of 2545.24 μmol h−1 g−1. Moreover, approximately 97% degradation of methylene blue and 81% degradation of Victoria blue were achieved within short time intervals (5 and 15 minutes respectively) using VC-5 as the photo-catalyst. During the reusability assessment, a slight decline in efficiency was observed across successive cycles. The germination experiment with mung bean seeds revealed that degraded MB dye solution (T3) significantly enhanced both germination percentage and plant growth compared to tap water (T1) and 25 ppm MB dye solution (T2). The mineralization of MB using the VO2/C composite promotes root and shoot development, indicating its potential for biocompatibility and reduced phytotoxicity, thus suggesting its viability for environmentally friendly applications in agriculture and wastewater treatment.
Author contributions
Mrs Yogita Padwal: experimental investigation including synthesis of materials and photocatalytic activity. Dr Indra Jeet Chaudhary: formal analysis and interpretation of measurements. Prof. Dattatray J. Late: formal analysis, interpretation of measurements, and supervision. Prof. Muthupandian Ashokkumar: conceptualization, investigation, and formal analysis. Dr Ratna Chauhan and Prof. Suresh Gosavi: conceptualization, investigation, formal analysis, supervision and writing – original draft.
Data availability
The data supporting this article have been included as part of manuscript.
Conflicts of interest
There are no conflicts to declare.
Acknowledgements
Author YUP would like to thank the Chhatrapati Shahu Maharaj National Research, Training and Human Development Institute (CSMNRF-2021/2021-22/896) for awarding the fellowship. Author SWG would like to acknowledge the DST Nano mission project (DST/NM/NT/2021/02-1C-SPPU) for funding this research work.
References
- W. G. Menezes, D. M. Reis, T. M. Benedetti, M. M. Oliveira, J. F. Soares, R. M. Torresi and A. J. G. Zarbin, V2O5 nanoparticles obtained from a synthetic bariandite-like vanadium oxide: Synthesis, characterization and electrochemical behavior in an ionic liquid, J. Colloid Interface Sci., 2009, 337(2), 586–593, DOI:10.1016/j.jcis.2009.05.050.
- J. Zhu, H. Shen, X. Shi, F. Yang, X. Hu, W. Zhou and M. Gu, Revealing the Chemical and Structural Evolution of V2O5 Nanoribbons in Lithium-Ion Battery Using In-Situ Transmission Electron Microscopy, Anal. Chem., 2019, 91(17), 11055–11062, DOI:10.1021/acs.analchem.9b01571.
- V. X. Hien, V. T. Dong, D. D. Vuong and N. D. Chien, From Microurchins to V2O5 Nanowalls: Improved Synthesis through Vanadium Powder and Fast, Selective Adsorption of Methylene Blue, Langmuir, 2022, 38(1), 264–274, DOI:10.1021/acs.langmuir.1c02461.
- R. Alrammouz, M. Lazerges, J. Pironon, I. B. Taher, A. Randi, Y. Halfayab and S. Gautier, V2O5 gas sensors: A review, Sens. Actuators, A, 2021, 332(2), 113179, DOI:10.1016/j.sna.2021.113179.
- S. R. Popuri, A. Artemenko, C. Labrugere, M. Miclau, A. Villesuzanne and M. Pollet, VO2(A): Reinvestigation of crystal structure, phase transition and crystal growth mechanisms, J. Solid State Chem., 2014, 213, 79–86, DOI:10.1016/j.jssc.2014.01.037.
- G. R. Khan and B. Ahmad, Effect of quantum confinement on thermoelectric properties of vanadium dioxide nanofilms, Appl. Phys. A:Mater. Sci. Process., 2017, 123(12), 1–13, DOI:10.1007/s00339-017-1363-x.
- C. Wu, F. Feng and Y. Xie, Design of vanadium oxide structures with controllable electrical properties for energy applications, Chem. Soc. Rev., 2013, 42, 5157–5183, 10.1039/C3CS35508J.
- E. Evlyukhin, S. A. Howard, H. Paik, G. J. Paez, D. J. Gosztola, C. N. Singh, D. G. Schlom, W. C. Lee and L. F. J. Piper, Directly measuring the structural transition pathways of strain-engineered VO2 thin films, Nanoscale, 2020, 12, 18857–18863, 10.1039/D0NR04776G.
- L. Zhang, J. Yao, F. Xia, Y. Guo, C. Cao, Z. Chen and H. Luo, VO2(D) hollow core–shell microspheres: synthesis, methylene blue dye adsorption and their transformation into C/VOx nanoparticles, Inorg. Chem. Front., 2018, 5(3), 550–558, 10.1039/C7QI00819H.
- M. J. Powel, R. Q. Cabrera, A. Taylor, D. Teixeira, I. Papakonstantinou, R. G. Palgrave, G. Sankar and I. P. Parkin, Intelligent Multifunctional VO2/SiO2/TiO2 Coatings for Self-Cleaning, Energy-Saving Window Panels, Chem. Mater., 2016, 28(5), 1369–1376, DOI:10.1021/acs.chemmater.5b04419.
- G. Chen, X. Zhang, L. Guan, H. Zhang, X. Xie, S. Chen and J. Tao, Phase Transition-Promoted Hydrogen Evolution Performance of MoS2/VO2 Hybrids, J. Phys. Chem. C, 2018, 122(5), 2618–2623, DOI:10.1021/acs.jpcc.7b12040.
- A. Shallowford, S. Hajati, A. A. Youzbashi, K. Dashtian, M. Moradi and J. Toth, S-scheme NIR-edge Ag3CuS2/VO2 heterostructure for photo-oxidation/reduction of methylene blue/Cr(VI), Appl. Surf. Sci., 2022, 590, 153118, DOI:10.1016/j.apsusc.2022.153118.
- R. Cui, S. Yu, P. Han, Y. Wu, Y. Li, Y. Dang and J.-J. Zhu, Novel vacancy-richCo3O4/VO2 nanohybrids for enhanced electrocatalytic performance and application as oxygen evolution electrocatalysts, J. Alloys Compd., 2021, 876, 160129, DOI:10.1016/j.jallcom.2021.160129.
- K. Dashtian, M. Ghaedi, H. Shirinzadeh, S. Hajati and S. Shahbazi, Achieving enhanced blue-light-driven photocatalysis using nanosword-like VO2/CuWO4 type II n–n heterojunction, Chem. Eng. J., 2018, 339, 189–203, DOI:10.1016/j.cej.2018.01.107.
- Y. Wang, Z. Zhang, Y. Zhu, Z. Li, R. Vajtai, L. Ci and P. M. Ajayan, Nanostructured VO2 Photocatalysts for Hydrogen Production, ACS Nano, 2008, 2(7), 1492–1496, DOI:10.1021/nn800223s.
- C. V. Subba Reddy, E. H. Walker, S. A. Wicker, Q. L. Williams and R. R. Kalluru, Synthesis of VO2(B) nanorods for Li battery application, Curr. Appl. Phys., 2009, 9(6), 1195–1198, DOI:10.1016/j.cap.2009.01.012.
- X. Xiao, S. Li, H. Wei and D. Sun, Synthesis and characterization of VO2(B)/graphene nanocomposite for supercapacitors, J. Mater. Sci.:Mater. Electron., 2015, 26(6), 4226–4233, DOI:10.1007/s10854-015-2972-9.
- M. Chen, L.-L. Shao, J.-J. Li, W.-J. Pei, M.-K. Chen and X.-H. Xie, One-step hydrothermal synthesis of hydrophilic Fe3O4/carbon composites and their application in removing toxic chemicals, RSC Adv., 2016, 6, 35228–35238, 10.1039/C6RA01408A.
- M. Taha, E. L. H. Mayes, M. R. Field, M. Sun, M. Singh and W. Zou, Room-temperature application of VO2 microstructures on rigid and flexible substrates based on synthesis of crystalline VO2 solution, Mater. Adv., 2020, 1, 1685–1694, 10.1039/D0MA00338G.
- Y.-H. Ma, W.-B. Shang, X.-Y. Fan and Z.-H. Gao, Preparation and degradation of porous β-tricalcium phosphate bioceramic for bone imitation, J. Jilin Univ., Eng. Technol. Ed., 2015, 45(4), 1367–1374, DOI:10.13229/j.cnki.jdxbgxb201504049.
- F. Théobald, R. Cabala and J. Bernard, Essai sur la structure de VO2(B), J. Solid State Chem., 1976, 17(4), 431–438, DOI:10.1016/S0022-4596(76)80013-8.
- P. Shvets, O. Dikaya, K. Maksimova and A. Goikhman, A review of Raman spectroscopy of vanadium oxides, J. Raman Spectrosc., 2019, 50(8), 1226–1244, DOI:10.1002/jrs.5616.
- A. C. Ferrari and J. Robertson, Interpretation of Raman spectra of disordered and amorphous carbon, Phys. Rev. B:Condens. Matter Mater. Phys., 2000, 61, 14095–14107, DOI:10.1103/PhysRevB.61.14095.
- A. G. Souza Filho, O. P. Ferreira, E. J. G. Santos, J. M. Filho and O. L. Alves, Raman Spectra in Vanadate Nanotubes Revisited, Nano Lett., 2004, 4(11), 2099–2104, DOI:10.1021/nl0488477.
- I. Botto, M. Vassallo, E. Baran and G. Minelli, IR spectra of VO2 and V2O3, Mater. Chem. Phys., 1997, 50(3), 267–270, DOI:10.1016/S0254-0584(97)01940-8.
- H. Ji, D. Liu, H. Cheng, C. Zhang, L. Yang and D. Ren, Infrared thermochromic properties of monoclinic VO2 nanopowders using a malic acid-assisted hydrothermal method for adaptive camouflage, RSC Adv., 2017, 7(9), 5189–5194, 10.1039/C6RA26731A.
- M. Liu, A. J. Sternbach, M. Wagner, T. V. Slusar, T. Kong, S. L. Bud’ko, Q.-M. Kittiwatanakul, M. M. Qazilbash, A. McLeod, H. A. Bechtel, M. C. Martin, R. D. Averitt, R. D. Wolf, H. T. Kim, P. C. Canfield and D. N. Basov, Phase transition in bulk single crystals and thin films of VO2 by nanoscale infrared spectroscopy and imaging, Phys. Rev. B:Condens. Matter Mater. Phys., 2015, 91(24), 245155, DOI:10.1103/PhysRevB.91.245155.
- V. G. Golubev, D. A. Kurdyukov, A. B. Pevtsov, A. V. Sel’kin, E. B. Shadrin, A. V. Il’inskii and R. Boeyink, Hysteresis of the photonic band gap in VO2 photonic crystal in the semiconductor-metal phase transition, Semiconductors, 2002, 36, 1043–1047, DOI:10.1134/1.1507288.
- A. K. Kulkarni, Y. A. Sethi, R. P. Panmand, L. K. Nikam, J.-O. Baeg, N. R. Munirathnam, A. V. Ghule and B. B. Kale, Mesoporous cadmium bismuth niobate ((CdBi2Nb2O9)) nanospheres for hydrogen generation under visible light, J. Energy Chem., 2017, 26, 433–439, DOI:10.1016/j.jechem.2016.12.012.
- V. Naydenov, L. Tosheva and J. Sterte, Spherical silica macrostructures containing vanadium and tungsten oxides assembled by the resin templating method, Microporous Mesoporous Mater., 2002, 55(3), 253–263, DOI:10.1016/S1387-1811(02)00427-4.
- C. Zhu, S. Guo, Y. Fang and S. Dong, Reducing Sugar: New Functional Molecules for the Green Synthesis of Graphene Nanosheets, ACS Nano, 2010, 4(4), 2429–2437, DOI:10.1021/nn1002387.
- M. J. Powell, I. J. Godfrey, R. Quesada-Cabrera, D. Malarde, D. Teixeira, H. Emerich, R. G. Palgrave, C. J. Carmalt, I. P. Parkin and G. Sankar, Qualitative XANES and XPS Analysis of Substrate Effects in VO2 Thin Films: A Route to Improving Chemical Vapor Deposition, J. Phys. Chem. C, 2017, 121(37), 20345–20352, DOI:10.1021/acs.jpcc.7b06044.
- D. Goodacre, M. Blum, C. Buechner, V. Jovic, J. B. Franklin, S. Kittiwatanakul, T. Söhnel, H. Bluhm and K. E. Smith, Methanol Adsorption on Vanadium Oxide Surfaces Observed by Ambient Pressure X-ray Photoelectron Spectroscopy, J. Phys. Chem. C, 2021, 125(42), 23192–23204, DOI:10.1021/acs.jpcc.1c07403.
- J. Mendialdua, R. Casanova and Y. Barbaux, XPS studies of V2O5, V6O13, VO2 and V2O3, J. Electron Spectrosc. Relat. Phenom., 1995, 71(3), 249–261, DOI:10.1016/0368-2048(94)02291-7.
- N. Alov, D. Kutsko, I. Spirovová and Z. Bastl, XPS study of vanadium surface oxidation by oxygen ion bombardment, Surf. Sci., 2006, 600(8), 1628–1631, DOI:10.1016/j.susc.2005.12.052.
- G. Silversmit, D. Depla, H. Poelman, G. B. Marin and R. G. De GR, Determination of the V2p XPS binding energies for different vanadium oxidation states (V5+ to V0+), J. Electron Spectrosc. Relat. Phenom., 2004, 135(2–3), 167–175, DOI:10.1016/j.elspec.2004.03.004.
- S. K. Lakhera, A. Rajan, T. P. Rugma and N. Bernaurdshaw, A review on particulate photocatalytic hydrogen production system: Progress made in achieving high energy conversion efficiency and key challenges ahead, Renewable Sustainable Energy Rev., 2021, 152, 111694, DOI:10.1016/j.rser.2021.111694.
- F. Guzman, S. C. Chuang and C. Yang, Role of Methanol Sacrificing Reagent in the Photocatalytic Evolution of Hydrogen, Ind. Eng. Chem. Res., 2013, 52(1), 61–65, DOI:10.1021/ie301177s.
- J. Tang, J. R. Durrant and D. R. Klug, Mechanism of Photocatalytic Water Splitting in TiO2. Reaction of Water with Photoholes, Importance of Charge Carrier Dynamics, and Evidence for Four-Hole Chemistry, J. Am. Chem. Soc., 2008, 130(42), 13885–13891, DOI:10.1021/ja8034637.
- Y. Shude, L. Xiaoya, Z. Yekang, C. Yuxin, R. Xujie, Z. Zhihao, N. Guangjun, W. Ying and H. Yiming, Enhanced piezocatalytic and piezo-photocatalytic dye degradation via S-scheme mechanism with photodeposited nickel oxide nanoparticles on PbBiO2Br nanosheets, J. Colloid Interface Sci., 2024, 670, 373–384, DOI:10.1016/j.jcis.2024.05.120.
- C. Zhao, C. Wang, X. Ren, S. Yuan, L. Zhao, L. Zhuang, B. Teng, Y. Wu and Y. He, Heterophase structure of ZnSnO3 (rhombohedral and orthorhombic) for efficient dye degradation and N2-to-NH3 conversion via piezocatalysis and piezo-photocatalysis, Chem. Eng. J., 2024, 498, 155202, DOI:10.1016/j.cej.2024.155202.
- W. Lv, C. Yang, G. Meng, R. Zhao, A. Han, R. Wang and J. Liu, VO2(B) nanobelts/reduced graphene oxide composites for high-performance flexible all-solid-state supercapacitors, Sci. Rep., 2019, 9(1), 10831, DOI:10.1038/s41598-019-47266-6.
- Y. N. Jiang, M. Zhang, X. Zhang and Y. Ma, Reaction Pathway of Photocatalytic Water Splitting on Two-Dimensional TiO2 Nanosheets, J. Phys. Chem. C, 2022, 126(8), 3915–3922, DOI:10.1021/acs.jpcc.1c08443.
- L. K. Preethi, T. Mathews, M. Nand, S. N. Jha, C. S. Gopinath and S. Dash, Band alignment and charge transfer pathway in three phase anatase-rutile-brookite TiO2 nanotubes: An efficient photocatalyst for water splitting, Appl. Catal., B, 2017, 218, 9–19, DOI:10.1016/j.apcatb.2017.06.033.
- M. A. Mahadadalkar, S. W. Gosavi and B. B. Kale, Interstitial charge transfer pathways in a TiO2/CdIn2S4 heterojunction photocatalyst for direct conversion of sunlight into fuel, J. Mater. Chem. A, 2018, 6(33), 16064–16073, 10.1039/C8TA03398F.
- P. A. Bharad, K. Sivaranjani and C. S. Gopinath, A rational approach towards enhancing solar water splitting: a case study of Au–RGO/N-RGO–TiO2, Nanoscale, 2015, 7(25), 11206–11215, 10.1039/C5NR02613J.
- K. Appavoo, D. Y. Lei, Y. Sonnefraud, B. Wang, S. T. Pantelides, S. A. Maier and R. F. Haglund, Role of Defects in the Phase Transition of VO2 Nanoparticles Probed by Plasmon Resonance Spectroscopy, Nano Lett., 2012, 12(2), 780–786, DOI:10.1021/nl203782y.
- Y. Wang, Z. Zhang, Y. Zhu, Z. Li, R. Vajtai, L. Ci and P. M. Ajayan, Nanostructured VO2 Photocatalysts for Hydrogen Production, ACS Nano, 2008, 2(7), 1492–1496, DOI:10.1021/nn800223s.
- T. F.-R. Shen, M.-H. Lai, T. C.-K. Yang, I.-P. Fu, N.-Y. Liang and W.-T. Chen, Photocatalytic production of hydrogen by vanadium oxides under visible light irradiation, J. Taiwan Inst. Chem. Eng., 2012, 43(1), 95–101, DOI:10.1016/j.jtice.2011.06.004.
- C. Zhang, X. Ren, K. Wang, X. Liang, Y. Wu and Y. He, Boosting piezocatalytic efficiency: Thin carbon layer-modified ZnO for superior rhodamine B degradation, Ceram. Int., 2024, 50(21), 43340–43344, DOI:10.1016/j.ceramint.2024.08.068.
- F. A. Alharthi, A. S. Ababtain, H. S. Alanazi, W. S. Al-Nafaei and I. Hasan, Synthesis of Zn3V2O8/rGO Nanocomposite for Photocatalytic Hydrogen Production, Inorganics, 2023, 11(3), 93, DOI:10.3390/inorganics11030093.
- M. Jourshabani, M. R. Asrami and B.-K. Lee, Advanced Functional Carbon Nitride by Implanting Semi-Isolated VO2 Active Sites for Photocatalytic H2 Production and Organic Pollutant Degradation, Small, 2023, 19, 2300147, DOI:10.1002/smll.202300147.
- S. Lee, T. L. Meyer, C. Sohn, D. Lee, J. Nichols, D. Lee and H. N. Lee, Electronic structure and insulating gap in epitaxial VO2 polymorphs, APL Mater., 2015, 3(12), 126109, DOI:10.1063/1.4939004.
- A. K. Kulkarni, R. P. Panmand, Y. A. Sethi, S. R. Kadam, S. P. Tekale, G. H. Baeg and B. B. Kale,
In situ preparation of N doped orthorhombic Nb2O5 nanoplates/rGO composites for photocatalytic hydrogen generation under sunlight, Int. J. Hydrogen Energy, 2018, 43(43), 19873–19884, DOI:10.1016/j.ijhydene.2018.09.013.
- R. Guo, R. Tian, D. Shi, H. Li and H. Liu, S-Doped ZnSnO3 Nanoparticles with Narrow Band Gaps for Photocatalytic Wastewater Treatment, ACS Appl. Nano Mater., 2019, 2(12), 7755–7765, DOI:10.1021/acsanm.9b01804.
- Y. Li, S. Ji, Y. Gao, H. Luo and M. Kanehira, Core-shell VO2@TiO2 nanorods that combine thermochromic and photocatalytic properties for application as energy-saving smart coatings, Sci. Rep., 2013, 3, 1370, DOI:10.1038/srep01370.
- X. Tao, Q. Hong, T. Wu and F. Liao, Quasi-Hexagonal VO2/Ag3VO4 Microcrystals for Photo-Catalytic Degradation of Rhodamine B, Asian J. Chem., 2014, 26(24), 8291–8294, DOI:10.14233/ajchem.2014.16792.
- K. Dashtian, M. Ghaedi, H. Shirinzadeh, S. Hajati and S. Shahbazi, Achieving enhanced blue-light-driven photocatalysis using nanosword-like VO2/CuWO4 type II n–n heterojunction, Chem. Eng. J., 2018, 339, 189–203, DOI:10.1016/j.cej.2018.01.107.
- M. Saini, B. S. Dehiya and A. Umar, VO2(M)@CeO2 core-shell nanospheres for thermochromic smart windows and photocatalytic applications, Ceram. Int., 2019, 46(1), 986–995, DOI:10.1016/j.ceramint.2019.09.06.
- M. A. Ranal, D. G. Santana, W. R. Ferreira and C. Mendes-Rodrigues, calculating germination measurements and organizing spreadsheets, Braz. J. Bot., 2009, 32, 849–855, DOI:10.1590/S0100-84042009000400022.
- K. Sonu, S. H. Puttaiah, V. S. Raghavan and S. S. Gorthi, Photocatalytic degradation of MB by TiO2: studies on recycle and reuse of photocatalyst and treated water for seed germination, Environ. Sci. Pollut. Res., 2021, 28, 48742–48753, DOI:10.1007/s11356-021-13863-0.
|
| This journal is © The Royal Society of Chemistry 2025 |
Click here to see how this site uses Cookies. View our privacy policy here.  Open Access Article
 b,
Muthupandian
Ashokkumar
 c and
Suresh
Gosavi
 *cde
*cde
![[thin space (1/6-em)]](https://www.rsc.org/images/entities/char_2009.gif) 000 Lux. In a typical photocatalytic experiment, 15 mg of a photocatalyst was dispersed in 25 mL total volume containing 20% methanol (v/v) in an aqueous solution. The 45 mL free space of the photoreactor was made airtight with a rubber septum followed by ultrasonication for 5 min to ensure uniform dispersion of the catalyst. The solution mixture was then purged with ultra-high purity nitrogen gas (UHP-99.999%) to remove all the gases in the headspace of the reactor and dissolved oxygen from the reaction mixture. Before and after irradiation with solar light, the gas in the free space of the reactor was analyzed using gas chromatography (GC). The generated gas was analyzed immediately using GC with a specific time interval.
000 Lux. In a typical photocatalytic experiment, 15 mg of a photocatalyst was dispersed in 25 mL total volume containing 20% methanol (v/v) in an aqueous solution. The 45 mL free space of the photoreactor was made airtight with a rubber septum followed by ultrasonication for 5 min to ensure uniform dispersion of the catalyst. The solution mixture was then purged with ultra-high purity nitrogen gas (UHP-99.999%) to remove all the gases in the headspace of the reactor and dissolved oxygen from the reaction mixture. Before and after irradiation with solar light, the gas in the free space of the reactor was analyzed using gas chromatography (GC). The generated gas was analyzed immediately using GC with a specific time interval.


![[double bond, length as m-dash]](https://www.rsc.org/images/entities/char_e001.gif) O, C–C, C–H bending, and C–O stretching vibrations, respectively. These signals can be related to dextrose utilized as a carbon precursor in the hydrothermal process. However, the reduced intensity or disappearance of these peaks suggests the effective transformation of dextrose into a carbon matrix in the formation of VO2/C nanocomposites. The peaks located at lower wavenumbers 1004 cm−1, 790 cm−1, 524 cm−1, and 422 cm−1 are due to intrinsic V
O, C–C, C–H bending, and C–O stretching vibrations, respectively. These signals can be related to dextrose utilized as a carbon precursor in the hydrothermal process. However, the reduced intensity or disappearance of these peaks suggests the effective transformation of dextrose into a carbon matrix in the formation of VO2/C nanocomposites. The peaks located at lower wavenumbers 1004 cm−1, 790 cm−1, 524 cm−1, and 422 cm−1 are due to intrinsic V![[double bond, length as m-dash]](https://www.rsc.org/images/entities/char_e001.gif) O and they match well with previous reports.26,27 The broad vibrational bands at 520 cm−1 and 410 cm−1 are assigned to V–O–V octahedral bending modes. The bands at 1000 cm−1 and 710 cm−1 are attributed to the coupled vibration of the V–O bond.28 The FTIR spectra of the reused sample remained unchanged after the photocatalytic reaction, indicating the stability of the material under visible light irradiation.
O and they match well with previous reports.26,27 The broad vibrational bands at 520 cm−1 and 410 cm−1 are assigned to V–O–V octahedral bending modes. The bands at 1000 cm−1 and 710 cm−1 are attributed to the coupled vibration of the V–O bond.28 The FTIR spectra of the reused sample remained unchanged after the photocatalytic reaction, indicating the stability of the material under visible light irradiation.
![[double bond, length as m-dash]](https://www.rsc.org/images/entities/char_e001.gif) O respectively.32Fig. 5(b) shows the broad and asymmetric spectrum of the O 1s peaks and it is deconvoluted into three peaks which specify the presence of three different oxygen species. The first two peaks observed at binding energies 530 and 531.7 eV are assigned to O 1s of the V–O bond of VO2 and V2O5.33 The higher binding energy peak which is located at 533.4 eV is attributed to surface contamination such as by hydroxides or carbon oxides.34 The vanadium V 2p spectrum is split into two peaks V 2p3/2 and V 2p1/2 at ∼516 and 524 eV. The V 2p3/2 peak is also deconvoluted into two peaks at 516.3 and 517.4 eV as shown in Fig. 5(c).35 The low binding energy peak is assigned to the V4+ state whereas the higher binding energy peak is attributed to the V5+ state. The binding energy value corresponds to the reported values of V 2p3/2 for V4+ and V5+, respectively.36 The binding energy separation which gives the spin–orbit splitting between the V 2p3/2 and the V 2p1/2 peak is ∼7.3 eV for V5+ and 7 eV for V4+ ions which match well with a previous report.37 In the sample, V5+ was observed from the surface oxidation of the sample in air.
O respectively.32Fig. 5(b) shows the broad and asymmetric spectrum of the O 1s peaks and it is deconvoluted into three peaks which specify the presence of three different oxygen species. The first two peaks observed at binding energies 530 and 531.7 eV are assigned to O 1s of the V–O bond of VO2 and V2O5.33 The higher binding energy peak which is located at 533.4 eV is attributed to surface contamination such as by hydroxides or carbon oxides.34 The vanadium V 2p spectrum is split into two peaks V 2p3/2 and V 2p1/2 at ∼516 and 524 eV. The V 2p3/2 peak is also deconvoluted into two peaks at 516.3 and 517.4 eV as shown in Fig. 5(c).35 The low binding energy peak is assigned to the V4+ state whereas the higher binding energy peak is attributed to the V5+ state. The binding energy value corresponds to the reported values of V 2p3/2 for V4+ and V5+, respectively.36 The binding energy separation which gives the spin–orbit splitting between the V 2p3/2 and the V 2p1/2 peak is ∼7.3 eV for V5+ and 7 eV for V4+ ions which match well with a previous report.37 In the sample, V5+ was observed from the surface oxidation of the sample in air.

![[thin space (1/6-em)]](https://www.rsc.org/images/entities/char_2009.gif) C0/Ctvs. irradiation time are depicted in Fig. 9(b) and (d). The rate constants for the VO2/C samples are summarized in Table 2. Thus, the maximum photodegradation rates (i.e. 2.65, 1.80 min−1) with excellent linear correlation (Table 3) were demonstrated by the VC-5 photocatalyst, suggesting pseudo-first-order kinetics for MB and VB respectively. Table 4 compares the photocatalytic dye degradation in the present work with other relevant studies.56–59
C0/Ctvs. irradiation time are depicted in Fig. 9(b) and (d). The rate constants for the VO2/C samples are summarized in Table 2. Thus, the maximum photodegradation rates (i.e. 2.65, 1.80 min−1) with excellent linear correlation (Table 3) were demonstrated by the VC-5 photocatalyst, suggesting pseudo-first-order kinetics for MB and VB respectively. Table 4 compares the photocatalytic dye degradation in the present work with other relevant studies.56–59


 (the units of the slope must be consistent with the units of activation energy divided by the gas constant
  , which is in Kelvin; K). Therefore, by rearranging the equation, you can solve for Ea by multiplying the slope by the gas constant R (Table 5).


