 Open Access Article
Creative Commons Attribution 3.0 Unported Licence
Pd–Ru/TiO2 catalyst – an active and selective catalyst for furfural hydrogenation
Obaid F.
Aldosari
,
Sarwat
Iqbal
,
Peter J.
Miedziak
,
Gemma L.
Brett
,
Daniel R.
Jones
,
Xi
Liu
,
Jennifer K.
Edwards
,
David J.
Morgan
 ,
David K.
Knight
and
Graham J.
Hutchings
*
Cardiff Catalysis Institute, Main Building Park Place, Cardiff, CF10 3AT, UK. E-mail: hutch@cardiff.ac.uk
First published on 3rd November 2015
Abstract
The selective hydrogenation of furfural at ambient temperature has been investigated using a Pd/TiO2 catalyst. The effect of the solvent was studied and high activity and selectivity to 2-methylfuran and furfuryl alcohol was observed using octane as solvent but a number of byproducts were observed. The addition of Ru to the PdTiO2 catalyst decreased the catalytic activity but improved the selectivity towards 2-methylfuran and furfuryl alcohol with decreased byproduct formation. Variation of the Ru/Pd ratio has shown an interesting effect on the selectivity. The addition of a small amount of Ru (1 wt%) shifted the selectivity towards furfuryl alcohol and 2-methylrofuran. Further increasing the Ru ratio decreased the catalytic activity and also showed a very poor selectivity to 2-methylfuran.
Introduction
Biomass is considered as one of the most important resources of renewable energy, yet the development of efficient technologies which can utilize biomass represents a major challenge.1 The utilization of chemical intermediates like furfural (FFR), furfuryl alcohol (FA), together with attractive biofuels like 2-methylfuran (2-MF) and 2-methyltetrahydrofuran (2-MTHF) is the main focus of much current research.2–4 FFR, a product from xylose conversion is an important bio-derivative.1 It is considered to be a platform chemical for the upgrading of fuels through the formation of FA and 2-MF by hydrogenation.5 FA and 2-MF have a range of applications in the chemical industry; FA is mainly used in the manufacturing of resins,6 and as a starting material for the synthesis of 1,5-pentanediol,7,8 2-MF (ref. 9) and tetrahydrofurfuryl alcohol (THFA).10 2-MF is obtained from the hydrogenation of FFR and FA. The main applications of 2-MF are in the synthesis of perfume intermediates, and chloroquine lateral chains in medical applications.Copper-based catalysts have received considerable attention for the hydrogenation of FFR. Dongxia et al. have reported FFR hydrogenation in the liquid phase at a temperature of 180 °C and 69–104 barg pressure of pure hydrogen with the utilization of a copper chromite catalyst.11 The catalyst was found to be very active for the synthesis of 2-FA. Copper in combination with other metals supported on oxides e.g., Cu/Cr,12 Cu/Fe,13,14 Cu/Zn/Al,15 Cu/TiO2,5 Cu/SiO2,16–18 Cu/Ni/Mg/Al,19 Cu/Pd,20,21 has been reported to be active for the hydrogenation of FFR forming 2-MF, 2-MTHF, and 2-FA. A number of other metal oxide catalysts have also been studied and found to be suitable candidates for this reaction. e.g., Ru,22,23 Ni,24 Fe,24–26 supported catalysts. Almost all of these studies have been performed under very harsh reaction conditions, both in terms of the temperature and the hydrogen pressure required to observe activity. Therefore, a process for the selective synthesis of 2-MF and 2-FA from FFR under milder reaction conditions is highly desirable. We have recently reported that Pd/TiO2 (ref. 9) and Pd/Sn/TiO2 (ref. 10) catalysts can be used very effectively for the conversion of FA into 2-methyfuran at room temperature. Medlin et al. have recently reported an application of self-assembled layers used to block the Pd active sites which can minimize the decarbonylation reaction and the corresponding side product formation during furfural hydrogenation.27 In the present study we report the hydrogenation of FFR using the previously reported Pd/TiO2 catalyst in 1,2-dichloroethane, toluene, methanol and octane. Variation of the solvent has shown an interesting effect on the selectivity pattern. Furthermore, we have studied the addition of a second metal component, namely Ru, and observed lower catalytic activity, but high selectivity to 2-MF and FA with less byproduct formation compared to the unmodified Pd/TiO2 catalysts.
Experimental
Materials
FFR (98%), 1,2-dichloroethane (98%), methanol (99.8%), octane (98%), toluene (99%) and all reaction intermediates were purchased from Sigma Aldrich and used as received. Palladium(II) chloride and ruthenium(III) chloride metal precursors were also purchased from Sigma Aldrich. TiO2 was purchased from Degussa (P25). Pure hydrogen (99.9%) and nitrogen (99.9%) were obtained from BOC.Catalyst preparation
All the monometallic catalysts supported on TiO2 were prepared by a standard wet impregnation method reported previously.10 In a typical synthesis the PdCl2 was added to 2 ml deionised water and stirred for approximately 15 min at 80 °C until the Pd dissolved completely. The TiO2 support was added to the solution and stirred to form a paste. The paste was subsequently dried at 110 °C for 16 h, and calcined in static air (400 °C, 3 h, 20 °C min−1).Bimetallic catalysts were prepared in the same manner, with the concomitant heating and stirring of the PdCl2 and RuCl3 precursors together.
Characterization
FFR hydrogenation reaction
The hydrogenation of FFR was carried out using a stainless steel stirred autoclave (50 ml, Parr Instruments, Model 5500 HP) equipped with a Teflon liner using catalyst (0.1 g), FFR (1 g) and solvent (15 ml). The sealed autoclave was purged three times with N2, and three times with H2 before being pressurized to 3 barg with H2. The autoclave was stirred at 1000 rpm at ambient temperature. When the reaction was completed, the mixture was cooled, filtered and the post-reaction mixture was centrifuged prior to being analysed by GC (Bruker Sion 456-GC fitted with a Br-1 ms capillary column). Products were identified by comparison with the authentic samples. For the quantification of the amounts of reactant consumed and products generated an external calibration method was used, with 1-propanol being the external standard.Results and discussion
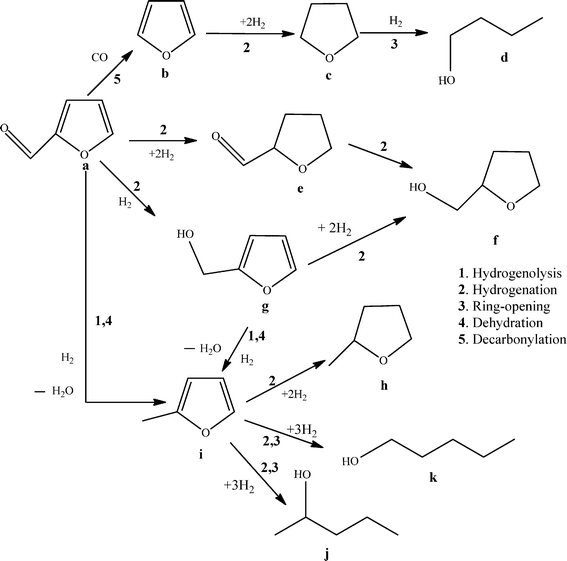
In our initial experiments we investigated a range of organic solvents with the 5% Pd/TiO2 catalyst to study the hydrogenation of FFR under mild reaction conditions (25 °C and 3 barg H2). The products expected from the hydrogenation of FFR that can be used as fuel derivatives are summarized in Scheme 1.The main target products we focused on in this study are 2-MF, and FA. Table 1 shows the comparison of various organic solvents for the catalyzed reactions. Generally the solvent is chosen in order to increase the concentration of dissolved hydrogen, and as a result enables an increase in the reaction rate.28 We have observed a high catalytic activity with toluene and methanol but the selectivity observed was completely different between the two solvents. The reaction in toluene showed a high selectivity of 2-MF and THFA. The use of methanol as the solvent led to a significantly increased selectivity of THFA alcohol along with a large amount of side products. Formation of THFA requires the selective hydrogenation of the furan double bonds with the hydrogenation of the alcohol so it follows a different reaction pathway, as shown in Scheme 1.
| Solvents | Conversion (%) | Product selectivity (%) | ||||
|---|---|---|---|---|---|---|
| 2-MF | FA | THFA | 2-MTHF | Othersa | ||
| Reaction conditions: RT, 3 barg H2, 5%Pd/TiO2 catalyst (0.1 g), FFR (1 g), solvent (15 ml), 120 min.a Acetals, ketals and polymeric species. | ||||||
| 1,2-Dichloroethane | 100 | 2.5 | 0 | 9 | 3.7 | 84.7 |
| Toluene | 98 | 42.8 | 4.1 | 10.3 | 0.6 | 42.3 |
| Methanol | 92.2 | 0 | 0 | 26.9 | 4.8 | 68 |
| Octane | 65.4 | 36.2 | 35.6 | 4.8 | 0 | 22 |
The reaction in 1,2-dicholoroethane showed formation of a mixture of products and a very small amount of the desirable products were produced, which is in contrast to our previous observations on the hydrogenation of FA where we achieved a full conversion of FA into 2-MF in 1,2-dichloroethane.9
Although, the catalytic activity was far higher with methanol, 1,2-dichloroethane and toluene but the amount of side products was also very high; therefore we chose octane for further investigation of the reaction parameters. Interestingly, the selectivity observed with octane was shifted more towards 2-MF and FA with far lower amounts of side products (mainly acetals and ketals) compared with the other solvents.
To further probe the reaction we varied the loading of the Pd from 1 to 5 wt% and the data for FFR hydrogenation is provided in Table 2. Initially we performed the blank reactions as well as reactions with the pure TiO2 and observed no activity. Increasing the loading of Pd metal from 1% to 5% increased the catalytic activity, although not proportionally, and also increased the selectivity of 2-MF significantly.
We have previously reported the characterization of all these catalysts with the variation of Pd metal loading.9 The particle size of Pd was found to be very low (<2 nm) and there was no major difference observed in the particle size distribution when the metal loading was increased from 1% to 5% wt. Given the uniformity of the particle size distribution we can link the increased catalytic activity to an increased concentration of active metal sites.
A time on line study for FFR hydrogenation was performed using 5% Pd/TiO2 catalyst and the activity data is provided in Fig. 1. As expected there was an increase in conversion with an increase in the reaction time from 30 min to 180 min. In the initial 30 min only 2-MF and FA were formed with no side products being observed, an increase in the amount of byproducts was observed, however, when the reaction was performed over longer times. Small amounts of THFA were also observed which could be a hydrogenation product of FFR or FA. It is possible for side reactions from FA and 2-MF to occur as shown in Scheme 1, which can further react to form various other molecules like acetals and ketals.
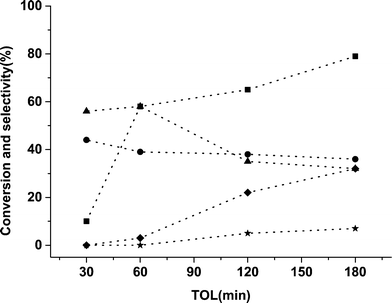 | ||
| Fig. 1 Time online data for FFR hydrogenation with 5% Pd/TiO2 catalyst. Key: ■ conversion, ● 2-MF, ▲ FA, ✦ THFA, ★ other minor products. | ||
From the data in Fig. 1 it is apparent that the monometallic 5% Pd/TiO2 catalyst displays high activity for FFR hydrogenation and the selectivity of 2-MF and FA was high but there was still a significant number of side products. We have previously shown that the addition of a second metal (Sn) into Pd/TiO2 catalyst can improve the selectivity pattern in FA hydrogenation10 and changing the ratio of metals in a bimetallic catalyst can have a significant effect on the reaction profile in benzyl alcohol and hexenol oxidation reactions.29,30 Ru is one of the most studied metals for the hydrogenation reactions of furan-derived compounds,31–35 therefore, we synthesized bimetallic catalysts with the different ratios of Ru and Pd. The catalysts were tested for FFR hydrogenation reaction in octane at room temperature under 3 barg pressure of hydrogen. The data is presented in Table 3.
| Catalysts | Conversion (%) | Product selectivity (%) | ||||
|---|---|---|---|---|---|---|
| 2-MF | FA | THFA | Othersa | TOF(10−2) | ||
| Reaction conditions: RT, 3 barg H2, catalyst (0.1 g), FFR (1 g), octane (15 ml), 120 min.a Acetals, ketals and polymers. | ||||||
| 5% Ru/TiO2 | 8.2 | 0 | 100 | 0 | 4.1 | |
| 4% Ru–1% Pd/TiO2 | 5 | 9.2 | 83.8 | 0 | 6.8 | 2.5 |
| 3% Ru–2% Pd/TiO2 | 21.5 | 15.1 | 67.9 | 0 | 17.1 | 1.0 |
| 2.5% Ru–2.5% Pd/TiO2 | 33.8 | 14 | 58 | 0.4 | 27.6 | 1.6 |
| 2% Ru–3% Pd/TiO2 | 30 | 8.7 | 65.8 | 0 | 23.8 | 1.5 |
| 1% Ru–4% Pd/TiO2 | 39.3 | 51.5 | 45.3 | 1.1 | 2.1 | 1.9 |
| 0.5% Ru–4.5% Pd/TiO2 | 39.2 | 50.8 | 39.8 | 1.8 | 7.6 | 1.6 |
| 5% Pd/TiO2 | 65.4 | 36.2 | 28.6 | 4.8 | 30.4 | 3.2 |
Monometallic 5% Ru/TiO2 catalysts whilst exhibiting a lower catalytic activity produced exclusively FA. The addition of a small amount of Pd showed a decrease in selectivity towards FA and the formation of 2-MF was obvious.
Furthermore increasing the Pd content, whilst maintaining an overall 5 wt% metal loading, served to increase the catalytic activity and improved the selectivity towards FA compared with 2-MF. When both metals were present in a 1![[thin space (1/6-em)]](https://www.rsc.org/images/entities/char_2009.gif) :
:![[thin space (1/6-em)]](https://www.rsc.org/images/entities/char_2009.gif) 1 ratio the conversion was high and FA was the dominant product and lower amounts of 2-MF (also a consecutive product of FA) were observed. Interestingly, much lower amounts of side products was observed with the 1% Ru–4% Pd/TiO2 catalyst. This catalyst showed the highest selectivity to 2-MF and FA compared with the pure monometallic 5% Ru/TiO2 and 5% Ru/TiO2 catalysts. The small amount of ruthenium metal may have prevented the side reaction pathways, allowing the consecutive hydrogenation reaction to take place. Further increasing the amount of Pd from 4% to 4.5% showed no particular change in activity or selectivity to 2-MF but the number of side products increased from 2 to 7%. From these data we conclude that the addition of 1% Ru into Pd/TiO2 is optimal composition required for the synthesis of 2-MF and FA from FFR under these reaction conditions. Luo et al. have reported the use of palladium ruthenium alloyed catalysts for the hydrogenation, suggesting that the palladium dilutes and separates the active ruthenium sites,36 it is possible that we are observing a similar effect for this case, however, for this reaction the palladium is the active species being diluted and isolated by the ruthenium.
1 ratio the conversion was high and FA was the dominant product and lower amounts of 2-MF (also a consecutive product of FA) were observed. Interestingly, much lower amounts of side products was observed with the 1% Ru–4% Pd/TiO2 catalyst. This catalyst showed the highest selectivity to 2-MF and FA compared with the pure monometallic 5% Ru/TiO2 and 5% Ru/TiO2 catalysts. The small amount of ruthenium metal may have prevented the side reaction pathways, allowing the consecutive hydrogenation reaction to take place. Further increasing the amount of Pd from 4% to 4.5% showed no particular change in activity or selectivity to 2-MF but the number of side products increased from 2 to 7%. From these data we conclude that the addition of 1% Ru into Pd/TiO2 is optimal composition required for the synthesis of 2-MF and FA from FFR under these reaction conditions. Luo et al. have reported the use of palladium ruthenium alloyed catalysts for the hydrogenation, suggesting that the palladium dilutes and separates the active ruthenium sites,36 it is possible that we are observing a similar effect for this case, however, for this reaction the palladium is the active species being diluted and isolated by the ruthenium.
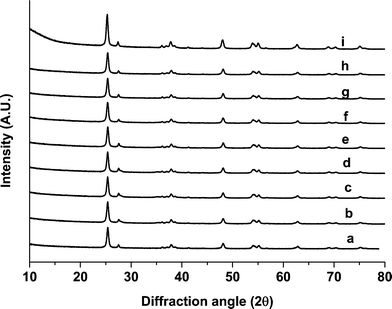
Powder X-ray diffraction (XRD) patterns of monometallic unreduced Ru/TiO2, Pd/TiO2 and Ru/Pd/TiO2 catalysts are shown in Fig. 2. There was no significant difference observed between these catalysts and the major component reflections were related with titania (P25). We have used a mixture of anatase and rutile titania and both of these phases remained stable. It suggested that either the particle size of Pd and Ru particles (metallic or oxide) was too small to be detected by XRD or the metals were homogeneously dispersed on the surface of TiO2.
To try to explain the differences observed in the catalytic performance for the catalysts we analyzed them using TEM, and the representative images are shown in Fig. 3 and the associated particle size distributions are shown in Fig. 4. The most active catalyst was the 5% Pd/TiO2 and we have previously reported the characterization of this catalyst,9 it had an average particle size of 1.1 nm. The catalysts in general seem to have lower activity as the ratio of palladium/ruthenium decreased. The 0.5% Ru![[thin space (1/6-em)]](https://www.rsc.org/images/entities/char_2009.gif) :
:![[thin space (1/6-em)]](https://www.rsc.org/images/entities/char_2009.gif) 4.5% Pd/TiO2 and 1% Ru
4.5% Pd/TiO2 and 1% Ru![[thin space (1/6-em)]](https://www.rsc.org/images/entities/char_2009.gif) :
:![[thin space (1/6-em)]](https://www.rsc.org/images/entities/char_2009.gif) 4% Pd/TiO2 catalysts display identical conversions (39%), the TEM analysis of these catalysts reveals that they also have a very small average particle sizes of 1.3 and 1.1 nm respectively (Fig. 3, 4e and f). This is slightly larger than those reported for the 5% Pd/TiO2 catalyst. This suggests that there is an inverse relationship between the activity and the particle size for this reaction system. There are, however, significant differences in the selectivity of the two catalysts which suggests the reaction pathways are more related to the composition of the catalysts than the particle size.
4% Pd/TiO2 catalysts display identical conversions (39%), the TEM analysis of these catalysts reveals that they also have a very small average particle sizes of 1.3 and 1.1 nm respectively (Fig. 3, 4e and f). This is slightly larger than those reported for the 5% Pd/TiO2 catalyst. This suggests that there is an inverse relationship between the activity and the particle size for this reaction system. There are, however, significant differences in the selectivity of the two catalysts which suggests the reaction pathways are more related to the composition of the catalysts than the particle size.
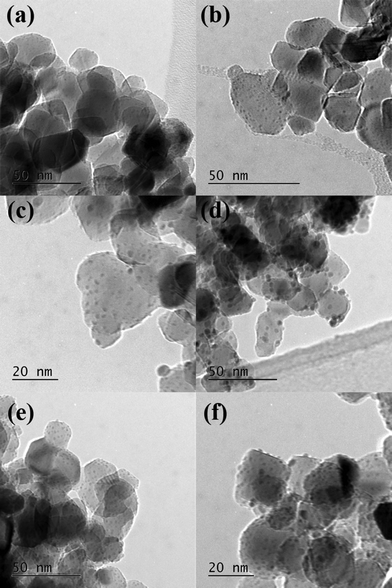 | ||
| Fig. 3 TEM images of a) 4% Ru–1% Pd/TiO2; b) 3% Ru–2% Pd/TiO2; c) 2.5% Ru–2.5% Pd/TiO2, d) 2% Ru–3% Pd/TiO2; e) 1% Ru 4% Pd/TiO2 and f) 0.5% Ru–4.5% Pd/TiO2. | ||
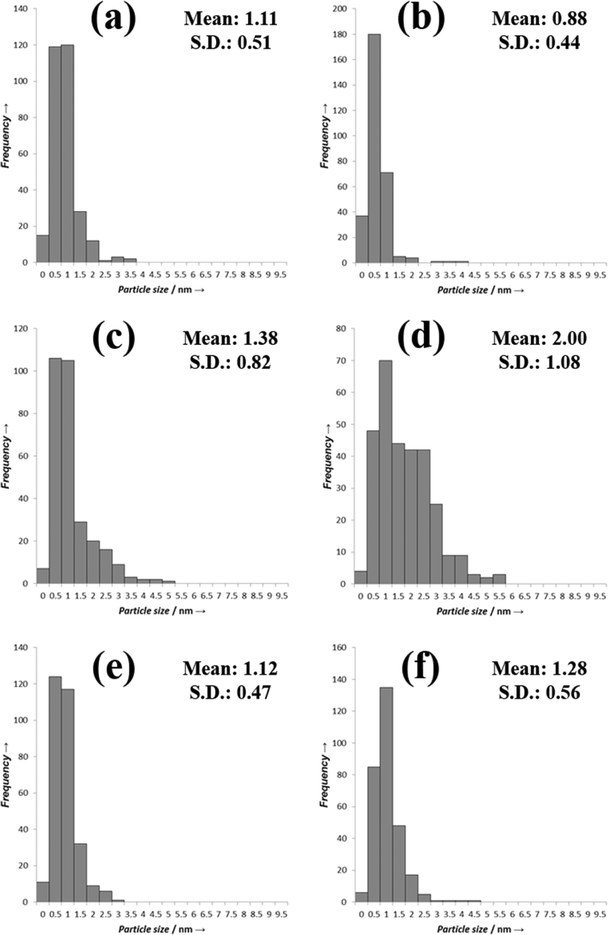 | ||
| Fig. 4 TEM PSDs a) 4% Ru–1% Pd/TiO2; b) 3% Ru–2% Pd/TiO2; c) 2.5% Ru–2.5% Pd/TiO2, d) 2% Ru–3% Pd/TiO2; e) 1% Ru 4% Pd/TiO2 and f) 0.5% Ru–4.5% Pd/TiO2. | ||
2% Ru![[thin space (1/6-em)]](https://www.rsc.org/images/entities/char_2009.gif) :
:![[thin space (1/6-em)]](https://www.rsc.org/images/entities/char_2009.gif) 3% Pd/TiO2 has a slightly lower activity than that would be expected from the pattern observed for the other catalysts. The TEM images and PSD are shown in Fig. 3d. The average particle size for this catalyst is larger than those with the lower amounts of palladium at 2 nm, Fig. 4d shows that the particles seem to be larger with some evidence of clusters forming, interestingly the 2.5% Ru–2.5% Pd/TiO2 catalyst (Fig. 3c) has a smaller average particle size, with some evidence of slightly larger particles seen but not as many as the 2% Ru–3% Pd/TiO2 catalyst. Again this may correlate directly with the conversion data with the 2.5% Ru–2.5% Pd/TiO2 catalysts slightly more active than the 2% Ru
3% Pd/TiO2 has a slightly lower activity than that would be expected from the pattern observed for the other catalysts. The TEM images and PSD are shown in Fig. 3d. The average particle size for this catalyst is larger than those with the lower amounts of palladium at 2 nm, Fig. 4d shows that the particles seem to be larger with some evidence of clusters forming, interestingly the 2.5% Ru–2.5% Pd/TiO2 catalyst (Fig. 3c) has a smaller average particle size, with some evidence of slightly larger particles seen but not as many as the 2% Ru–3% Pd/TiO2 catalyst. Again this may correlate directly with the conversion data with the 2.5% Ru–2.5% Pd/TiO2 catalysts slightly more active than the 2% Ru![[thin space (1/6-em)]](https://www.rsc.org/images/entities/char_2009.gif) :
:![[thin space (1/6-em)]](https://www.rsc.org/images/entities/char_2009.gif) 3% Pd/TiO2 catalyst.
3% Pd/TiO2 catalyst.
The catalysts with the lowest amount of palladium, 3% Ru–2% Pd/TiO2 and 4% Ru–1% Pd/TiO2 (Fig. 3b and a respectively), once again have a smaller particle size, however, the activity of these catalysts is lower, suggesting that at low palladium content the particle size is not the only factor that affects the activity. As the most active catalyst was the palladium monometallic catalyst and the ruthenium monometallic catalyst was amongst the least active catalyst it seems likely that the palladium is the active component in these catalysts, we suggest that when the relative amount of ruthenium in the catalyst becomes too large the catalysts loses activity as the substrate can no longer access the active palladium sites. Interestingly the 3% Ru–2% Pd/TiO2 catalyst has the smallest particle size of all the catalysts studied in this work and also has a conversion that is relatively higher than would be expected if the activity was solely related to the palladium content. Overall the TEM suggests that to form an active catalyst for this reaction small particle are required, however a significant amount of the metal component must be palladium but the amount of ruthenium can be tuned to affect the reaction selectivity.
TPR measurements were performed with all the catalysts in order to investigate the reducibility of metal oxide species. A combined TPR profile is presented in Fig. 5. Monometallic 5% Ru/TiO2 catalyst (a) showed a reduction peak above 150 °C which became broader with an addition of Pd (b–e). On the other hand the monometallic 5% Pd/TiO2 (h) catalyst showed a reduction peak at a temperature less than 100 °C. The catalysts with 1% Ru/4% Pd (f) and 0.5% Ru/4.5% Pd (g) showed a very different reduction behavior compared with the other bimetallic catalysts. A feature was observed around 100 °C in both of these catalysts which can be related to the emission of trapped hydrogen (Pd β hydride species) above 90 °C. This feature of hydrogen evolution indicates that hydrogen can be adsorbed on the surface of the catalyst at sub ambient temperatures and gets released in the form of hydrogen molecules when the temperature is raised above 90 °C.37 To further probe the nature of the metal particles we performed CO chemisorption studies with these catalysts and normalized the metal surface area with the activity. We observed that the specific activity was not a function of the metal surface area. As expected, the Pd dispersion increased with an increase in the concentration of Pd.
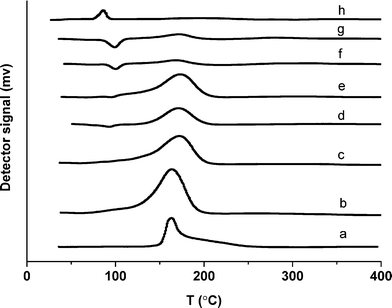 | ||
| Fig. 5 TPR profile of (a) 5% Ru/TiO2, (b) 4% Ru–1% Pd/TiO2, (c) 3% Ru–2% Pd/TiO2, (d) 2.5% Ru–2.5% Pd/TiO2, (e) 2% Ru–3% Pd/TiO2, (f) 1% Ru–4% Pd/TiO2, (g) 0.5% Ru–4.5% Pd/TiO2, (h) 5% Pd/TiO2. | ||
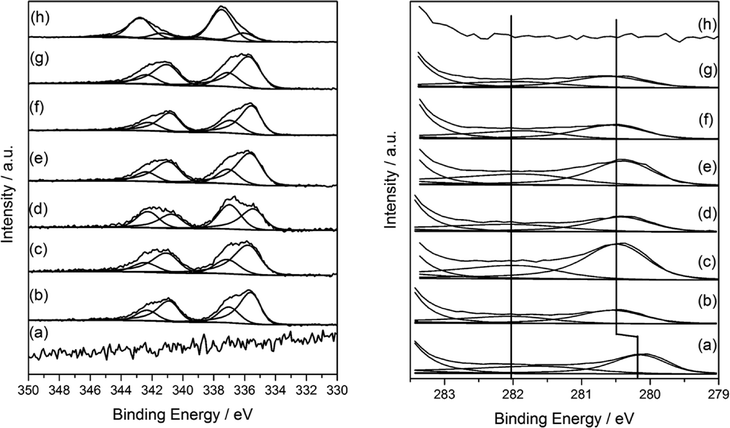
XPS analysis of mono and bimetallic unreduced catalysts are presented in Fig. 6. It revealed multiple oxidation states for both Pd and Ru. For monometallic 5% Pd, the spectra was dominated by a signal at 337.7 eV attributable to Pd–Cl bonds with a ratio of ca. 1![[thin space (1/6-em)]](https://www.rsc.org/images/entities/char_2009.gif) :
:![[thin space (1/6-em)]](https://www.rsc.org/images/entities/char_2009.gif) 1 and supported by the significant residual chlorine at 198.4 eV which is characteristic of metal–chlorine bonds and as observed for Pd deposited from solution on Fe3O4.38 Additionally, PdO was also evident at 336 eV. In contrast, the monometallic ruthenium catalyst was found to be chloride free, but exhibited two species with binding energies of 280.1 and 280.8 eV attributable to Ru(0)39 and RuO2 respectively40 in a 1
1 and supported by the significant residual chlorine at 198.4 eV which is characteristic of metal–chlorine bonds and as observed for Pd deposited from solution on Fe3O4.38 Additionally, PdO was also evident at 336 eV. In contrast, the monometallic ruthenium catalyst was found to be chloride free, but exhibited two species with binding energies of 280.1 and 280.8 eV attributable to Ru(0)39 and RuO2 respectively40 in a 1![[thin space (1/6-em)]](https://www.rsc.org/images/entities/char_2009.gif) :
:![[thin space (1/6-em)]](https://www.rsc.org/images/entities/char_2009.gif) 1 ratio suggesting the metallic ruthenium was covered by an oxide layer. The presence of RuO2 was also supported by the O (1s) shoulder ca. 529 eV consistent with the RuO2.
1 ratio suggesting the metallic ruthenium was covered by an oxide layer. The presence of RuO2 was also supported by the O (1s) shoulder ca. 529 eV consistent with the RuO2.
For the bimetallic catalysts, the two Ru oxidation states remain, although for the 3% Ru–2% Pd/TiO2 catalyst and those with a higher Pd content, there was a 0.4 shift to higher binding energy for the Ru(3d) signals and attributed to a particle size effect, however, the Ru(0)/Ru(IV) ratio remained constant at ca. 1![[thin space (1/6-em)]](https://www.rsc.org/images/entities/char_2009.gif) :
:![[thin space (1/6-em)]](https://www.rsc.org/images/entities/char_2009.gif) 1. No shift in Pd binding energy was seen with changing the metal ratio, neither were shifts or reduced species observed in the Ti(2p) spectra as reported previously by Luo et al. for RuPd/TiO2 systems.36 Instead, the Pd was present at 335.5 eV (Pd(0)) and 337.1 eV (Pd–Cl) which was different to that of the monometallic where both Pd–Cl and PdO were observed. It is worthy to note that the Pd(0) binding energy was somewhat higher than that expected for metallic Pd particles and may be attributable to (i) Pd2+ species formed by a charge transfer with Cl−1 which remains on the surface, or (ii) particle size dependent screening effects of the Pd core-hole which results in higher binding energies for the smaller particles.41–43 Based on the microscopy (Fig. 2 and 3) the latter is considered to be the case here.
1. No shift in Pd binding energy was seen with changing the metal ratio, neither were shifts or reduced species observed in the Ti(2p) spectra as reported previously by Luo et al. for RuPd/TiO2 systems.36 Instead, the Pd was present at 335.5 eV (Pd(0)) and 337.1 eV (Pd–Cl) which was different to that of the monometallic where both Pd–Cl and PdO were observed. It is worthy to note that the Pd(0) binding energy was somewhat higher than that expected for metallic Pd particles and may be attributable to (i) Pd2+ species formed by a charge transfer with Cl−1 which remains on the surface, or (ii) particle size dependent screening effects of the Pd core-hole which results in higher binding energies for the smaller particles.41–43 Based on the microscopy (Fig. 2 and 3) the latter is considered to be the case here.
Conclusions
We have reported an efficient and novel catalyst composition for the conversion of FFR into useful organic molecules (2-MF, and 2FA) at room temperature and low hydrogen pressure. Overall we conclude that the most effective catalyst for this reaction is the 1% Ru![[thin space (1/6-em)]](https://www.rsc.org/images/entities/char_2009.gif) :
:![[thin space (1/6-em)]](https://www.rsc.org/images/entities/char_2009.gif) 4% Pd/TiO2. This catalyst represented the best compromise of conversion of FFR and selectivity to the desired products 2-MF and FA. TEM particle size distributions of the catalysts indicated that for this reaction small metal particles are required; however, the particle size is not the only consideration when trying to optimise these catalysts. XPS suggested that the oxidation state of the ruthenium is also an important factor as when the relative amount of ruthenium in the metallic sate was increased the activity was reduced. By tuning the ratio of palladium to ruthenium we can form a catalyst where we can direct the selectivity towards the products that are useful as fuel additives under mild, green reaction conditions.
4% Pd/TiO2. This catalyst represented the best compromise of conversion of FFR and selectivity to the desired products 2-MF and FA. TEM particle size distributions of the catalysts indicated that for this reaction small metal particles are required; however, the particle size is not the only consideration when trying to optimise these catalysts. XPS suggested that the oxidation state of the ruthenium is also an important factor as when the relative amount of ruthenium in the metallic sate was increased the activity was reduced. By tuning the ratio of palladium to ruthenium we can form a catalyst where we can direct the selectivity towards the products that are useful as fuel additives under mild, green reaction conditions.
Acknowledgements
The authors would like to thank the EPSRC (EP/K014854/1) and the Research Campus at Harwell for access to the transmission electron microscope. The raw data is provided in DOI: 10.17035/d.2015.100119. Obaid F. Aldosari would like to thank Royal embassy of Saudi Arabia for funding his PhD.References
- G. W. Huber, S. Iborra and A. Corma, Chem. Rev., 2006, 106, 4044–4098 CrossRef CAS PubMed.
- J.-P. Lange, D. H. E. Van, B. J. Van and R. Price, ChemSusChem, 2012, 5, 150–166 CrossRef CAS PubMed.
- J. G. Stevens, R. A. Bourne, M. V. Twigg and M. Poliakoff, Angew. Chem., Int. Ed., 2010, 49, 8856–8859 CrossRef CAS PubMed.
- Y. Nakagawa, M. Tamura and K. Tomishige, ACS Catal., 2013, 3, 2655–2668 CrossRef CAS.
- H. Zhang, C. Canlas, A. Jeremy Kropf, J. W. Elam, J. A. Dumesic and C. L. Marshall, J. Catal., 2015, 326, 172–181 CrossRef CAS.
- A. Corma, S. Iborra and A. Velty, Chem. Rev., 2007, 107, 2411–2502 CrossRef CAS PubMed.
- H. Adkins and R. Connor, J. Am. Chem. Soc., 1931, 53, 1091–1095 CrossRef CAS.
- B. Zhang, Y. Zhu, G. Ding, H. Zheng and Y. Li, Green Chem., 2012, 14, 3402–3409 RSC.
- S. Iqbal, X. Liu, O. F. Aldosari, P. J. Miedziak, J. K. Edwards, G. L. Brett, A. Akram, G. M. King, T. E. Davies, D. J. Morgan, D. K. Knight and G. J. Hutchings, Catal. Sci. Technol., 2014, 4, 2280–2286 CAS.
- G. M. King, S. Iqbal, P. J. Miedziak, G. L. Brett, S. A. Kondrat, B. R. Yeo, X. Liu, J. K. Edwards, D. J. Morgan, D. K. Knight and G. J. Hutchings, ChemCatChem, 2015, 7, 2122–2129 CrossRef CAS.
- D. Liu, D. Zemlyanov, T. Wu, R. J. Lobo-Lapidus, J. A. Dumesic, J. T. Miller and C. L. Marshall, J. Catal., 2013, 299, 336–345 CrossRef CAS.
- J. G. M. Bremner and R. K. F. Keeys, J. Chem. Soc., 1947, 1068–1080 RSC.
- Y.-L. Zhu, H.-W. Xiang, Y.-W. Li, H. Jiao, G.-S. Wu, B. Zhong and G.-Q. Guo, New J. Chem., 2003, 27, 208–210 RSC.
- J. Lessard, J.-F. Morin, J.-F. Wehrung, D. Magnin and E. Chornet, Top. Catal., 2010, 53, 1231–1234 CrossRef CAS.
- Y. Wang, M. Zhou, T. Wang and G. Xiao, Catal. Lett., 2015, 145, 1557–1565 CrossRef CAS.
- D. Vargas-Hernandez, J. M. Rubio-Caballero, J. Santamaria-Gonzalez, R. Moreno-Tost, J. M. Merida-Robles, M. A. Perez-Cruz, A. Jimenez-Lopez, R. Hernandez-Huesca and P. Maireles-Torres, J. Mol. Catal. A: Chem., 2014, 383–384, 106–113 CrossRef CAS.
- M. M. Villaverde, N. M. Bertero, T. F. Garetto and A. J. Marchi, Catal. Today, 2013, 213, 87–92 CrossRef CAS.
- Z. Li, G. Wang and W. Li, Adv. Mater. Res., 2012, 599, 27–31 CrossRef CAS.
- C. Xu, L. Zheng, D. Deng, J. Liu and S. Liu, Catal. Commun., 2011, 12, 996–999 CrossRef CAS.
- F. Dong, Y. Zhu, G. Ding, J. Cui, X. Li and Y. Li, ChemSusChem, 2015, 8, 1534–1537 CrossRef CAS PubMed.
- K. Fulajtarova, T. Sotak, M. Hronec, I. Vavra, E. Dobrocka and M. Omastova, Appl. Catal., A, 2015, 502, 78–85 CrossRef CAS.
- P. Panagiotopoulou, N. Martin and D. G. Vlachos, ChemSusChem, 2015, 8, 2046–2054 CrossRef CAS PubMed.
- M. J. Gilkey, P. Panagiotopoulou, A. V. Mironenko, G. R. Jenness, D. G. Vlachos and B. Xu, ACS Catal., 2015, 5, 3988–3994 CrossRef CAS.
- S. Sitthisa, W. An and D. E. Resasco, J. Catal., 2011, 284, 90–101 CrossRef CAS.
- Z. Li, S. Kelkar, C. H. Lam, K. Luczek, J. E. Jackson, D. J. Miller and C. M. Saffron, Electrochim. Acta, 2012, 64, 87–93 CrossRef CAS.
- H.-Y. Zheng, Y.-L. Zhu, B.-T. Teng, Z.-Q. Bai, C.-H. Zhang, H.-W. Xiang and Y.-W. Li, J. Mol. Catal. A: Chem., 2006, 246, 18–23 CrossRef CAS.
- S. H. Pang, C. A. Schoenbaum, D. K. Schwartz and J. W. Medlin, ACS Catal., 2014, 4, 3123–3131 CrossRef CAS.
- P. A. Tooley, C. Ovalles, S. C. Kao, D. J. Darensbourg and M. Y. Darensbourg, J. Am. Chem. Soc., 1986, 108, 5465–5470 CrossRef CAS.
- J. Pritchard, L. Kesavan, M. Piccinini, Q. He, R. Tiruvalam, N. Dimitratos, J. A. Lopez-Sanchez, A. F. Carley, J. K. Edwards, C. J. Kiely and G. J. Hutchings, Langmuir, 2010, 26, 16568–16577 CrossRef CAS PubMed.
- H. Alshammari, P. J. Miedziak, D. J. Morgan, D. W. Knight and G. J. Hutchings, Green Chem., 2013, 15, 1244–1254 RSC.
- G. R. Jenness and D. G. Vlachos, J. Phys. Chem. C, 2015, 119, 5938–5945 CAS.
- R. Herbois, S. Noel, B. Leger, S. Tilloy, S. Menuel, A. Addad, B. Martel, A. Ponchel and E. Monflier, Green Chem., 2015, 17, 2444–2454 RSC.
- A. A. Dwiatmoko, S. Lee, H. C. Ham, J.-W. Choi, D. J. Suh and J.-M. Ha, ACS Catal., 2015, 5, 433–437 CrossRef CAS.
- R. M. Mironenko, O. B. Belskaya, T. I. Gulyaeva, A. I. Nizovskii, A. V. Kalinkin, V. I. Bukhtiyarov, A. V. Lavrenov and V. A. Likholobov, Catal. Today, 2015, 249, 145–152 CrossRef CAS.
- N. S. Biradar, A. A. Hengne, S. N. Birajdar, R. Swami and C. V. Rode, Org. Process Res. Dev., 2014, 18, 1434–1442 CrossRef CAS.
- W. Luo, M. Sankar, A. M. Beale, Q. He, C. J. Kiely, P. C. A. Bruijnincx and B. M. Weckhuysen, Nat. Commun., 2015, 6, 6540 CrossRef CAS PubMed.
- U. S. Ozkan, M. W. Kumthekar and G. Karakas, Catal. Today, 1998, 40, 3–14 CrossRef CAS.
- H.-F. Wang, H. Ariga, R. Dowler, M. Sterrer and H.-J. Freund, J. Catal., 2012, 286, 1–5 CrossRef CAS.
- C. Elmasides, D. I. Kondarides, W. Gruenert and X. E. Verykios, J. Phys. Chem. B, 1999, 103, 5227–5239 CrossRef CAS.
- S. Iqbal, S. A. Kondrat, D. R. Jones, D. C. Schoenmakers, J. K. Edwards, L. Lu, B. R. Yeo, P. P. Wells, E. K. Gibson, D. J. Morgan, C. J. Kiely and G. J. Hutchings, ACS Catal., 2015, 5, 5047–5059 CrossRef CAS.
- M. G. Mason, Phys. Rev. B: Condens. Matter, 1983, 27, 748–762 CrossRef CAS.
- G. K. Wertheim, S. B. DiCenzo and S. E. Youngquist, Phys. Rev. Lett., 1983, 51, 2310–2313 CrossRef CAS.
- F. A. Marks, I. Lindau and R. Browning, J. Vac. Sci. Technol., A, 1990, 8, 3437–3442 CAS.
| This journal is © The Royal Society of Chemistry 2016 |

