 Open Access Article
Rhodamine B derivatives-modified upconversion nanoparticles as a fluorescent turn-off–on sensor for the highly sensitive detection of Cu2+ and pyrophosphate†
Zhipeng
Meng
a,
Suli
Wu
 *a,
Linghua
Zhong
a,
Min
Zeng
a,
Xiaoqian
Sun
a,
Lu
Li
b and
Shufen
Zhang
 a
a
aState Key Laboratory of Fine Chemicals, Dalian University of Technology, 2 Linggong Road, Dalian 116024, P. R. China. E-mail: wusuli@dlut.edu.cn
bQingdao University of Science and Technology, 53 Zhengzhou Road, Qingdao 266000, P. R.![[thin space (1/6-em)]](https://www.rsc.org/images/entities/char_2009.gif) China
China
First published on 13th November 2018
Abstract
Rhodamine B derivatives (RBP)-modified UCNPs (UCNPs@mSiO2–RBP) were developed as a fluorescent turn-off–on sensor based on FRET and IFE to detect Cu2+ and pyrophosphate (PPi) with a wide linear response range (0–10 μM for Cu2+ and 5–35 μM for PPi, much wider than that reported previously) and high sensibility (117 nM for Cu2+ and 70 nM for PPi). The MTT experiments and the bioimaging experiments show its promising prospect in tissue imaging.
Introduction
Copper ions and pyrophosphate (P2O74−, PPi) are critical to human bodies. Excess and lack of Cu2+ ions both can lead to severe diseases such as Alzheimer's disease, while pyrophosphate (PPi) plays an important role in various life activities. Hence, developing an effective method to detect Cu2+ and PPi in environmental and biological samples is very important as they are important bio-functional anions.Fluorescent sensing strategy is widely used for bio-detection due to its simple, real-time and in vivo detection. The recognition of PPi is generally performed by utilizing metal ion complexes as binding sites because PPi lacks UV-Vis absorbance and fluorescence. The complexing of metal ions with PPi can generate the strong UV-Vis absorbance and thus result in changes in fluorescence signal. Therefore, fluorescence techniques have been employed in the detection of PPi in the past decades.1–3 Cu2+ ions can be used to detect PPi due to the strongly complexing ability of PPi to Cu2+.1 Several fluorescence probes have been developed to sequentially detect Cu2+ and PPi.4–7 However, most fluorescence probes respond mainly to relatively short wavelengths of light irradiation (e.g. UV). This may cause photodamage to tissues, and the lower penetration depth hampers their wide applications to some extent. Recently, upconversion fluorescence probes have earned people's attention due to their unique abilities, which can minimize autofluorescence from the biosamples and enhance the penetration depth in tissues.
To date, hybrids of upconversion nanoparticles (UCNPs) with chromophores have been fabricated for the detection of important biological species and toxins, such as DNA,8 CN−,9 Hg2+,10 Zn2+,11 and H2S.12 These hybrid sensors are based on the process of energy-transfer from UCNPs to chromophores to “turn on” or “turn off” the upconversion luminescence. Recently, several rhodamine B derivatives RBH-modified UCNP sensors have been reported to detect Cu2+ ions.13–15 However, there are very few reports on the use of UCNPs to detect PPi. Wang et al. reported that branched polyethyleneimine (PEI)-capped NaGdF4:Yb/Tm UCNPs can be used as a fluorescence probe for the sequential detection of Cu2+ and pyrophosphate (P2O74−, PPi).4 However, the sensor exhibited a narrow linear response range (0.1–2 μM for Cu2+ and 0.5–8 μM for PPi). Therefore, it is of importance to develop upconversion probes with a broad liner range.
Herein, we developed a rhodamine B derivative RBP- (RBP was synthesized according to literature,16,17 as shown in Fig. S1†) modified UCNPs as a sensor to detect Cu2+ and PPi. RBP was usually used to serve as a “turn-on” fluorescent sensor for Al3+ with strong fluorescent response, but it was rarely reported as a fluorescent sensor for Cu2+ due to its weak fluorescent response. It was found that RBP had only weak UV-Vis absorbance but showed strong fluorescence response to Al3+. In contrast, the response of RBP to the copper is very different from the Al3+, the strong UV-Vis absorbance will appear when Cu2+ was added to RBP solution due to the paramagnetism of copper ions, but the fluorescence response to Cu2+ is weak, which shows that RBP has higher responding speed and intensity of UV-Vis absorbance than the traditional probe RBH to detect Cu2+.13–15
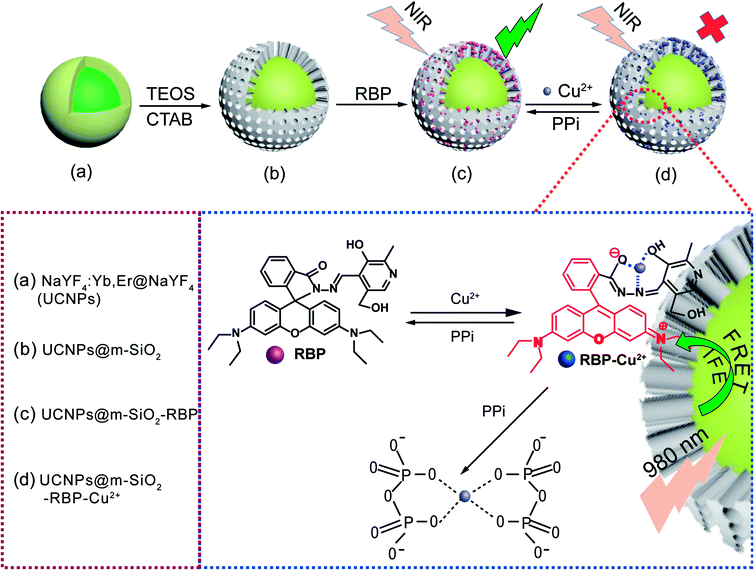
In this study, we aimed to achieve efficient FRET (fluorescence resonance energy transfer) and IFE (internal filter effect) from UCNPs to RBP, which was expected to have strong UV-Vis absorbance response. Hence, RBP was selected as a chromophore to modify UCNPs owing to its strong UV-Vis absorbance response towards Cu2+. In the hybrid RBP–UCNPs sensing system, the added Cu2+ will coordinate with RBP and lead to a strong quenching of the upconversion luminescence. When PPi was present, it could bind strongly with Cu2+ and thus turn on the fluorescence of the UCNPs (Scheme 1).
Results and discussions
Preparation of UCNPs and the UCNPs@mSiO2–RBP composite probe
NaYF4:Yb3+,Er3+UCNPs were synthesized by the reported co-precipitation method.18 To enhance the emission intensity of the UCNPs, an inert layer of NaYF4 was coated onto their surface by a typical core–shell approach.19,20 The TEM images of the as-prepared NaYF4:Yb3+,Er3+ and NaYF4:Yb3+,Er3+@NaYF4 UCNPs displayed uniform shape and size, and the corresponding XRD patterns shown in Fig. S3c† were well indexed to the standard card of β-NaYF4 (JCPDS 16-0334). In addition, the luminescence spectra in Fig. S3d† indicate that core–shell strategy significantly improved the luminous intensity. The core–shell structure exhibits strong green emissions at 525 nm and 546 nm, originating from the transition of 2H11/2 → 4I15/2 and 4S3/2 → 4I15/2 of Er3+. The EDX spectrum of NaYF4:Yb3+,Er3+ illustrated in Fig. S4(a)† implies that the main constituents in the studied samples are F, Na, Y, Yb and Er. Furthermore, the elemental mapping of F, Na, Y, Yb and Er (Fig. S4(c)–(g)†) and the total image formed by overlapping the elemental maps also indicate that various elements are well distributed in the entire range of nanoparticles (Fig. S4(b)†).Aimed towards loading RBP and detecting PPi in aqueous solution, the UCNPs were coated by mesoporous silica (mSiO2). UCNPs@mSiO2 was characterized by TEM, FT-IR and luminescence spectroscopy. The TEM images in Fig. S5a and b† clearly demonstrate the formation of the SiO2 layer on the surface of UCNPs. Furthermore, through ion exchange with ammonium nitrate, CTAB molecules were removed and mSiO2 were formed. In the FT-IR spectra in Fig. S5c,† the stretching vibration peaks disappeared, which further confirmed the removal of CTAB. The emission spectra in Fig. S5d† disclosed that the removal of CTAB has a minor effect on the emission properties of UCNPs. Then, a certain amount of the as-prepared UCNPs@mSiO2 was added to the 20 μM rhodamine B derivative RBP solution and stirred overnight to obtain the fluorescent probe UCNPs@mSiO2–RBP.
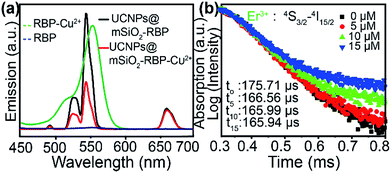
As shown in Fig. 1a, UCNPs@mSiO2–RBP showed strong green emissions at 525 nm and 546 and a weak red emission, similar to that of unmodified UCNPs, because RBP has no evident absorbance in the visible region. However, green emission intensity was significantly quenched after the addition of Cu2+ due to the strong absorbance of RBP–Cu2+ from 520 nm to 600 nm. The strong affinity between Cu2+ and PPi leads to the formation of the Cu2+–PPi complex and results in the detachment of Cu2+ from the UCNPs@mSiO2–RBP probe; thus, the fluorescence is triggered by the addition of PPi. A significant decrease in the Er3+ 4S3/2 → 4I15/2 lifetime was observed when Cu2+ was added to UCNPs@mSiO2–RBP from 0 μM to 10 μM (Fig. 1b, measured with the modified Edinburgh FS5 fluorescence spectrometer under a frequency of 20 Hz and a pulse width of 300 μs to modulate the 980 nm laser), which is solid evidence for FRET. However, the lifetime of Er3+ emission changed slightly when the concentration of Cu2+ was increased from 10 μM to 15 μM, while the PL intensity of the composite probe decreased significantly (Fig. 2b), indicating that IFE also worked in this quenching process. These results suggest that FRET and IFE are the two main processes in the detection process.
Detecting Cu2+ and PPi
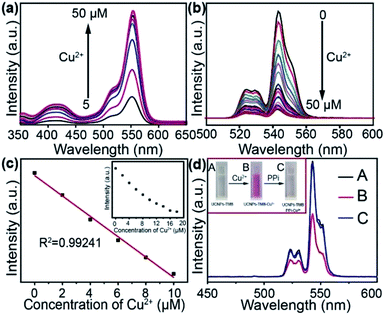
First, the sensing ability of UCNPs@mSiO2–RBP towards Cu2+ was studied by UV-Vis absorbance spectroscopy with different concentrations of Cu2+. From the absorbance spectra (Fig. 2a), it can be found that the absorbance intensity at the peak (500–600 nm) increased with the increase in concentration of the Cu2+ ion. Fig. S6† shows the linear plot of the concentration of Cu2+versus the absorbance intensity.To certify the energy transfer of UCNPs emission to RBP, the effect of Cu2+ concentration on the upconversion emission intensity of the UCNPs@mSiO2–RBP sensing system was explored. Fig. 2b shows a gradual decrease of green upconversion emission intensity with the increase in amount of Cu2+ in the range of 0–50 μM. When the Cu2+ concentration reached 50 μM, the upconversion emission at 540 nm quenched by about 92% of the initial emission intensity of UCNPs@mSiO2–RBP. As shown in Fig. 2c, the concentration of Cu2+ exhibited a linear correlation with the emission intensity of UCNPs@mSiO2–RBP with an R2 of 0.99241 in the concentration range of 0–10 μM, which was much wider than that for the recently reported fluorescence methods.4 The limit of detection for the concentration of Cu2+ was calculated to be 117 nM based on 3σ/slop, where σ was the standard deviation of the blank samples and slop was the slope of the calibration curve. Herein, RBP has relatively broader linear range than previously reported RBH, which can be reasoned by the different intensities of UV-Vis of RBP and RBH toward Cu2+, shown in Fig. S2.† The high sensibility for Cu2+ of RBP can be attributed to its molecular structure. RBP was synthesized by RBH and pyridoxal hydrochloride (as shown in Fig. S1†), which has larger electron cloud density than RBH and thus, it can combine with Cu2+ more easily.
To prove the high selectivity of the developed sensor for Cu2+, the effect of other cations, including K+ Ca2+ Na+ Zn2+ Ba2+, Al3+ and Mn2+, on the UV-Vis absorbance spectrum was investigated. When the concentration of Cu2+ was maintained at 20 μM and that of other cations was 100 μM, no apparent signal change was observed in contrast to Cu2+ except for the signal change due to Al3+, as shown in Fig. S7,† which displayed a slight response to UV-Vis irradiation at 520–560 nm.
The fluorescence intensity of the system could be recovered on adding PPi to the system, which can be attributed to the stronger coordination effect between PPi with Cu2+ than RBP since PPi can effectively withdraw the Cu2+ from the complexes of UCNPs@mSiO2–RBP–Cu2+. In fact, the same mechanism for detecting PPi has been described in previously reported studies.6,21,22 The photographs of UCNPs@mSiO2–RBP and the emission spectra of UCNPs@mSiO2–RBP after adding Cu2+ and PPi in sequence (Fig. 2d) clearly showed this fluorescence “turn-off–on” process.
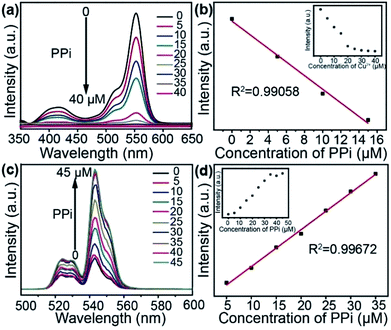
At the same time, we also studied the sensing ability of UCNPs@mSiO2–RBP–Cu2+ toward PPi via UV-Vis absorbance spectroscopy. The absorbance intensity of UCNPs@mSiO2–RBP–Cu2+ decreased linearly in a certain range (0–15 μM, Fig. 3b) with the increase in concentration of PPi (Fig. 3a), which approved that the strong complexing of PPi with Cu2+ plays a crucial role in this process.
To examine the feasibility of using UCNPs@mSiO2–RBP–Cu2+ as the turn-on sensing probes for PPi, different concentrations of PPi were added into the solutions containing UCNPs@mSiO2–RBP (RBP: 20 μM, UCNPS@mSiO2: 10 mg mL−1) and Cu2+ (20 μM) under optimal conditions. Fig. 3c shows that the fluorescence intensity of the system could be gradually recovered on increasing the concentration of PPi, and almost 100% of the initial fluorescence intensity recovered when the concentration of PPi reached 45 μM. In addition, a linear fitting curve of fluorescence intensity versus concentration of PPi was obtained in the range of 5–35 μM, with an R2 value of 0.99672 (Fig. 3d). The limit of detection (LOD) was estimated to be 70 nM based on 3σ/slop. Compared with the reported results of the detection of Cu2+ and PPi (Table S1 and S2†), our results also show the good ability for ion detection.
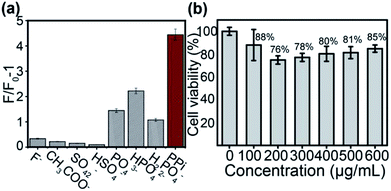
The specificity of UCNPs@mSiO2–RBP–Cu2+ toward PPi was also evaluated; the fluorescence response of UCNPs@mSiO2–RBP–Cu2+ toward PPi was examined with the existence of PO43−, HPO42−, H2PO4−, Ac−, SO42−, HSO4− or F− inions under the same concentration as PPi. Fig. 4a shows the intensity of (F/F0 − 1) against the concentrations of PPi and other anions. It is evident that only PPi resulted in drastic fluorescence recovery. The anions PO43−, HPO42−, H2PO4− also caused fluorescence recovery to some degree, which may be due to the similar chemical structures to form stable metal chelates. The influence of phosphate anions could be considered to be acceptable due to the much weaker recovered fluorescence intensity than that recovered by PPi, while other anions had slight effects on changes in fluorescence intensity. These results indicated that our probe had good specificity for PPi detection.
Cell cytotoxicity and in vivo imaging of the composite probe
The effect of UCNPs@mSiO2–RBP on the proliferation of HeLa cells was investigated by a standard MTT assay. As shown in Fig. 4b, the cell viability is still satisfactory when the concentration of the nanoprobe is raised to 600 μg mL−1. These results show that the cytotoxicity of the composite probe is weak, and can be applied in bioimaging.Furthermore, bioimaging experiments were performed. All procedures and operations were performed according to the Guide for the Care and Use of Laboratory Animal Resources and the National Research Council, and were approved by the Institutional Animal Care and Use Committee of the NIH.
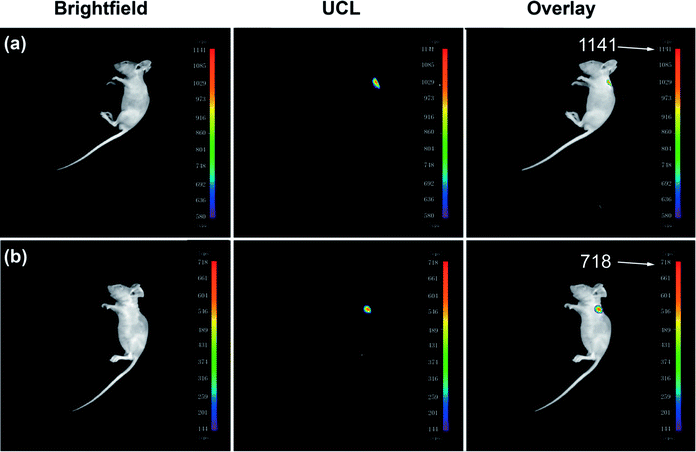
Nude mice (∼10 g) were purchased from the Dalian Medical University (Dalian, China) and were used in imaging studies. 100 μL of 0.9% NaCl saline solution containing the RBP-coated UCNPs (10 mg mL−1) were subcutaneously injected into the back area of nude mice (∼10 g) anesthetized with chloral hydrate. The mice were then imaged using a modified NightOWL II LB983 small animal in vivo imaging system equipped with a sensitive charge-coupled device (CCD) camera with the excitation of a 980 nm laser (c.w.). Other mice underwent the same process except with an injection of 100 μL of Cu2+ solution (50 μM) in the same place after injecting UCNPs@mSiO2–RBP. As shown in Fig. 5, in vivo imaging shows the promising prospect in tissue imaging, and the decrease in the imaging intensity from 1141 to 718 after injecting Cu2+ indicated that UCNPs@mSiO2–RBP has good ability to detect Cu2+in vivo.
Conclusions
In summary, in this study, we used RBP-modified UCNPs@mSiO2 as a probe to detect Cu2+ and PPi. The results show that the fluorescence intensity of UCNPs mSiO2–RBP is almost linear with the concentrations of Cu2+ ions in the range of 0–10 μM. The detection limit is 117 nM. We further used the UCNPs@mSiO2–Cu2+ complex as a probe to detect PPI because of the strong interactions between PPi and Cu2+. These results show that the fluorescence intensity of UCNPs@mSiO2–RBP–Cu2+ has a strong linear correlation with the concentration of PPi ion in the range of 5–35 μM, and the detection limit is about 70 nM. The cytotoxicity of this sensing system is weak, and in vivo imaging shows its promising prospect in tissue imaging and good ability to detect Cu2+in vivo.Experimental
Experimental details and characterization data can be found in the ESI.†Conflicts of interest
There are no conflicts to declare.Acknowledgements
This study was financially supported by the National Natural Science Foundation of China (21878042, 21476040, 21276040, 21536002) and the Fund for Innovative Research Groups of the National Natural Science Fund Committee of Science (21421005).Notes and references
- Z. S. Qian, L. J. Chai, Y. Y. Huang, C. Tang, J. Jia Shen, J. R. Chen and H. Feng, Biosens. Bioelectron., 2015, 68, 675–680 CrossRef CAS.
- S. Kim, M. S. Eom, S. K. Kim, S. H. Seo and M. S. Han, Chem. Commun., 2013, 49, 152–154 RSC.
- X. Feng, Y. An, Z. Yao, C. Li and G. Shi, ACS Appl. Mater. Interfaces, 2012, 4, 614–618 CrossRef CAS.
- F. Wang, C. Zhang, Q. Xue, H. Li and Y. Xian, Biosens. Bioelectron., 2017, 95, 21–26 CrossRef CAS.
- L. Wang, Q. Song, Q. Liu, D. He and J. Ouyang, Adv. Funct. Mater., 2015, 25, 7017–7027 CrossRef CAS.
- S. Lee, K. K. Y. Yuen, K. A. Jolliffe and J. Yoon, Chem. Soc. Rev., 2015, 44, 1749–1762 RSC.
- X. Huang, Z. Guo, W. Zhu, Y. Xie and H. Tian, Chem. Commun., 2008, 5143–5145 RSC.
- M. Kumar, Y. Guo and P. Zhang, Biosens. Bioelectron., 2009, 24, 1522–1526 CrossRef CAS.
- L. Yao, J. Zhou, J. Liu, W. Feng and F. Li, Adv. Funct. Mater., 2012, 22, 2667–2672 CrossRef CAS.
- Q. Liu, J. Peng, L. Sun and F. Li, ACS Nano, 2011, 5, 8040–8048 CrossRef CAS.
- J. Peng, W. Xu, C. L. Teoh, S. Han, B. Kim, A. Samanta, J. C. Er, L. Wang, L. Yuan, X. Liu and Y. T. Chang, J. Am. Chem. Soc., 2015, 137, 2336–2342 CrossRef CAS.
- J. Peng, C. L. Teoh, X. Zeng, A. Samanta, L. Wang, W. Xu, D. Su, L. Yuan, X. Liu and Y.-T. Chang, Adv. Funct. Mater., 2016, 26, 191–199 CrossRef CAS.
- B. Gu, M. Ye, L. Nie, Y. Fang, Z. Wang, X. Zhang, H. Zhang, Y. Zhou and Q. Zhang, ACS Appl. Mater. Interfaces, 2018, 10, 1028–1032 CrossRef CAS.
- Y. Xu, H. Li, X. Meng, J. Liu, L. Sun, X. Fan and L. Shi, New J. Chem., 2016, 40, 3543–3551 RSC.
- C. Li, J. Liu, S. Alonso, F. Li and Y. Zhang, Nanoscale, 2012, 4, 6065–6071 RSC.
- Q. Huang, Q. Zhang, E. Wang, Y. Zhou, H. Qiao, L. Pang and F. Yu, Spectrochim. Acta, Part A, 2016, 152, 70–76 CrossRef CAS.
- Y. Xiang, L. Mei, N. Li and A. Tong, Anal. Chim. Acta, 2007, 581, 132–136 CrossRef CAS.
- F. Wang, R. Deng and X. Liu, Nat. Protoc., 2014, 9, 1634–1644 CrossRef CAS PubMed.
- P. Ghosh, J. Oliva, E. D. l. Rosa, K. K. Haldar, D. Solis and A. Patra, J. Phys. Chem. C, 2008, 112, 9650–9658 CrossRef CAS.
- P. Hu, X. Wu, S. Hu, Z. Chen, H. Yan, Z. Xi, Y. Yu, G. Dai and Y. Liu, Photochem. Photobiol. Sci., 2016, 15, 260–265 RSC.
- K. Xu, Z. Chen, L. Zhou, O. Zheng, X. Wu, L. Guo, B. Qiu, Z. Lin and G. Chen, Anal. Chem., 2015, 87, 816–820 CrossRef CAS.
- K. Selvaprakash and Y.-C. Chen, Biosens. Bioelectron., 2014, 61, 88–94 CrossRef CAS.
Footnote |
| † Electronic supplementary information (ESI) available: 1H NMR spectra of RBH and RBP, TEM images of UCNPs and UCNPs@mSiO2, powder-XRD, EDX spectrum and elemental mapping of the UCNPs, IR spectra and emission intensity of the UCNPs@mSiO2, absorption spectra of the PBP and RBH, and selectivity test for the RBP to the Cu2+, and the linear plot of detection (absorbance) of Cu2+. See DOI: 10.1039/c8ra08090a |
| This journal is © The Royal Society of Chemistry 2018 |

