 Open Access Article
Joint and unique multiblock analysis of biological data – multiomics malaria study†
Izabella
Surowiec
ab,
Tomas
Skotare
 a,
Rickard
Sjögren
 ab,
Sandra
Gouveia-Figueira
a,
Judy
Orikiiriza
cde,
Sven
Bergström
 f,
Johan
Normark
f and
Johan
Trygg
 *ab
*ab
aComputational Life Science Cluster (CLiC), Department of Chemistry, Umeå University, Linnaeus väg 10, 901 87 Umeå, Sweden. E-mail: johan.trygg@umu.se; Tel: +46 730647137
bSartorius Stedim Data Analytics, Tvistevägen 48, 907 36 Umeå, Sweden
cInfectious Diseases Institute, College of Health Sciences, Makerere University, P.O. Box 22418, Kampala, Uganda
dDepartment of Immunology, Institute of Molecular Medicine, Trinity College Dublin, St. James’s Hospital, Dublin 8, Ireland
eRwanda Military Hospital, P.O. Box: 3377, Kigali, Rwanda
fDepartment of Molecular Biology, Umeå University, 901 87 Umeå, Sweden
First published on 11th February 2019
Abstract
Modern profiling technologies enable us to obtain large amounts of data which can be used later for a comprehensive understanding of the studied system. Proper evaluation of such data is challenging, and cannot be carried out by bare analysis of separate data sets. Integrated approaches are necessary, because only data integration allows us to find correlation trends common for all studied data sets and reveal hidden structures not known a priori. This improves the understanding and interpretation of complex systems. Joint and Unique MultiBlock Analysis (JUMBA) is an analysis method based on the OnPLS-algorithm that decomposes a set of matrices into joint parts containing variations shared with other connected matrices and variations that are unique for each single matrix. Mapping unique variations is important from a data integration perspective, since it certainly cannot be expected that all variation co-varies. In this work we used JUMBA for the integrated analysis of lipidomic, metabolomic and oxylipins data sets obtained from profiling of plasma samples from children infected with P. falciparum malaria. P. falciparum is one of the primary contributors to childhood mortality and obstetric complications in the developing world, which makes the development of new diagnostic and prognostic tools, as well as a better understanding of the disease, of utmost importance. In the presented work, JUMBA made it possible to detect already known trends related to the disease progression, but also to discover new structures in the data connected to food intake and personal differences in metabolism. By separating the variation in each data set into joint and unique, JUMBA reduced the complexity of the analysis and facilitated the detection of samples and variables corresponding to specific structures across multiple data sets, and by doing this enabled fast interpretation of the studied system. All of this makes JUMBA a perfect choice for multiblock analysis of systems biology data.
Introduction
Malaria remains a major global health and economic burden in spite of recent intense preventive measures, with the infection caused by the parasite being one of the primary contributors to childhood mortality and obstetric complications in the developing world.1 The biochemical mechanisms behind malaria pathogenesis and the impact of the parasite on the host response are still largely unknown. To decipher the underlying mechanisms of malaria, a holistic systems biology approach is crucial. Systems biology aims at a higher level of understanding of organisms by studying them as integrated systems of genetic, protein, metabolic, pathway and cellular events. Analysis of complex biological processes within a systems biology approach is now possible to achieve thanks to the extensive development of a range of ‘omics’ technologies (genomics, transcriptomics, proteomics, metabolomics, and beyond).2 All ‘omics’ technologies provide massive amounts of data, making analysis highly challenging and requiring powerful computational methods.3,4 Overcoming these challenges and using systems biology to understand the host–parasite relationship in malaria may lead to new ways of treating the malaria infection.Systems biology requires integrated analysis of multiple data sets. Although analysis of a single data set is a solved problem, integrated analysis of several different types of data sets, also called blocks, is challenging. At the same time, integration reveals previously unknown hidden structures across multiple data sets and detects samples and variables corresponding to them. Combining information from many data sets can also improve interpretation of the trends observed in the studied system. There exists a wide range of methods for integrated analysis, including methods based on network analysis,5,6 Bayesian factor analysis7 and multivariate linear projections.8–10 In this article we used Joint and Unique MultiBlock Analysis (JUMBA),11,12 which is a multivariate linear projection method. Such methods handle noisy, multicollinear data with many more variables than observations (samples), which is typical for biochemical and biological applications.
JUMBA is based on the OnPLS-algorithm8,13 and is used to perform unsupervised integration of multiple data sets, so called multiblock analysis. Multivariate linear projection methods such as JUMBA have long been used for both unsupervised analysis, for instance Principal Components Analysis (PCA), as well as supervised analysis, for instance Orthogonal Projects to Latent Structures (O-PLS).14 Although methods such as PCA can be used to analyse multiple blocks by combining the matrices into one,15,16 they do not distinguish between variation that is joint between blocks and unique variation, which makes interpretation difficult. To perform unsupervised integration of two blocks, O-PLS was modified into O2-PLS,17,18 which was later generalized into OnPLS.8,13 OnPLS is an algorithm that separates data matrices into variation joint between all or only some blocks as well as variation unique to each block. JUMBA is an OnPLS workflow that structures multiblock analysis via pre-processing, modelling, validation, visualization and interpretation of the data.11,12
There are several examples of the application of multiblock analysis based on multivariate linear projection methods in systems biology. O2-PLS has been used for combined modelling of transcript, protein and metabolite data in plant species,19,20 for multiblock analysis of fatty acid and lipid profiles in a mice model of familial dysbetalipoproteinemia21 and for integration of NMR and DIGE data from prostate cancer xenograft mice.22 OnPLS has been used for the integration of transcriptomic, proteomic and metabolomic data for the global investigation of stress response23 and secondary cell wall synthesis24 in Populus plants, as well as for transcriptomics, metabolomics, sphingolipids, oxylipins, and fatty acids interrogation of biological interactions in asthma.25 In all cases, integrated analysis increased the interpretability of the models and enabled important biological conclusions, which would not be possible to achieve with the application of other methods.
We have recently applied metabolomics profiling on plasma from children infected with malaria and showed that a metabolite signature could be used for decision support in disease staging and prognostication, with fatty acids being potential biomarker molecules.26 The study was later expanded to the analysis of another set of samples and application of an additional two platforms: LCMS lipid27 and oxylipin profiling.28 In these studies, we showed that the malaria infection altered the lipid and oxylipin patterns and that these changes could be connected to energy turnover and immune regulation. In the present study we wanted to see if we can confirm the findings from the analysis of separate data sets by application of a faster, integrative approach and to investigate if such an approach can provide more information about unknown trends/structures in the data that can be used for enhanced interpretation of the studied data sets. With this in mind, we have used JUMBA for multiblock analysis on lipidomic, metabolomic and oxylipins data sets obtained from profiling of plasma samples from children infected with P. falciparum malaria.
Experimental methods
Samples
Twenty plasma samples from each group of diagnostic categories: healthy controls, mild and severe malaria patients, were chosen from the 690 available, based on the clinical information using a full factorial design, as described before.26 The research was carried out according to The Code of Ethics of the World Medical Association (Declaration of Helsinki). Ethical clearance was obtained from the Rwanda National Ethics Committee RNEC (no. 279/RNEC/2010) and the Regional Ethical Committee in Umeå (no. 09–064). Written informed consent was provided by the parent or legal guardian of each participant.Data sets
Samples were extracted and analyzed with the GCMS metabolomics profiling method,29 with LCMS metabolomics and lipidomics profiling methods27 and with oxylipin targeted LCMS profiling.28 For easy interpretation, and due to the large overlap between detected compounds and the fact that they were extracted in the same sample preparation step, metabolomics GCMS and LCMS data (from both ionization modes) were combined into one metabolomic data set. For compounds that were common between platforms or between LCMS ionization modes, the ones with lower relative standard deviations in the pooled samples were kept in the table. The applied analytical procedures are given in ESI, File 1.†Data normalization, transformation and scaling
For the metabolomic data set, the compound peak areas were normalized using areas of internal standards, according to the following procedure: the PCA (with Unit Variance (UV) scaling without subtraction of the mean) on the peak areas of internal standards was calculated and the first component score value for each sample was used to normalize the resolved data by dividing the peak areas of each sample with the corresponding score value.30 The oxylipins data set was log-transformed and all three data sets were mean centered and scaled to unit variance before JUMBA analysis.Joint and unique multiblock analysis – JUMBA
JUMBA is a workflow for analyzing the underlying structures shared between multiple blocks of data measured on the same set of samples. JUMBA is based on the OnPLS-algorithm that decomposes the variation of data sets into joint and unique variation as well as residuals. Joint variation may be in common in all analyzed blocks, globally joint, or joint between some but not all, locally joint. A schematic overview of a three-block JUMBA model is given in Fig. 1. Even though JUMBA summarizes several blocks at the same time, the components can be investigated using scores and loadings in the same way as single-block methods, such as PLS or PCA. The scores show patterns among samples, and can be used to identify trends and outliers, while loadings show correlations between studied variables and their influence on the distribution of samples.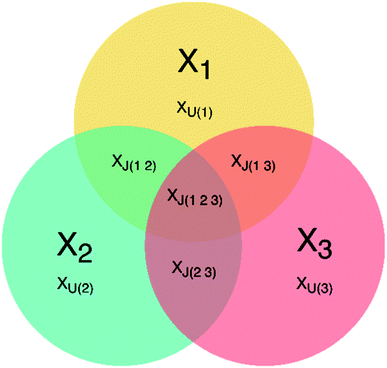 | ||
| Fig. 1 Overview of a three-block JUMBA model showing possible partition of the variation within three data sets: XJ – joint variation, XU – unique variation, 1, 2, 3 – number of data block. | ||
OnPLS, and therefore JUMBA, uses so called block-scores, meaning that each observation is assigned scores for each block instead of a single score per component across all blocks, which is the case for other multiblock methods, like, for example, JIVE and DISCO.31,32 The OnPLS-algorithm finds such block-scores that maximize the covariance across all blocks. Separate scores for each block make it possible to investigate how well samples correspond across blocks and may be used to identify observations that correspond poorly between blocks. A single score for each observation gives the impression of artificially strong correspondence across blocks, which limits interpretation.
In this study we used JUMBA11 to do multiblock analysis; we used the correlation matrix plot, multiblock scatter plot, explained variance plot and external responses correlation plot to evaluate and visualize the model. To visualize loadings, we used the correlation loadings, p(corr), since correlation loadings are scaled to correlations in the range −1 to 1, which simplifies interpretation.
The implementation of the algorithm was done using Mathworks MATLAB. The Pearson correlations were calculated using an in-house script written using the Anaconda Python distribution v. 3.5 (https://continuum.io) and plotted using the Matplotlib library (http://matplotlib.org/). Pathway enrichment analysis was performed on the p(corr) values above 0.2 using MetaboAnalyst 3.0.33
Results and discussion
Data analysis and pre-treatment
The fundamental requirement for the application of JUMBA is that there are two or more data sets where the observations can be matched in a 1![[thin space (1/6-em)]](https://www.rsc.org/images/entities/char_2009.gif) :
:![[thin space (1/6-em)]](https://www.rsc.org/images/entities/char_2009.gif) 1 fashion. Similar to other multivariate models, JUMBA is sample efficient and can handle noisy and collinear variables, meaning that it is well suited for, but not limited to, omics data. In data with very strong global variation patterns, as few as twelve observations can be successfully modelled, but inclusion of more observations is recommended. The number of samples included in this study was sufficient to produce good results.
1 fashion. Similar to other multivariate models, JUMBA is sample efficient and can handle noisy and collinear variables, meaning that it is well suited for, but not limited to, omics data. In data with very strong global variation patterns, as few as twelve observations can be successfully modelled, but inclusion of more observations is recommended. The number of samples included in this study was sufficient to produce good results.
Evaluation of the raw data before JUMBA is important, since disturbances within the data (such as strong outliers) will have a profound impact on the resulting model. In addition to platform specific quality control, single-block analysis of each block prior to multiblock analysis is recommended. The purpose of this is to determine suitable pre-processing for each block, detect and handle outlier observations and variables, and to preliminarily identify trends in each block. During the preliminary data check, two severe malaria samples turned out to have significantly different chromatograms in the GCMS analysis and one mild sample was lost during LCMS analysis, meaning that we removed these three samples from the final data sets. The final data sets consisted, therefore, of 57 samples, each characterized by 100 metabolites, 144 lipids and 37 oxylipins.
Skewness analysis revealed that many variables were not normally distributed, which was especially profound for the oxylipins data set, where no variable passed the normality test. Due to the skewed variable distributions, we chose to use log-transformation for the oxylipins data set before JUMBA. Data transformation influences the interpretation of the results and should therefore be used with caution.34 In our case, log transformation helped to obtain a less skewed distribution of samples for the oxylipins data set and hence eliminated the need to remove a number of samples due to their what seemed to be deviating behaviour.
JUMBA
Scores and loading values for all model components are given in ESI, File 2.†
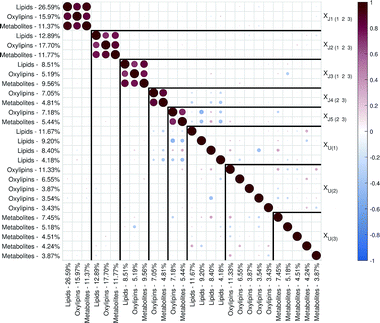 | ||
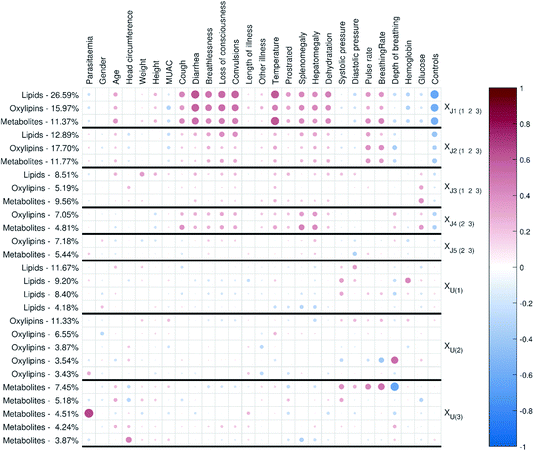
| Fig. 2 Correlation matrix plot for the malaria study; the color and area of the circles correspond to the sign and strength of the correlation, with increasing circle size and color intensity indicating increasing correlation (positive (red) or negative (blue)). The thick vertical and horizontal lines are a visual aid to see the distinction between model components and unique component blocks;11 J – joint component, U – unique component. | ||
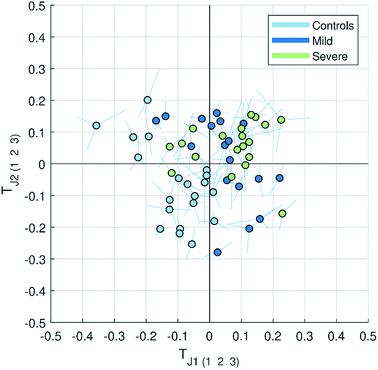 | ||
| Fig. 3 Multiblock scatter plot made for the JUMBA model showing how the observations varied across several blocks for the globally joint components TJ1 and TJ2. The samples are colored according to the class they belong to (controls, mild and severe malaria). The multiblock scatter plot is created by normalizing the score vectors to equal length, averaging the score values across blocks sample-wise and plotting them on a two dimensional plot as a mean score of each observation (sample), with lines drawn to each original block score value.11 A point with longer lines in comparison to others will correspond to the observation with a large variation in the score values. | ||
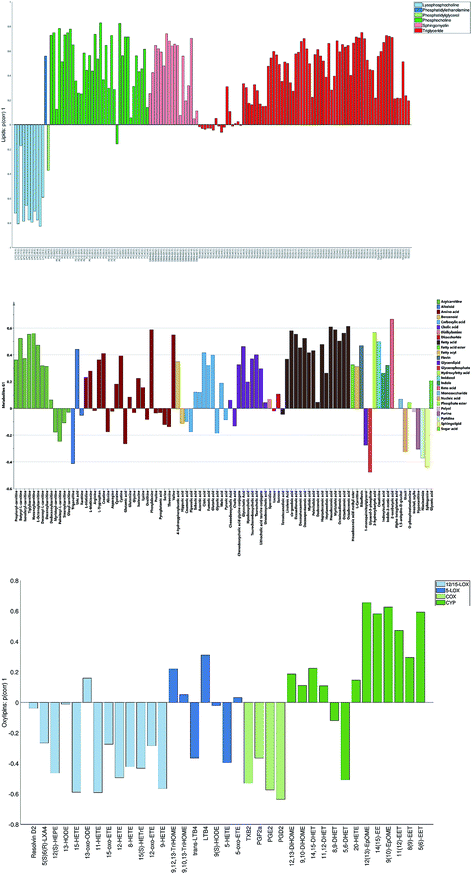
The loadings corresponding to the first globally joint component (Fig. 4) revealed that the main observed compounds that co-varied and were up-regulated in infected individuals were phosphatidylcholines, sphingomyelins and the majority of triacylglycerides (lipids data set), 67% of all detected metabolites in the metabolites data set, as well as the majority of compounds from CYP, four compounds from 5-LOX and one compound (13-oxo-ODE) from the 12/15-LOX synthesis pathway (oxylipins). The main compounds that co-varied and were down-regulated in infected individuals were lysophosphatidylcholines (lipids) and oxylipins from the COX and 12/15-LOX synthesis pathways (oxylipins). These results are consistent with the ones obtained from the OPLS-DA analysis of differences between patients and controls performed for separate data sets.27,28 This confirms that JUMBA can be used for the fast, successful integration and extraction of relevant information from the multiblock data.
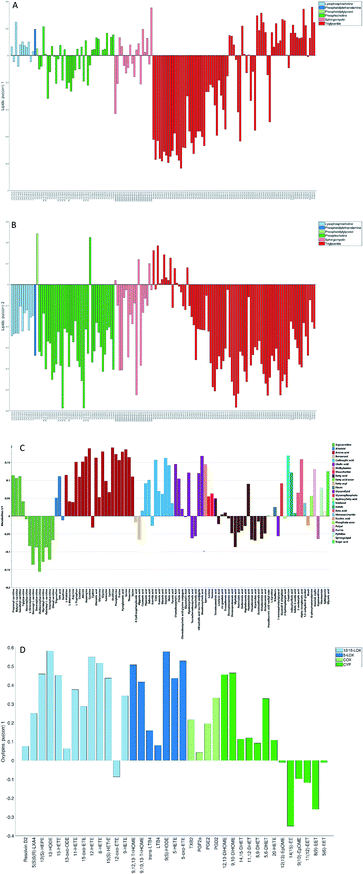
While finding correlations between different data sets corresponding to the known sample groups by studying data sets separately and then combining the results is possible to some extent, analysis of any trends in common between blocks that are not known a priori can only be carried out using an integrated approach. In this study we have focused on the analysis of the second and third globally joint, as well as locally joint vectors, to elucidate such trends.
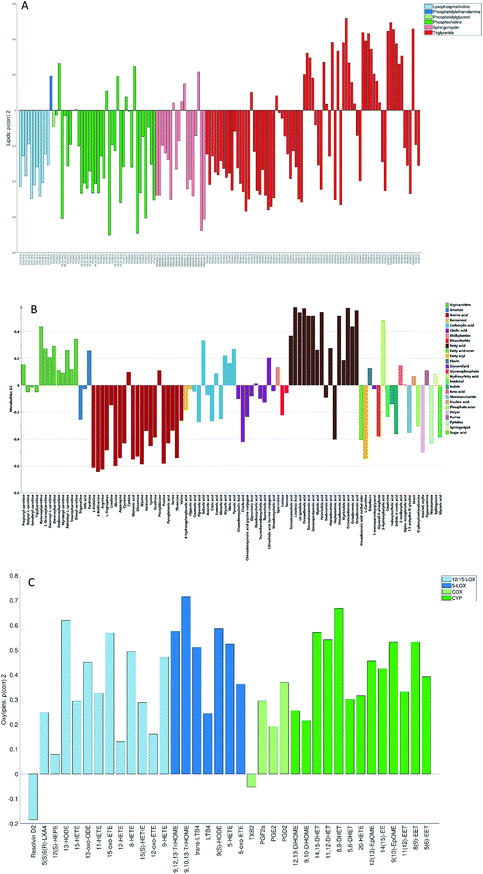
None of the trends observed in the second and third global components could be contributing to the previously known information about the samples. The loadings for the second globally joined vector, Fig. 5, show that the main trend observed with positive scores of the second globally joint component was down-regulation of the majority of phospholipids and triacylglycerides with lower carbon contents and higher degrees of saturation (lipids), down-regulation of amino acids with higher levels of fatty acids (metabolites) and higher levels of practically all oxylipins. The observed metabolic and oxylipin profiles correspond well to the ones observed in human plasma after the intake of a defined meal.35,36 Also, postprandial dyslipidemia is a well described phenomenon.37 Since samples included in this study were fed ad libitum, it is possible that some of them were taken shortly after a meal, and that the response to food intake represents part of the within-group variation described by the second globally joint component. Connection of the second joint component to the food intake can also be supported by the size of the variation in the data connected to this component – a similar size for the oxylipins and metabolic data sets and approximately two times lower for the lipidomic data set as compared to the variation connected to the first globally joined vector. It is reasonable to assume that the intake of a meal will have a large impact on the metabolic and lipid composition of plasma. As such, analysis of the second globally joint vector provided additional information about the trends common for the studied data sets, which would be difficult, if not impossible, to gain by the analysis of separate blocks.
Conclusions
In this study we have presented an integrative approach for the combined analysis of multiple data sets in clinical settings. Using JUMBA, we were able to reveal and analyse variation shared between lipidomic, metabolomic and oxylipin profiles of plasma that corresponded to intrinsically linked flows of information. Analysis of the joint loadings confirmed previously known trends in data related to the disease biochemistry and helped to immediately elucidate correlations between the studied data sets relating to these trends. We also revealed previously unknown trends that were most probably related to food intake and personal differences in the immunological response and general metabolism. Detection of those trends would not be possible to achieve by analysing each data set separately. Analysis of the relevant vectors from variations unique to each data block provided information specific for each data set that could be interesting both biologically, as well as from the analytical methodology point of view.We proved that JUMBA can successfully integrate data obtained from different analytical platforms, thanks to its robustness to noise and its compartmentalization of variation into joint and unique parts. Integrated analysis of multiple data sets provides a faster and easier means to visualize and hence interpret the found relationships rather than separate investigation of each data set. Our integrative approach revealed hidden structures in the data not known a priori. It also allowed the detection of samples and variables corresponding to the found structures across multiple data sets, such as food intake, personal response to the disease or platform specific variations. To summarize, JUMBA is an easy-to-use workflow to put multiple data sets together, which offers enhanced visualization and allows comprehensive interpretation of multiblock data. JUMBA is a suitable method for handling complex multi-omics data sets and has high potential to improve the biological understanding of the studied systems. However, as in the case of all multivariate modelling methods, also for the application of JUMBA, common sense is needed. In cases where there are very many and very noisy variables, there is always the risk of spurious correlations, meaning that components can be found just by pure chance. One way to alleviate this risk is to investigate each block separately by evaluating its structure using well-established metrics, like, for example, PCA. Since the OnPLS-algorithm finds linear components, it is not suitable for detecting non-linear relationships. In those cases, we recommend finding feature representations of the data that are able to represent non-linear relationships (for instance, polynomial features).
Conflicts of interest
There are no conflicts to declare.Acknowledgements
We would like to acknowledge the Swedish Metabolomics Centre for support with the chromatographic analysis.References
- P. F. Beales, B. Brabin, E. Dorman, L. Loutain, K. Marsh and M. E. Molyneux, et al., Severe falciparum malaria, Trans. R. Soc. Trop. Med. Hyg., 2000, 94, S1–S90 Search PubMed.
- A. Fukushima, M. Kusano, H. Redestig, M. Arita and K. Saito, Integrated omics approaches in plant systems biology, Curr. Opin. Chem. Biol., 2009, 13(5–6), 532–538 CrossRef CAS PubMed.
- S. E. Richards, M.-E. Dumas, J. M. Fonbille, T. M. D. Ebbels, E. Holmes and J. K. Nicholson, Intra- and inter-omic fusion of metabolic profiling data in a systems biology framework, Chemom. Intell. Lab. Syst., 2010, 104(1), 121–131 CrossRef CAS.
- A. R. Joyce and B. O. Palsson, The model organism as a system: integrating ’omics’ data sets, Nat. Rev. Mol. Cell Biol., 2006, 7(3), 198–210 CrossRef CAS PubMed.
- R. Shen, A. B. Olshen and M. Ladanyi, Integrative clustering of multiple genomic data types using a joint latent variable model with application to breast and lung cancer subtype analysis, Bioinformatics, 2009, 25(22), 2906–2912 CrossRef CAS PubMed.
- B. Wang, A. M. Mezlini, F. Demir, M. Fiume, Z. Tu and M. Brudno, et al., Similarity network fusion for aggregating data types on a genomic scale, Nat. Methods, 2014, 11(3), 333 CrossRef CAS PubMed.
- R. Argelaguet, B. Velten, D. Arnol, S. Dietrich, T. Zenz and J. C. Marioni, et al., Multi-Omics Factor Analysis—a framework for unsupervised integration of multi-omics data sets, Mol. Syst. Biol., 2018, 14(6), e8124 CrossRef PubMed.
- T. Lofstedt and J. Trygg, OnPLS-a novel multiblock method for the modelling of predictive and orthogonal variation, J. Chemom., 2011, 25(8), 441–455 Search PubMed.
- E. F. Lock, K. A. Hoadley, J. S. Marron and A. B. Nobel, Joint and individual variation explained (JIVE) for integrated analysis of multiple data types, Ann. Appl. Stat., 2013, 7(1), 523–542 CrossRef PubMed.
- M. Schouteden, K. Van Deun, S. Pattyn and I. Van Mechelen, SCA with rotation to distinguish common and distinctive information in linked data, Behav. Res. Methods, 2013, 45(3), 822–833 CrossRef PubMed.
- T. Skotare, R. Sjögren, I. Surowiec, D. Nilsson and J. Trygg, Visualization of descriptive multiblock analysis, J. Chemom., 2018, e3071 CrossRef.
- T. Skotare, D. Nilsson, S. J. Xiong, P. Geladi and J. Trygg, Joint and Unique Multiblock Analysis for integration and calibration transfer of NIR instruments, Anal. Chem., 2019, 91(5), 3516–3524 CrossRef CAS PubMed.
- T. Lostedt, D. Hoffman and J. Trygg, Global, local and unique decompositions in OnPLS for multiblock data analysis, Anal. Chim. Acta, 2013, 791, 13–24 CrossRef PubMed.
- J. Trygg and S. Wold, Orthogonal projections to latent structures (O-PLS), J. Chemom., 2002, 16(3), 119–128 CrossRef CAS.
- S. Wold, N. Kettaneh and K. Tjessem, Hierarchical multiblock PLS and PC models for easier model interpretation and as an alternative to variable selection, J. Chemom., 1996, 10(5–6), 463–482 CrossRef CAS.
- J. A. Westerhuis, T. Kourti and J. F. Macgregor, Analysis of multiblock and hierarchical PCA and PLS models, J. Chemom., 1998, 32, 301–321 CrossRef.
- J. Trygg, O2-PLS for qualitative and quantitative analysis in multivariate calibration, J. Chemom., 2002, 16(6), 283–293 CrossRef CAS.
- J. Trygg and S. Wold, O2-PLS, a two-block (X–Y) latent variable regression (LVR) method with an integral OSC filter, J. Chemom., 2003, 17(1), 53–64 CrossRef CAS.
- M. Bylesjo, R. Nilsson, V. Sirvastava, A. Grönlund, A. I. Johansson and S. Jansson, et al., Integrated Analysis of Transcript, Protein and Metabolite Data To Study Lignin Biosynthesis in Hybrid Aspen, J. Proteome Res., 2009, 8(1), 199–210 CrossRef PubMed.
- M. Bylesjo, D. Eriksson, M. Kusano, T. Moritz and J. Trygg, Data integration in plant biology: the O2PLS method for combined modeling of transcript and metabolite data, Plant J., 2007, 52(6), 1181–1191 CrossRef PubMed.
- G. M. Kirwan, E. Johansson, R. Kleemann, E. R. Verheji, Å. M. Wheelock and S. Goto, et al., Building Multivariate Systems Biology Models, Anal. Chem., 2012, 84(16), 7064–7071 CrossRef CAS PubMed.
- M. Rantalainen, O. Cloarec, O. Beckonert, I. D. Wilson, D. Jackson and R. Tonge, et al., Statistically integrated metabonomic-proteomic studies on a human prostate cancer xenograft model in mice, J. Proteome Res., 2006, 5(10), 2642–2655 CrossRef CAS PubMed.
- V. Srivastava, O. Obudulu, J. Bygdell, T. Löfstedt, P. Ryden and R. Nilsson, et al., OnPLS integration of transcriptomic, proteomic and metabolomic data shows multi-level oxidative stress responses in the cambium of transgenic hipI-superoxide dismutase Populus plants, BMC Genomics, 2013, 14, 893 CrossRef PubMed.
- O. Obudulu, N. Mähler, T. Skotare, J. Bygdell, I. N. Abreu and M. Ahnlund, et al., A multi-omics approach reveals function of secretory carrier-associated membrane proteins in wood formation of Populus trees, BMC Genomics, 2018, 19(1), 11 CrossRef PubMed.
- S. N. Reinke, B. Galindo-Prieto, T. Skotare, D. I. Broadhurst, A. Singhania and D. Horowitz, et al., OnPLS-based multi-block data integration: a multivariate approach to interrogating biological interactions in asthma, Anal. Chem., 2018, 90, 13400–13408 CrossRef CAS PubMed.
- I. Surowiec, J. Orikiiriza, E. Karlsson, M. Nelson, M. Bonde and P. Kyamanwa, et al., Metabolic signature profiling as a diagnostic and prognostic tool in pediatric Plasmodium falciparum malaria, Open Forum Infect. Dis., 2015, 2(2), ofv062 Search PubMed.
- J. Orikiiriza, I. Surowiec, E. Lindquist, M. Bonde, J. Magambo and C. Muhinda, et al., Lipid response patterns in acute phase paediatric Plasmodium falciparum malaria, Metabolomics, 2017, 13(4), 41 CrossRef PubMed.
- I. Surowiec, S. Gouveia-Figueira, J. Orikiiriza, E. Lindquist, M. Bonde and J. Magambo, et al., The oxylipin and endocannabidome responses in acute phase Plasmodium falciparum malaria in children, Malar. J., 2017, 16(1), 358 CrossRef PubMed.
- A. Jiye, J. Trygg, J. Gullberg, A. I. Johansson, P. Jonsson and H. Antti, et al., Extraction and GC/MS analysis of the human blood plasma metabolome, Anal. Chem., 2005, 77(24), 8086–8094 CrossRef PubMed.
- H. Redestig, A. Fukushima, H. Stenlund, T. Moritz, M. Arita and K. Saito, et al., Compensation for systematic cross-contribution improves normalization of mass spectrometry based metabolomics data, Anal. Chem., 2009, 81(19), 7974–7980 CrossRef CAS PubMed.
- E. F. Lock, K. A. Hoadley, J. S. Marron and A. B. Nobel, Joint and individual variation explained (JIVE) for integrated analysis of multiple data types, Ann. Appl. Stat., 2013, 7(1), 523–542 CrossRef PubMed.
- M. Schouteden, K. Van Deun, S. Pattyn and I. Van Mechelen, SCA with rotation to distinguish common and distinctive information in linked data, Behav. Res. Methods, 2013, 45(3), 822–833 CrossRef PubMed.
- J. G. Xia, I. V. Sinlenikov, B. Han and D. S. Wishart, MetaboAnalyst 3.0-making metabolomics more meaningful, Nucleic Acids Res., 2015, 43(W1), W251–W257 CrossRef CAS PubMed.
- C. Feng, W. Hongyue, N. Lu and X. M. Tu, Log transformation: application and interpretation in biomedical research, Stat. Med., 2013, 32(2), 230–239 CrossRef PubMed.
- S. Gouveia-Figueira, J. Späth, A. M. Zivkovic and M. L. Nording, Profiling the oxylipin and endocannabinoid metabolome by UPLC-ESI-MS/MS in human plasma to monitor postprandial inflammation, PLoS One, 2015, 10(7), e0132042 CrossRef PubMed.
- M. Karimpour, I. Surowiec, J. Wu, S. Gouveia-Figueira, R. Pinto and J. Trygg, et al., Postprandial metabolomics: A pilot mass spectrometry and NMR study of the human plasma metabolome in response to a challenge meal, Anal. Chim. Acta, 2016, 908, 121–131 CrossRef CAS PubMed.
- V. Higgins and K. Adeli, Postprandial Dyslipidemia: Pathophysiology and Cardiovascular Disease Risk Assessment, eJIFCC, 2017, 28(3), 168–184 CAS.
Footnote |
| † Electronic supplementary information (ESI) available. See DOI: 10.1039/c8fd00243f |
| This journal is © The Royal Society of Chemistry 2019 |

