 Open Access Article
What is the role of acid–acid interactions in asymmetric phosphoric acid organocatalysis? A detailed mechanistic study using interlocked and non-interlocked catalysts†‡
Dennis
Jansen
a,
Johannes
Gramüller
b,
Felix
Niemeyer
 a,
Torsten
Schaller
 a,
Matthias C.
Letzel
 c,
Stefan
Grimme
 d,
Hui
Zhu
*d,
Ruth M.
Gschwind
 *b and
Jochen
Niemeyer
 *a
*a
aFaculty of Chemistry (Organic Chemistry) and Center for Nanointegration Duisburg-Essen (CENIDE), University of Duisburg-Essen, Universitätsstrasse 7, 45141 Essen, Germany. E-mail: jochen.niemeyer@uni-due.de
bOrganic Chemistry, University of Regensburg, 93040 Regensburg, Germany
cInstitute of Organic Chemistry, University of Münster, Corrensstrasse 40, 48149 Münster, Germany
dMulliken Center for Theoretical Chemistry, Rheinische Friedrich-Wilhelms Universität Bonn, Beringstrasse 4, 53115 Bonn, Germany
First published on 7th April 2020
Abstract
Organocatalysis has revolutionized asymmetric synthesis. However, the supramolecular interactions of organocatalysts in solution are often neglected, although the formation of catalyst aggregates can have a strong impact on the catalytic reaction. For phosphoric acid based organocatalysts, we have now established that catalyst–catalyst interactions can be suppressed by using macrocyclic catalysts, which react predominantly in a monomeric fashion, while they can be favored by integration into a bifunctional catenane, which reacts mainly as phosphoric acid dimers. For acyclic phosphoric acids, we found a strongly concentration dependent behavior, involving both monomeric and dimeric catalytic pathways. Based on a detailed experimental analysis, DFT-calculations and direct NMR-based observation of the catalyst aggregates, we could demonstrate that intermolecular acid–acid interactions have a drastic influence on the reaction rate and stereoselectivity of asymmetric transfer-hydrogenation catalyzed by chiral phosphoric acids.
Introduction
Many organocatalysts, such as amines, diols, amino-acid derivatives, (thio)ureas or phosphoric acids are highly functionalized organic molecules, oftentimes featuring hydrogen-bond donor and acceptor moieties or even Brønsted-acidic and Brønsted-basic functional groups within the same molecule.1 Also, many organocatalytic reactions rely on the use of high catalyst loadings and are performed in aprotic organic solvents.2–4 This makes the formation of aggregates highly likely, be it catalyst·catalyst aggregates or higher-order catalyst·catalyst·substrate aggregates. The comprehension and control of such aggregation processes would not only enable a better understanding of organocatalytic processes, but also open up new possibilities in catalysis, when such catalyst aggregates can be designed and applied in a controlled fashion.In previous studies, aggregation of organocatalysts was observed in a few cases: in urea-catalysis, Jacobsen has shown that catalyst–catalyst interactions can be both detrimental and beneficial.5 The identification of cooperative substrate activation in a catalyst·catalyst·substrate complex led to the development of tethered6 and macrocyclic7 bis-urea catalysts. Supramolecular catalyst aggregation has also been observed for chincona-alkaloid based organocatalysts, in this case leading to catalyst deactivation and decreased enantioselectivities.8 In the case of BINOL-based phosphoric acids,9 Gong showed that acid–acid interactions lead to a different solubility of the racemic and homochiral catalyst species, resulting in strong nonlinear effects.10 Phosphoric acid aggregation has also been proven by spectroscopic means: dimers and trimers of dimethylphosphoric acid were identified by NMR11 and Hunger could show the presence of multimers for complexes of diphenyl phosphoric acid and a quinoline.12 For chiral phosphoric acids (CPA) with a BINOL-backbone, extended aromatic surfaces allow additional weak non-covalent interactions, which further stabilize hydrogen-bonded catalyst·substrate complexes,13,14 and can also enable the formation of higher aggregates, such as dimers of CPA·imine complexes.15
We recently found that integration of two BINOL-phosphoric acids in a catenane structure16 leads to drastic changes both in reaction rates and stereoselectivities for the transfer-hydrogenation of quinolines. DFT-calculations suggested that a hydrogen-bond mediated acid–acid interaction17,18 leads to a more stereoselective dimeric catalyst pathway (featuring two acids and both substrates), as opposed to a less stereoselective monomeric pathway (involving one acid and both substrates).
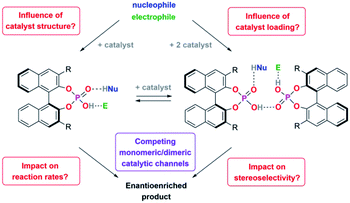
We thus concluded that the mechanical interlocking of two phosphoric acids is an effective means to channel the reaction through the dimeric pathway, but of course other factors that lead to increased acid–acid interactions (such as higher catalyst loadings) might have a similar effect (Scheme 1). This could impact the outcome of a large range of asymmetric transformations that are mediated by chiral Brønsted-acids.
For this reason, we have now performed a detailed mechanistic study, trying to shed light on these effects. We investigated the influence of the catalyst structure and loading, using catenated, macrocyclic and acyclic phosphoric acids as catalysts (catalysts 1/2/3, Scheme 2). This enabled us to understand how the competing catalytic pathways impact the catalytic reaction in terms of reaction rates and stereoselectivities, thus demonstrating the importance of acid–acid interactions in Brønsted-acid organocatalysis.
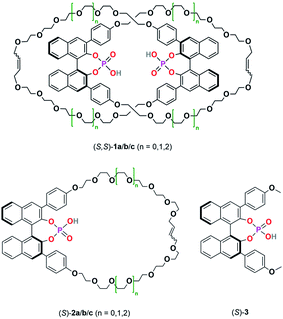 | ||
| Scheme 2 Catenated catalysts (S,S)-1a/b/c, macrocyclic catalysts (S)-2a/b/c and acyclic catalyst (S)-3 used in this study. | ||
Results and discussion
General approach
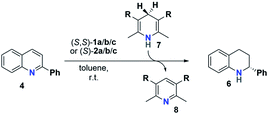
The reactivity and stereoselectivity of the three different catalysts were investigated using the reduction of 2-phenylquinoline 4 with dihydropyridine 7 (Hantzsch-ester) to give tetrahydroquinoline 6 and pyridine 8 (Table 1). The reaction was carried out in toluene at 25 °C, as established previously.17Time-resolved data were obtained by NMR-spectroscopy. Rate constants were determined by both nonlinear fitting19 and linear fitting of the conversion plots, which gave almost identical results (ESI Tables S4–S7‡ and chapter 9). We also performed reaction progress kinetic analysis (RPKA) based on different and same excess measurements.20 Mechanistic information was obtained by variable time normalization analysis (VTNA, see the ESI‡ chapter 4.4).21,22
Influence of the catenane ring sizes
As a starting point, we employed catenanes 1a/b/c with varying ring-sizes, assuming that the ring-size will influence the (mechano)intramolecular acid–acid interactions, thus affecting reaction rates and stereoselectivities. In addition to the previously reported hexaethyleneglycol-based species 1b/2b,16 we generated the smaller, pentaethyleneglycol-based systems 1a/2a and the larger, heptaethyleneglycol-based systems 1c/2c (ESI‡ chapter 2). Interestingly, there is a clear increase in yields of both catenanes and macrocycles with increasing ring size (5%/7%/10% for 1a/b/c and 8%/11%/15% for 2a/b/c),23 suggesting that the longer linkers have a sufficient length for the intramolecular ring-closing metathesis, while the shorter linkers lead to increased formation of oligomeric byproducts.In catalysis, the catenanes 1a/b/c show drastically enhanced stereoselectivities in comparison to the macrocycles 2a/b/c (as earlier reported for the 1b/2b pair).17 However, the was no impact of the ring-sizes on stereoinduction: Enantiomeric excesses were in the range of 81–84% in favor of the (R)-product for catenanes (S,S)-1a/b/c, while the macrocycles (S)-2a/b/c consistently favored the (S)-product with 12–17% ee. However, the reaction rates of 1a/b/c clearly depend on the ring-size, with the smaller catenanes showing higher rates (v0 = 3.7 × 10⁻⁷/3.1 × 10−7/2.0 × 10−7 M s−1 for 1a/b/c at 10% catalyst loading). This suggests that the geometry of the stereodetermining transition-states is not influenced by the ring-sizes, but the reaction rates are decreased. This might be due to intramolecular hydrogen bonding of the P(O)OH-unit to the ethylene glycol units (as found in our earlier DFT work17), which might be more prevalent in the larger systems.
First reduction step: kinetic analysis
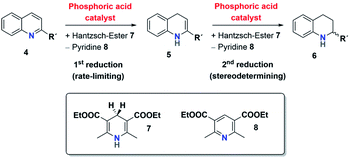
The mechanism for the phosphoric acid catalyzed transfer-hydrogenation of quinolines involves two steps (Scheme 3): first, quinoline 4 is reduced to the corresponding 1,4-dihydroquinoline 5, followed by reduction to the chiral 1,2,3,4-tetrahydroquinoline 6. Both steps involve activation of the substrate by protonation, followed by Hantzsch-ester coordination, hydride-transfer and product-dissociation. Like other phosphoric acid-catalyzed reactions, the stereoselectivity of such transfer-hydrogenation strongly depends on the nature of the phosphoric acid, with bulky 3,3′-substituents allowing for high stereoselectivities.9 Thus, excellent selectivities were achieved even at low catalyst loadings for 2-arylquinolines4a or benzoxazines4b using a phosphoric acid with phenanthryl-groups in the 3,3′-positions.This catalytic mechanism3,24 closely resembles the related transfer-hydrogenation of imines.25 Our recent DFT results support this mechanism and suggest that the rate-limiting transition state occurs in the first reduction of 4 to 5, namely in the protonation of the 1,4-dihydroquinoline-species. In comparison, the subsequent stereoselective second reduction towards 6 has a lower barrier. Moreover, our DFT-results suggest an additional mechanistic pathway involving two phosphoric acids, which we assume in the case of the catenane-catalysts 1.17
However, to the best of our knowledge, an experimental elucidation of these mechanisms has not been reported. To probe the suggested mechanism, we firstly determined the reaction orders for substrates 4 and 7 (reaction orders m, n) and the role of product inhibition. Secondly, the order of the catalyst (reaction order p) was determined for the catalysts 1c/2c/3
 | (1) |
The first analysis of the time-resolved NMR-data (ESI Fig. S2/S3‡) shows that the reduction of 4 to 6 occurs selectively with no side products. The intermediate 1,4-dihydroquinoline was not observed in any of our experiments, mainly due to its high free energy (low concentration) as suggested by our recent DFT-calculations.17 Since the reduction of 4 to 5 is rate-limiting, the reaction orders p, m, n describe the first reduction step from 4 to 5.
Substrate orders and product inhibition
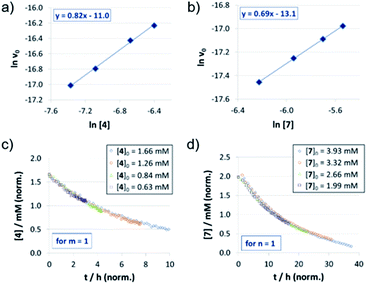
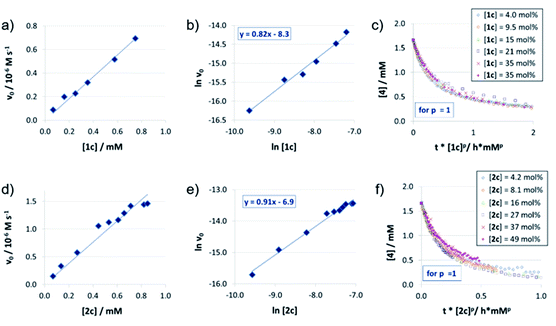
For the catenated catalyst 1c, rate measurements at different concentrations of quinoline 4 and Hantzsch-ester 7 indicated linear dependence of the reaction rate on the substrate concentrations. In the resulting ln![[thin space (1/6-em)]](https://www.rsc.org/images/entities/char_2009.gif) v0/ln[substrate] plots (Fig. 1a and b), we could determine reaction orders of 0.8 (for 4) and 0.7 (for 7), respectively. This is in good agreement with the VTNA-plots (Fig. 1c and d, see Fig. S7‡ for other values of m/n), which show excellent overlap of all curves for substrate orders of 1 for both the quinoline and the Hantzsch-ester.
v0/ln[substrate] plots (Fig. 1a and b), we could determine reaction orders of 0.8 (for 4) and 0.7 (for 7), respectively. This is in good agreement with the VTNA-plots (Fig. 1c and d, see Fig. S7‡ for other values of m/n), which show excellent overlap of all curves for substrate orders of 1 for both the quinoline and the Hantzsch-ester.
Accordingly, the substrate orders for the macrocyclic catalyst and acyclic catalysts 2c/3 were determined based on VTNA only. It was found that both substrates have a reaction order of close to 1 for both catalysts (ESI Fig. S11/S15‡). Thus, there is no difference with regard to the substrate orders for the different catalysts 1c/2c/3. In addition, we performed same excess experiments in order to investigate potential catalyst deactivation or product inhibition (ESI Fig. S10/S14/S19‡). In all cases, we observed only minor differences so that there seems to be neither catalyst deactivation nor product inhibition for all three catalysts 1c/2c/3.
Catalyst orders and aggregation
The reaction orders of the catalysts were determined in a series of experiments with different concentrations of catalysts 1c/2c/3. For the catenated and macrocyclic catalysts 1c/2c, the v0vs. [catalyst] plots (Fig. 2a and d) show a linear increase in rate upon increasing the catalyst loading in a range of 5–50 mol%. Thus, we could determine the order of catalysts based on respective double logarithmic plots (Fig. 2b and e), resulting in catalyst orders of 0.82 (for the bifunctional catenane 1c) and 0.91 (for the monofunctional macrocycle 2c). Once again, the first order dependence is also found by VTNA, which shows good overlap for p = 1 in both cases (Fig. 2c and f, for other values of p see the ESI Fig. S9/S13‡).For the macrocyclic catalyst 2c, the linear rate vs. loading behaviour and the catalyst order of p = 1 shows that this system reacts via the monomeric pathway, independent of the catalyst concentration. As for the catenane 1c, the linear rate vs. loading relationship also indicates that this system consistently follows one catalytic mechanism only, although the catalyst order (p = 1) alone does not allow us to conclude if the monomeric or dimeric catalyst pathway is dominating. However, the initial rate of the catenated catalyst 1c is significantly lower than that of the macrocyclic catalyst 2c (e.g. v0 = 0.88/1.5 × 10−7 M s−1 for 1c/2c at 0.07 mM catalyst loading), despite the fact that the catenated catalyst features two phosphoric acid units. This is in line with the DFT-calculated lower rate for a dimeric catalyst pathway. Based on these combined data, we assume that the dimeric catalysis pathway is dominating for the catenated catalyst 1c in the first, rate-determining reaction step.
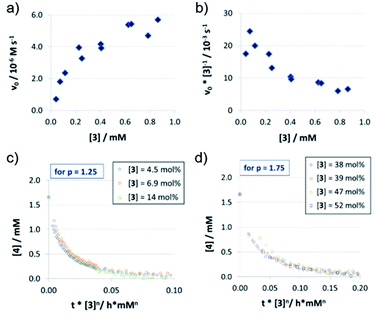
In contrast to catalysts 1c/2c, the acyclic phosphoric acid 3 shows a nonlinear behavior: in the v0vs. [3] plot (Fig. 3a); increase of catalyst loading leads to a much stronger rate increase at lower loadings than it does at higher loadings. Looking at the normalized initial rates v0/[3] (Fig. 3b), we found that the normalized rate decreases initially, before it reaches a plateau at higher loadings. In order to see if the nonlinear behavior of the rate is due to a change in the catalyst order, we performed VTNA. While we find an order of p = 1.25 at low catalyst loadings, the VTNA shows a larger order of p = 1.75 at high catalyst loadings (Fig. 3c and d, for other values of p see the ESI Fig. S17/S18‡). Thus, we believe that the nonlinear behavior of 3 can be interpreted based on competing reaction mechanisms: At low catalyst concentrations, the monomeric pathway is dominating, although the dimeric pathway still contributes. Vice versa, the dimeric pathway, which involves two phosphoric acids in the rate-determining transition state, dominates at higher catalyst loadings.
In order to relate these orders of catalysts to the overall observed reaction rates (as shown in Fig. 3a), it must be noted that the rate not only depends on the relative concentrations of the competing rate-determining intermediates (involving one or two catalyst molecules), but also on the corresponding reaction rates of the monomeric and the dimeric pathways.
Normalized reaction rates and influence of dimerization
The normalized initial rates vnorm = v0/[Cat] (Table 2; also see the ESI Fig. S20‡) are almost constant for different catalyst loadings in the case of 1c/2c (vnorm (1c) = 1.04 × 10⁻³ s−1 and vnorm (2c) = 2.06 × 10⁻³ s−1), as would be expected based on the linear rate vs. loading relationship. In the nonlinear case of catalyst 3, the maximum initial rate, equivalent to the rate constant for the purely monomeric pathway, can be obtained as the y-intercept in a linear extrapolation for low catalyst loadings (vmax = vnorm(3mono) = 22.7 × 10⁻³ s−1). In turn, the maximum rate for the dimeric pathway can be estimated from the plateau for high catalyst loadings (vnorm(3Di) = <6.29 × 10⁻³ s−1).This shows that there is a smaller difference in normalized initial rates for the macrocycle/catenane pair (vnorm(2c)/vnorm(1c) = 1.98) than for the monomeric/dimeric pathway for catalyst 3 (vnorm(3mono)/vnorm(3Di) = 3.61). The difference between the macrocyclic and acyclic catalysts is even more pronounced (vnorm(3Di)/vnorm(1c) = 6.05 and vnorm(3mono)/vnorm(2c) = 11.0), showing that the ethylene-glycol chains significantly reduce the reaction rate (as already seen for the different sized catenanes 1a/b/c).
Detailed analysis of the acyclic phosphoric acid 3
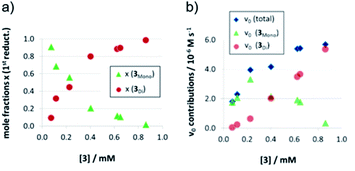
As detailed above, the nonlinear rate-behavior for the acyclic catalyst 3 can be attributed to both concentration effects and a change in the rate constant. At higher concentrations, a smaller number of active species is present (since two molecules of 3 are needed in the dimeric pathway), together with a smaller rate constant for this pathway (vnorm(3mono)/vnorm(3Di) = 3.61, vide supra). Thus, the total rate data (Fig. 3) were analyzed in order to determine the mole fractions of catalysts that act via the monomeric and the dimeric pathway, respectively (ESI‡ chapter 5). The resulting speciation plot26 (Fig. 4a) reveals that under the employed conditions (1.66 mM quinoline, 3.93 mM Hantzsch-ester, toluene solvent), the crossing point of both curves lies at ca. 0.25 mM catalyst (15 mol%). However, taking into account the lower relative rate for the dimeric pathway, the impact of catalyst-dimerization on the total rate is less significant (Fig. 4b), and only above 0.4 mM, the contribution of the dimeric pathway exceeds that of the monomeric pathway.Second reduction step: influence of aggregation on stereoselectivity
The rate analysis does not give any insight into the second, stereodetermining reduction step. Thus, we investigated the influence of the overall concentration and catalyst loading on the enantiomeric excess of the tetrahydroquinoline product 6 since this gives direct information about the second reduction.Firstly, we found that at higher overall concentrations (5.0 mM instead of 1.66 mM quinoline) but identical absolute catalyst concentrations, stereoselectivities shift towards (R)-6 (e.g. +20%/-22% ee at 25 mM catalyst, meaning 1.5/0.5 mol% loading at 1.66/5.0 mM quinoline concentration, Fig. S21b‡). However, for identical relative catalyst loadings, we find almost identical stereoselectivities (e.g. +72%/+71% ee at 50 mol%, meaning 0.83/2.5 mM catalyst concentration at 1.66/5.0 mM quinoline concentration, Fig. S21c‡). Thus, the stereoselectivity depends mostly on the substrate/catalyst ratio, which would be in line with competing monomeric and dimeric catalyst pathways: high substrate concentrations favour the formation of catalyst·dihydroquinoline·Hantzsch-ester complexes at the expense of higher-order catalyst·catalyst·dihydroquinoline·Hantzsch-ester complexes, thus shifting the reaction towards the less stereoselective, monomeric pathway.
Secondly, we checked whether there is a dependence of stereoselectivity on conversion since changing concentrations of substrates 4/7 and products 6/8 might influence the distribution between monomeric and dimeric pathways based on different association constants. However, no change in stereoselectivity was found between 15 and 95% conversion at 1 mol% catalyst loading (ESI Table S11 and Fig. S25‡).
Thirdly, we investigated the influence of catalyst loading over a broad concentration range (0.0017 mM to 0.83 mM catalyst concentration, meaning 0.1 to 50 mol% at 1.66 mM quinoline). We observed that there is a drastic change in enantioselectivity (Fig. 5): At low catalyst concentrations, the (S)-product enantiomer is favored (−30% ee), while at high catalyst concentrations the selectivity reaches up to 72% ee in favor of the (R)-isomer.
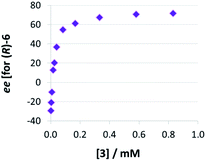 | ||
| Fig. 5 Influence of catalysts loading on enantioselectivities for catalyst 3 (given as enantiomeric excess for (R)-6). | ||
This means that the monomeric catalyst and the dimeric pathway not only have different, but actually inverted stereoselectivities. This reflects the enantioselectivities of the macrocyclic and catenated catalysts 2c/1c (−17% ee/+84% ee), which underpins their predominant reactivity via monomeric (for 2c) and dimeric (for 1c) catalytic pathways. A control experiment using 1 mol% phosphoric acid 3 plus 49 mol% benzoic acid (+10% ee, cf. +13% ee for 1 mol% 3 only) showed that the dimeric pathway requires high concentrations of phosphoric acid and the same effect cannot be easily achieved when using carboxylic acids as assisting Brønsted-acids (ESI Table S1‡).
The strong curvature of the ee vs. [3] curve suggests that the dimeric (more stereoselective) pathway has a stronger contribution in the second reduction step than in the first reduction step. This is in line with our previous DFT-results, which indicate that for the stereodetermining step, the dimeric pathway actually possesses a lower barrier than its monomeric counterpart (6.8 kcal mol−1vs. 8.5 kcal mol−1).17 To generate the corresponding speciation plot, we estimated the relative rates of the monomeric and dimeric pathway based on the DFT-data (k(3Di)/k(3mono) = 17.7, according to ΔEA = 1.7 kcal mol−1),17 since these data are not directly available experimentally. The resulting plot shows a different distribution of monomeric and dimeric pathways in comparison to the first reduction step (Fig. 6a). The mole fraction of the catalyst acting via the dimeric pathway is lower, and the crossing of both curves is observed at ca. 0.5 mM catalyst loading (30 mol%). However, the impact of the dimeric pathway on the second reduction (and thus on the stereoselectivity) is significantly enhanced by its higher relative rate (Fig. 6b). Only below a catalyst concentration of 0.012 mM (0.7 mol%), the enantioselectivity is dominated by the monomeric pathway, leading to overall preference for the (S)-product. At 0.17 mM (10 mol%) loading, the stereoselectivity already reaches 61% ee for the (R)-isomer, which is close to the highest stereoselectivity of 72% observed at 0.83 mM (50 mol%) loading. This demonstrates the relative importance of the dimeric pathway in terms of stereoselectivity, even at low catalyst loadings.
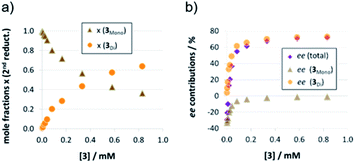 | ||
| Fig. 6 Mole fractions (a) and ee contributions (b) for the monomeric and dimeric pathway for different concentrations of catalyst 3 for the second reduction step. | ||
NMR-spectroscopic investigation of catalyst dimerization
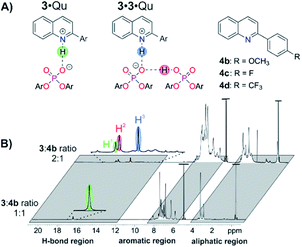
For structural NMR-investigations, quinolines 4b–d (Fig. 7A) were selected as model substrates as they possess suitable probes for 1H and 19F NMR spectroscopy. Furthermore, they modulate the basicity of the quinoline and thus allow for alteration of the hydrogen bond strength. Samples with a 1![[thin space (1/6-em)]](https://www.rsc.org/images/entities/char_2009.gif) :
:![[thin space (1/6-em)]](https://www.rsc.org/images/entities/char_2009.gif) 1 or 2
1 or 2![[thin space (1/6-em)]](https://www.rsc.org/images/entities/char_2009.gif) :
:![[thin space (1/6-em)]](https://www.rsc.org/images/entities/char_2009.gif) 1 stoichiometry of 3
1 stoichiometry of 3![[thin space (1/6-em)]](https://www.rsc.org/images/entities/char_2009.gif) :
:![[thin space (1/6-em)]](https://www.rsc.org/images/entities/char_2009.gif) 4b–d at NMR suitable concentrations (10–50 mM of 3) were employed to study the structures of the complex 3·Qu or the complex 3·3·Qu, respectively.
4b–d at NMR suitable concentrations (10–50 mM of 3) were employed to study the structures of the complex 3·Qu or the complex 3·3·Qu, respectively.
![[thin space (1/6-em)]](https://www.rsc.org/images/entities/b_char_2009.gif) :
:![[thin space (1/6-em)]](https://www.rsc.org/images/entities/b_char_2009.gif) 1 stoichiometries (3·Qu complexes).
To shed light on the structures involved in the monomeric catalysis pathway, samples of 3 and 4b–d with a 1
1 stoichiometries (3·Qu complexes).
To shed light on the structures involved in the monomeric catalysis pathway, samples of 3 and 4b–d with a 1![[thin space (1/6-em)]](https://www.rsc.org/images/entities/char_2009.gif) :
:![[thin space (1/6-em)]](https://www.rsc.org/images/entities/char_2009.gif) 1 stoichiometry were investigated. For 4b, only one hydrogen bond proton signal was detected at 16.83 ppm (Fig. 7B), which is a typical chemical shift for protons in strong hydrogen bonds and is similar to the hydrogen bond signals in CPA·imine complexes.13,29 The detection of magnetization transfer between the H-bond proton and both quinoline and CPA further corroborated the assignment of this hydrogen bond signal (ESI Fig. S30‡). The presence of the 3·4b complex was further validated by diffusion ordered spectroscopy (DOSY) measurements. Similar hydrodynamic radii for 3 (9.11 ± 0.17 Å) and 4b (7.2 ± 1.62 Å) revealed the dominant presence of the complex and are in the same order as the radii of CPA·imine complexes.15 Using different homo- and heteronuclear 2D spectra, chemical shift assignment of 3·4b (ESI Fig. S29‡) as well as in-depth NOE analysis could be accomplished (ESI Fig. S32‡). Two different conformations with a ≈180° rotated orientation of the quinolines were identified, which are in a fast exchange on the NMR time scale14,15,30 (ESI Fig. S32‡ for a more detailed description of the structures and exchange pathway).15 One of the conformations validated the previously computed structure of the 3·Qu complex.17
1 stoichiometry were investigated. For 4b, only one hydrogen bond proton signal was detected at 16.83 ppm (Fig. 7B), which is a typical chemical shift for protons in strong hydrogen bonds and is similar to the hydrogen bond signals in CPA·imine complexes.13,29 The detection of magnetization transfer between the H-bond proton and both quinoline and CPA further corroborated the assignment of this hydrogen bond signal (ESI Fig. S30‡). The presence of the 3·4b complex was further validated by diffusion ordered spectroscopy (DOSY) measurements. Similar hydrodynamic radii for 3 (9.11 ± 0.17 Å) and 4b (7.2 ± 1.62 Å) revealed the dominant presence of the complex and are in the same order as the radii of CPA·imine complexes.15 Using different homo- and heteronuclear 2D spectra, chemical shift assignment of 3·4b (ESI Fig. S29‡) as well as in-depth NOE analysis could be accomplished (ESI Fig. S32‡). Two different conformations with a ≈180° rotated orientation of the quinolines were identified, which are in a fast exchange on the NMR time scale14,15,30 (ESI Fig. S32‡ for a more detailed description of the structures and exchange pathway).15 One of the conformations validated the previously computed structure of the 3·Qu complex.17
Similar 1H spectra were obtained for quinolines 4c and 4d. Decreasing the basicity of the quinoline resulted in low field shifted proton signals (4b: 16.83 ppm, 4c: 17.42 ppm, 4d: 18.08 ppm; ESI Fig. S31‡), which corresponds to an increase in hydrogen bond strength.31 Thus, similar to CPA·imine complexes,13,29b CPA·Qu complexes are present as hydrogen bond assisted ion pairs anchored by a strong, charge assisted hydrogen bond.13,29b At 1![[thin space (1/6-em)]](https://www.rsc.org/images/entities/char_2009.gif) :
:![[thin space (1/6-em)]](https://www.rsc.org/images/entities/char_2009.gif) 1 ratios, higher aggregates, such as 3·3·Qu complexes are below the NMR-detection limit. In summary, monomeric 3·Qu complexes are analogous to the previously investigated CPA·imine systems13–15,29b,30 and are at least for the monomeric pathway a representative of catalyst·substrate complexes in CPA catalyzed transformations.
1 ratios, higher aggregates, such as 3·3·Qu complexes are below the NMR-detection limit. In summary, monomeric 3·Qu complexes are analogous to the previously investigated CPA·imine systems13–15,29b,30 and are at least for the monomeric pathway a representative of catalyst·substrate complexes in CPA catalyzed transformations.
![[thin space (1/6-em)]](https://www.rsc.org/images/entities/b_char_2009.gif) :
:![[thin space (1/6-em)]](https://www.rsc.org/images/entities/b_char_2009.gif) 1 stoichiometries (3·3·Qu complexes).
In order to populate and characterize the 3·3·Qu complex (Fig. 7A), samples of 3 to 4b–d with a 2
1 stoichiometries (3·3·Qu complexes).
In order to populate and characterize the 3·3·Qu complex (Fig. 7A), samples of 3 to 4b–d with a 2![[thin space (1/6-em)]](https://www.rsc.org/images/entities/char_2009.gif) :
:![[thin space (1/6-em)]](https://www.rsc.org/images/entities/char_2009.gif) 1 stoichiometry were investigated. For quinoline 4b, three dominant hydrogen bonded protons with a ratio of H1
1 stoichiometry were investigated. For quinoline 4b, three dominant hydrogen bonded protons with a ratio of H1![[thin space (1/6-em)]](https://www.rsc.org/images/entities/char_2009.gif) :
:![[thin space (1/6-em)]](https://www.rsc.org/images/entities/char_2009.gif) H2
H2![[thin space (1/6-em)]](https://www.rsc.org/images/entities/char_2009.gif) :
:![[thin space (1/6-em)]](https://www.rsc.org/images/entities/char_2009.gif) H3 ≈ 1
H3 ≈ 1![[thin space (1/6-em)]](https://www.rsc.org/images/entities/char_2009.gif) :
:![[thin space (1/6-em)]](https://www.rsc.org/images/entities/char_2009.gif) 2.4
2.4![[thin space (1/6-em)]](https://www.rsc.org/images/entities/char_2009.gif) :
:![[thin space (1/6-em)]](https://www.rsc.org/images/entities/char_2009.gif) 2.4 were observed (Fig. 7B).32 Proton H1 corresponds to the 3·4b complex as it has a nearly identical chemical shift as the H-bond proton in the respective sample with a 1
2.4 were observed (Fig. 7B).32 Proton H1 corresponds to the 3·4b complex as it has a nearly identical chemical shift as the H-bond proton in the respective sample with a 1![[thin space (1/6-em)]](https://www.rsc.org/images/entities/char_2009.gif) :
:![[thin space (1/6-em)]](https://www.rsc.org/images/entities/char_2009.gif) 1 stoichiometry (Δδ(1H) = 0.07 ppm). Protons H2 and H3 have similar integrals, which fits the expected hydrogen bonding situation for the 3·3·4b complex. Protons H1 and H3 showed exchange signals in the NOE spectrum (ESI Fig. S33‡). In addition, both protons show similar low field shifts with quinolines 4c and 4d, i.e. a similar modulation of the H-bond strength (ESI Fig. S31‡).
1 stoichiometry (Δδ(1H) = 0.07 ppm). Protons H2 and H3 have similar integrals, which fits the expected hydrogen bonding situation for the 3·3·4b complex. Protons H1 and H3 showed exchange signals in the NOE spectrum (ESI Fig. S33‡). In addition, both protons show similar low field shifts with quinolines 4c and 4d, i.e. a similar modulation of the H-bond strength (ESI Fig. S31‡).
Thus, proton H3 is assigned to the PO−⋯H·N+ hydrogen bond (Fig. 7B, highlighted in blue) and proton H2 to the PO−⋯H·OP hydrogen bond (Fig. 7B, highlighted in red) of the 3·3·4b complex. The significant high field shift of proton H3 compared to proton H1 reveals a weaker PO−⋯H·N+ hydrogen bond, i.e. a stronger proton transfer on the quinoline in the 3·3·4b complex compared to the 3·4b complex.31 This weakening is often found in bifurcated hydrogen bonds29a and can be rationalized by the compensation of an increasing negative partial charge on the phosphate by the additional PO−⋯H·OP hydrogen bond enabled by the second CPA.
For CPA·imine systems, a correlation between hydrogen bond strength and reactivity has been observed previously, giving lower reactivities for weaker hydrogen bonds.13 This trend is also reflected for the monomeric and dimeric reaction pathways in the investigated quinoline systems, as the dimeric reaction pathway featuring a weaker PO−⋯H·N+ hydrogen bond shows lower reaction rates than the monomeric pathway (Fig. 8).
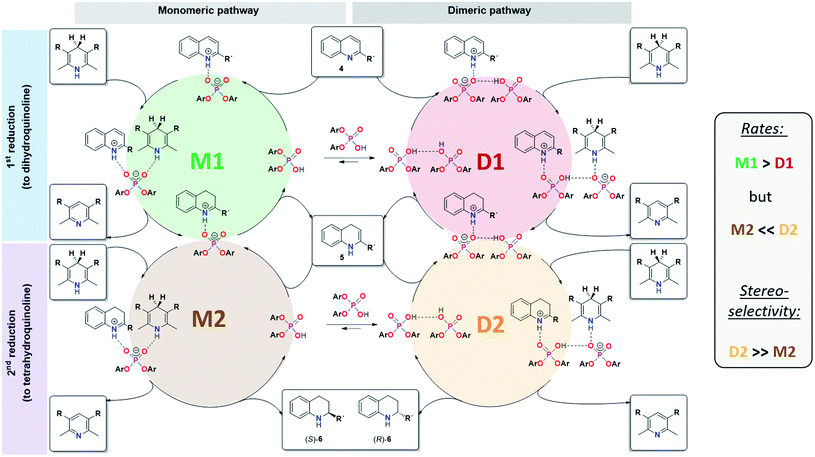 | ||
| Fig. 8 Revised mechanistic picture for the transfer-hydrogenation of quinolines catalysted by chiral phosphoric acids. | ||
Moreover, additional hydrogen bond signals were observed in the 1H spectrum at a 2![[thin space (1/6-em)]](https://www.rsc.org/images/entities/char_2009.gif) :
:![[thin space (1/6-em)]](https://www.rsc.org/images/entities/char_2009.gif) 1 stoichiometry, which are less populated and/or have severe line broadening (Fig. 7b, magnified H-bond region). EXSY signals in the NOESY spectrum revealed that these signals are in chemical exchange with the PO−⋯H·N+ or PO−⋯H·OP hydrogen bond protons of the 3·4b and 3·3·4b structures, thus suggesting the presence of different/higher aggregates of 3 and 4b. Additional detailed NMR-structural analysis of the 3·3·4b complex could not be achieved due to strong line broadening and signal overlaps (see the aromatic region in Fig. 7b).
1 stoichiometry, which are less populated and/or have severe line broadening (Fig. 7b, magnified H-bond region). EXSY signals in the NOESY spectrum revealed that these signals are in chemical exchange with the PO−⋯H·N+ or PO−⋯H·OP hydrogen bond protons of the 3·4b and 3·3·4b structures, thus suggesting the presence of different/higher aggregates of 3 and 4b. Additional detailed NMR-structural analysis of the 3·3·4b complex could not be achieved due to strong line broadening and signal overlaps (see the aromatic region in Fig. 7b).
Similar 1H spectra were obtained for quinolines 4c and 4d (ESI Fig. S31‡). Measurements at lower temperatures were not fruitful due to the poor solubility of 3 in the required freonic mixtures27 (CDCl2F and CDClF2). However, the spectra at 300 K were significantly simplified and better resolved, as the different species (free 3 and Qu, 3·Qu, 3·3·Qu and potential higher aggregates) are in fast exchange on the NMR time scale. DOSY measurements were performed at 1![[thin space (1/6-em)]](https://www.rsc.org/images/entities/char_2009.gif) :
:![[thin space (1/6-em)]](https://www.rsc.org/images/entities/char_2009.gif) 1 and 2
1 and 2![[thin space (1/6-em)]](https://www.rsc.org/images/entities/char_2009.gif) :
:![[thin space (1/6-em)]](https://www.rsc.org/images/entities/char_2009.gif) 1 stoichiometries to further confirm the postulated presence of 3·3·4b in the 2
1 stoichiometries to further confirm the postulated presence of 3·3·4b in the 2![[thin space (1/6-em)]](https://www.rsc.org/images/entities/char_2009.gif) :
:![[thin space (1/6-em)]](https://www.rsc.org/images/entities/char_2009.gif) 1 samples (ESI Table S13‡). Due to the chemical exchange of the different species, the measured diffusion coefficients and derived hydrodynamic radii are an average of the values of the different species, weighted by their respective population and lifetime.33 Similar hydrodynamic radii were derived for the quinoline and the CPA, demonstrating that also at 300 K the catalyst–quinoline complexes are the dominant species (ESI Table S14‡). When comparing the derived hydrodynamic radii for the 1
1 samples (ESI Table S13‡). Due to the chemical exchange of the different species, the measured diffusion coefficients and derived hydrodynamic radii are an average of the values of the different species, weighted by their respective population and lifetime.33 Similar hydrodynamic radii were derived for the quinoline and the CPA, demonstrating that also at 300 K the catalyst–quinoline complexes are the dominant species (ESI Table S14‡). When comparing the derived hydrodynamic radii for the 1![[thin space (1/6-em)]](https://www.rsc.org/images/entities/char_2009.gif) :
:![[thin space (1/6-em)]](https://www.rsc.org/images/entities/char_2009.gif) 1 and 2
1 and 2![[thin space (1/6-em)]](https://www.rsc.org/images/entities/char_2009.gif) :
:![[thin space (1/6-em)]](https://www.rsc.org/images/entities/char_2009.gif) 1 stoichiometries, a size increase of ≈2.2 and 3.2 Å was observed for the quinolines 4b and 4c in the 2
1 stoichiometries, a size increase of ≈2.2 and 3.2 Å was observed for the quinolines 4b and 4c in the 2![[thin space (1/6-em)]](https://www.rsc.org/images/entities/char_2009.gif) :
:![[thin space (1/6-em)]](https://www.rsc.org/images/entities/char_2009.gif) 1 samples, which is in agreement with the previously reported offset for CPA·imine complexes and their dimers (≈3 Å).15 The increased radii clearly show that higher aggregates, such as the 3·3·Qu complex, are populated when employing a 2
1 samples, which is in agreement with the previously reported offset for CPA·imine complexes and their dimers (≈3 Å).15 The increased radii clearly show that higher aggregates, such as the 3·3·Qu complex, are populated when employing a 2![[thin space (1/6-em)]](https://www.rsc.org/images/entities/char_2009.gif) :
:![[thin space (1/6-em)]](https://www.rsc.org/images/entities/char_2009.gif) 1 ratio of catalyst and quinoline.
1 ratio of catalyst and quinoline.
Overall mechanistic picture for catalyst 3
In summary, our combined kinetic, stereoselectivity, DFT and NMR analysis of the transfer-hydrogenation of quinolines with the acyclic catalyst 3 has revealed the following key findings (also see Fig. 8):- The catalytic reaction using catalyst 3 involves competing monomeric and dimeric pathways, as found by analysis of the kinetics and stereoselectivity and by DFT.
- Both the 3·Qu and 3·3·Qu complexes, which are relevant for the monomeric and dimeric pathways, were directly observed by low-temperature NMR-spectroscopy.
- For the first reduction step (4 to 5), kinetics, H-bond analysis and DFT jointly show that the reduction occurs faster for the monomeric catalyst than for the dimeric one (cycles M1 and D1, Fig. 8). For this reason, the influence of the dimeric pathway on the reaction rate is less pronounced and the dimeric pathway only dominates above 0.25 mM/15 mol% catalyst.
- For the second stereoselective reduction step, the effect of the catalyst concentration on stereoselectivity shows that the monomeric and dimeric pathways not only have different but even inversed stereoselectivities. This reflects the selectivities of the macrocyclic and catenated catalysts 1c/2c.
- As corroborated by DFT, the stereoselective second reduction (5 to 6) occurs faster for the dimeric pathway (cycles M2 and D2, Fig. 8). Thus, the impact of catalyst dimerization on the stereoselectivity is much more pronounced, with the dimeric pathway dominating even at catalyst loadings as low as 0.012 mM (0.7 mol%).
Conclusion
In conclusion, we have elucidated the importance of acid–acid interactions in phosphoric-acid based organocatalysis, using the transfer-hydrogenation of quinolines as an example. Based on a detailed mechanistic analysis of the catenated, macrocyclic and acyclic phosphoric acids 1/2/3, we established that the catalytic reactions in the case of the catenated and macrocyclic catalysts 1/2 are dominated by the dimeric and the monomeric pathway, respectively. In stark contrast, but consistent with our recent DFT-work, the acyclic phosphoric acid 3 shows a concentration-dependent change in the reaction mechanism, involving either one or two catalyst molecules in the rate- and stereodetermining intermediates. The formation of complexes involving two catalyst species and one quinoline molecule was directly proven by NMR-spectroscopy. While the influence of these intermolecular acid–acid interactions on reaction kinetics is moderate, the impact on stereoselectivity is very pronounced, even leading to opposite enantioselectivities for the monomeric (−30% ee) and dimeric catalysis pathways (+72% ee). Based on these findings, we elaborated a revised mechanism for the phosphoric acid catalyzed transfer-hydrogenation of quinolines.In comparison to other phosphoric-acid catalyzed transfer hydrogenations, it becomes clear that acid–acid interactions may well be relevant in these cases as well.4,34 While we find a significant effect on the dimeric pathway at concentrations as low as 0.012 mM, commonly employed catalyst concentrations in the literature are significantly higher (ranging from 1 mM![[thin space (1/6-em)]](https://www.rsc.org/images/entities/char_2009.gif) 4,34a,g to 2 mM,34d–f 8 mM
4,34a,g to 2 mM,34d–f 8 mM![[thin space (1/6-em)]](https://www.rsc.org/images/entities/char_2009.gif) 34c or even 10 mM
34c or even 10 mM![[thin space (1/6-em)]](https://www.rsc.org/images/entities/char_2009.gif) 34b). Certainly, the extent of intermolecular acid–acid interactions will depend strongly on the catalyst structure and has been shown to be lower for bulky phosphoric acids such as TRIP.35 In addition, other factors such as the substrate structures and the solvent may favour or disfavour the formation of higher aggregates. Nevertheless, dimeric catalysis pathways may be relevant, if not dominating, in other phosphoric-acid catalyzed transformations as well. We are currently investigating the influence of acid–acid interactions for other catalyst structures and other catalytic reactions in our laboratory, since a better understanding of such supramolecular interactions may have a major impact for the future development of phosphoric-acid catalyzed asymmetric transformations.
34b). Certainly, the extent of intermolecular acid–acid interactions will depend strongly on the catalyst structure and has been shown to be lower for bulky phosphoric acids such as TRIP.35 In addition, other factors such as the substrate structures and the solvent may favour or disfavour the formation of higher aggregates. Nevertheless, dimeric catalysis pathways may be relevant, if not dominating, in other phosphoric-acid catalyzed transformations as well. We are currently investigating the influence of acid–acid interactions for other catalyst structures and other catalytic reactions in our laboratory, since a better understanding of such supramolecular interactions may have a major impact for the future development of phosphoric-acid catalyzed asymmetric transformations.
Conflicts of interest
There are no conflicts to declare.Acknowledgements
Funding by the Fonds der Chemischen Industrie (Liebig-Fellowship to J. N.) and the German Research Foundation (DFG, NI1273/2-1) is gratefully acknowledged. J. N. would like to thank Prof. Carsten Schmuck for his support. J. G. thanks the Fonds der Chemischen Industrie for funding (Kekulé-Fellowship). J. G., H. Z., R. M. G. and S. G. thank the German Research Foundation (SPP 1807/2 Dispersion) for funding.Notes and references
- A. Berkessel and H. Gröger, Asymmetric Organocatalysis - From Biomimetic Concepts to Applications in Asymmetric Synthesis, Wiley-VCH, Weinheim, 2005 Search PubMed.
- List's proline-catalyzed aldol reactions (see ref. 3) use a 30–40 mM catalyst, while Rueping's phosphoric acid catalyzed hydrogenation of quinolines (see ref. 4a) uses a 1–5 mM catalyst.
- B. List, R. A. Lerner and C. F. Barbas, J. Am. Chem. Soc., 2000, 122, 2395–2396 CrossRef CAS.
- (a) M. Rueping, A. P. Antonchick and T. Theissmann, Angew. Chem., Int. Ed., 2006, 45, 3683–3686 CrossRef CAS PubMed; (b) M. Rueping, A. P. Antonchick and T. Theissmann, Angew. Chem., Int. Ed., 2006, 45, 6751–6755 CrossRef CAS PubMed.
- D. D. Ford, D. Lehnherr, C. R. Kennedy and E. N. Jacobsen, J. Am. Chem. Soc., 2016, 138, 7860–7863 CrossRef CAS PubMed.
- C. R. Kennedy, D. Lehnherr, N. S. Rajapaksa, D. D. Ford, Y. Park and E. N. Jacobsen, J. Am. Chem. Soc., 2016, 138, 13525–13528 CrossRef CAS PubMed.
- Y. Park, K. C. Harper, N. Kuhl, E. E. Kwan, R. Y. Liu and E. N. Jacobsen, Science, 2017, 355, 162–166 CrossRef CAS PubMed.
- (a) S. H. Oh, H. S. Rho, J. W. Lee, J. E. Lee, S. H. Youk, J. Chin and C. E. Song, Angew. Chem., Int. Ed., 2008, 47, 7872–7875 CrossRef CAS PubMed; (b) H. S. Rho, S. H. Oh, J. W. Lee, J. Y. Lee, J. Chin and C. E. Song, Chem. Commun., 2008, 1208–1210 RSC; (c) H. B. Jang, H. S. Rho, J. S. Oh, E. H. Nam, S. E. Park, H. Y. Bae and C. E. Song, Org. Biomol. Chem., 2010, 8, 3918–3922 RSC; (d) G. Tárkányi, P. Király, T. Soós and S. Varga, Chem.–Eur. J., 2012, 18, 1918–1922 CrossRef PubMed; (e) R. Salvio, L. Massaro, A. Puglisi, L. Angelini, A. Antenucci, S. Placidi, F. Sciubba, L. Galantini and M. Bella, Org. Biomol. Chem., 2018, 16, 7041–7049 RSC.
- (a) D. Parmar, E. Sugiono, S. Raja and M. Rueping, Chem. Rev., 2014, 114, 9047–9153 CrossRef CAS PubMed; (b) D. Parmar, E. Sugiono, S. Raja and M. Rueping, Chem. Rev., 2017, 117, 10608–10620 CrossRef CAS PubMed; (c) L. Schreyer, R. Properzi and B. List, Angew. Chem., Int. Ed., 2019, 58, 12761–12777 CrossRef CAS PubMed.
- N. Li, X.-H. Chen, S.-M. Zhou, S.-W. Luo, J. Song, L. Ren and L.-Z. Gong, Angew. Chem., Int. Ed., 2010, 49, 6378–6381 CrossRef CAS PubMed.
- C. Detering, P. M. Tolstoy, N. S. Golubev, G. S. Denisov and H.-H. Limbach, Dokl. Phys. Chem., 2001, 353–356 CAS.
- C. Malm, H. Kim, M. Wagner and J. Hunger, Chem.–Eur. J., 2017, 23, 10853–10860 CrossRef CAS PubMed.
- K. Rothermel, M. Melikian, J. Hioe, J. Greindl, J. Gramüller, M. Žabka, N. Sorgenfrei, T. Hausler, F. Morana and R. M. Gschwind, Chem. Sci., 2019, 114, 1929 Search PubMed.
- J. Greindl, J. Hioe, N. Sorgenfrei, F. Morana and R. M. Gschwind, J. Am. Chem. Soc., 2016, 138, 15965–15971 CrossRef CAS PubMed.
- M. Melikian, J. Gramüller, J. Hioe, J. Greindl and R. M. Gschwind, Chem. Sci., 2019, 10, 5226–5234 RSC.
- R. Mitra, M. Thiele, F. Octa-Smolin, M. C. Letzel and J. Niemeyer, Chem. Commun., 2016, 52, 5977–5980 RSC.
- R. Mitra, H. Zhu, S. Grimme and J. Niemeyer, Angew. Chem., Int. Ed., 2017, 56, 11456–11459 CrossRef CAS PubMed.
- For reviews on acid–acid interactions in organocatalysis see: (a) H. Yamamoto and K. Futatsugi, Angew. Chem., Int. Ed., 2005, 44, 1924–1942 CrossRef CAS PubMed; (b) C. Min and D. Seidel, Chem. Soc. Rev., 2017, 46, 5889–5902 RSC; (c) R. Mitra and J. Niemeyer, ChemCatChem, 2018, 10, 1221–1234 CrossRef CAS.
- C. L. Perrin, J. Chem. Educ., 2017, 94, 669–672 CrossRef CAS.
- (a) D. G. Blackmond, Angew. Chem., Int. Ed., 2005, 44, 4302–4320 CrossRef CAS PubMed; (b) J. S. Mathew, M. Klussmann, H. Iwamura, F. Valera, A. Futran, E. A. C. Emanuelsson and D. G. Blackmond, J. Org. Chem., 2006, 71, 4711–4722 CrossRef CAS PubMed.
- (a) J. Burés, Angew. Chem., Int. Ed., 2016, 55, 16084–16087 CrossRef PubMed; (b) J. Burés, Angew. Chem., Int. Ed., 2016, 55, 2028–2031 CrossRef PubMed; (c) C. D.-T. Nielsen and J. Burés, Chem. Sci., 2019, 10, 348–353 RSC.
- The translation of the concentration vs. time profiles into reaction rates adds additional inaccuracy in the data analysis. This is avoided by directly using concentration vs. time profiles in VTNA instead of using rate vs. time profiles in classical RPKA .
- Yields for 1b/2b are lower than reported earlier (14%/22%) [see ref. 16]. We attribute this to a different chromatography system that was used for this work.
- (a) J. P. Reid and J. M. Goodman, Org. Biomol. Chem., 2017, 15, 6943–6947 RSC; (b) J. P. Reid and J. M. Goodman, Chem.–Eur. J., 2017, 23, 14248–14260 CrossRef CAS PubMed; (c) J. P. Reid, L. Simón and J. M. Goodman, Acc. Chem. Res., 2016, 49, 1029–1041 CrossRef CAS PubMed; (d) L. Simón and J. M. Goodman, J. Am. Chem. Soc., 2008, 130, 8741–8747 CrossRef PubMed; (e) Y. Shibata and M. Yamanaka, J. Org. Chem., 2013, 78, 3731–3736 CrossRef CAS PubMed; (f) T. Marcelli, P. Hammar and F. Himo, Chem.–Eur. J., 2008, 14, 8562–8571 CrossRef CAS PubMed.
- J. Pastor, E. Rezabal, A. Voituriez, J.-F. Betzer, A. Marinetti and G. Frison, J. Org. Chem., 2018, 83, 2779–2787 CrossRef CAS PubMed.
- For the dimeric catalyst, the mole fraction represents the amount of catalyst that is bound in the dimeric catalyst (meaning that the molar amount of dimeric catalyst is half of the molar amount of phosphoric acid as expressed by the mole fraction).
- J. S. Siegel and F. A. L. Anet, J. Org. Chem., 1988, 53, 2629–2630 CrossRef CAS.
- (a) S. Grimme, C. Bannwarth and P. Shushkov, J. Chem. Theory Comput., 2017, 13, 1989–2009 CrossRef CAS PubMed; (b) S. Grimme and C. Bannwarth, J. Chem. Phys., 2016, 145, 054103 CrossRef PubMed; (c) P. Shushkov and S. Grimme, unpublished; (d) TURBOMOLE V7.0 2015, a development of University of Karlsruhe and Forschungszentrum Karlsruhe GmbH, 1989–2007, TURBOMOLE GmbH, since 2007; available from http://www.turbomole.com; (e) J. M. Tao, J. P. Perdew, V. N. Staroverov and G. E. Scuseria, Phys. Rev. Lett., 2003, 91, 146401 CrossRef PubMed; (f) S. Grimme, J. Antony, S. Ehrlich and H. Krieg, J. Chem. Phys., 2010, 132, 154104 CrossRef PubMed; (g) S. Grimme and L. Goerigk, J. Comput. Chem., 2011, 32, 1456–1465 CrossRef CAS PubMed; (h) A. Schäfer, H. Horn and R. Ahlrichs, J. Chem. Phys., 1992, 97, 2571 CrossRef; (i) F. Weigend, Phys. Chem. Chem. Phys., 2006, 8, 1057 RSC; (j) S. Sinnecker, A. Rajendran, A. Klamt, M. Diedenhofen and F. Neese, J. Phys. Chem. A, 2006, 110, 2235–2245 CrossRef CAS PubMed; (k) A. Klamt and G. Schüürmann, J. Chem. Soc., Perkin Trans. 1, 1993, 2, 799–805 RSC; (l) K. Eichkorn, F. Weigend, O. Treutler and R. Ahlrichs, Theor. Chem. Acc., 1997, 97, 119–124 Search PubMed; (m) P. Deglmann, K. May, F. Furche and R. Ahlrichs, Chem. Phys. Lett., 2004, 384, 103–107 CrossRef CAS; (n) S. Grimme, Chem.–Eur. J., 2012, 18, 9955–9964 CrossRef CAS PubMed; (o) F. Weigend, F. Furche and R. Ahlrichs, J. Chem. Phys., 2003, 119, 12753 CrossRef CAS; (p) F. Eckert and A. Klamt, COSMOtherm, Version C3.0, Release 14.01, COSMOlogic GmbH & Co. KG, Leverkusen, Germany, 2013 Search PubMed; (q) A. Klamt, J. Phys. Chem., 1995, 99, 2224–2235 CrossRef CAS; (r) F. Eckert and A. Klamt, AIChE J., 2002, 48, 369–385 CrossRef CAS.
- (a) T. Steiner, Angew. Chem., Int. Ed., 2002, 41, 48–76 CrossRef CAS; (b) N. Sorgenfrei, J. Hioe, J. Greindl, K. Rothermel, F. Morana, N. Lokesh and R. M. Gschwind, J. Am. Chem. Soc., 2016, 138, 16345–16354 CrossRef CAS PubMed.
- N. Lokesh, J. Hioe, J. Gramüller and R. M. Gschwind, J. Am. Chem. Soc., 2019, 141, 16398–16407 CrossRef CAS.
- S. Sharif, G. S. Denisov, M. D. Toney and H.-H. Limbach, J. Am. Chem. Soc., 2007, 129, 6313–6327 CrossRef CAS PubMed.
- The experimentally observed thermodynamic preference for the complex 3·4b (ΔGexp (3·3·4b − 3·4b) = −1.5 kJ) is qualitatively represented in the theoretical calculations, although by far less pronounced (Δgtheor (3·3·4b − 3·4b) = −12.2 kJ). Such a significant quantitative offset between experiment and computations was also found for CPA·imine systems and probably originates in dispersion interactions with the solvent (see ref. 15).
- (a) E. J. Cabrita and S. Berger, Magn. Reson. Chem., 2002, 40, 122–127 CrossRef; (b) C. T. W. Moonen, P. van Gelderen, G. W. Vuister and P. C. M. van Zijl, J. Magn. Reson., 1992, 97, 419–425 CAS.
- (a) S. Hoffmann, A. M. Seayad and B. List, Angew. Chem., Int. Ed., 2005, 44, 7424–7427 CrossRef CAS PubMed; (b) M. Rueping, E. Sugiono, C. Azap, T. Theissmann and M. Bolte, Org. Lett., 2005, 7, 3781–3783 CrossRef CAS PubMed; (c) R. I. Storer, D. E. Carrera, Y. Ni and D. W. C. MacMillan, J. Am. Chem. Soc., 2006, 128, 84–86 CrossRef CAS PubMed; (d) G. Li and J. C. Antilla, Org. Lett., 2009, 11, 1075–1078 CrossRef CAS PubMed; (e) A. Aillerie, V. L. de Talancé, A. Moncomble, T. Bousquet and L. Pélinski, Org. Lett., 2014, 16, 2982–2985 CrossRef CAS PubMed; (f) X.-F. Cai, R.-N. Guo, G.-S. Feng, B. Wu and Y.-G. Zhou, Org. Lett., 2014, 16, 2680–2683 CrossRef CAS PubMed; (g) Y. Zhang, R. Zhao, R. L.-Y. Bao and L. Shi, Eur. J. Org. Chem., 2015, 3344–3351 CrossRef CAS.
- (a) M. R. Monaco, D. Fazzi, N. Tsuji, M. Leutzsch, S. Liao, W. Thiel and B. List, J. Am. Chem. Soc., 2016, 138, 14740–14749 CrossRef CAS PubMed; (b) For a review including the crystal structure of the TRIP-dimer see: M. R. Monaco, G. Pupo and B. List, Synlett, 2016, 27, 1027–1040 CrossRef CAS.
Footnotes |
| † In memory of Prof. Carsten Schmuck. |
| ‡ Electronic supplementary information (ESI) available. See DOI: 10.1039/d0sc01026j |
| This journal is © The Royal Society of Chemistry 2020 |

