Co-assembly of a multicomponent network of nanofiber-wrapped nanotubes†
McKensie L.
Mason‡
,
Tao
Lin‡
,
Jenae J.
Linville
and
Jon R.
Parquette
 *
*
Department of Chemistry and Biochemistry, The Ohio State University, 100 W. 18th Ave. Columbus, Ohio 43210, USA. E-mail: parquette.1@osu.edu
First published on 2nd March 2022
Abstract
Strategies to create organized multicomponent nanostructures composed of discrete, self-sorted domains are important for developing materials that mimic the complexity and multifunctionality found in biological systems. These structures can be challenging to achieve due to the required balance of molecular self-recognition and supramolecular attraction needed between the components. Herein, we report a strategy to construct a two-component nanostructure via a hierarchical assembly process whereby two monomeric building blocks undergo self-sorting assembly at the molecular level followed by a supramolecular association to form a nanofiber-wrapped nanotube. The two molecules self-sorted into respective nanofiber and nanotube assemblies, yet assembly of the nanofibers in the presence of the nanotube template allowed for directed integration into a hierarchical multilayer structure via electrostatic interactions. The fiber-wrapped nanotube co-assembly was characterized using transmission electron microscopy (TEM), atomic force microscopy (AFM) and Förster resonance energy transfer (FRET) between the components. Strategies to co-assemble multicomponent nanostructures composed of discrete, spatially sorted domains with controllable higher level interactions will be critical for the development of novel, functionally competent nanomaterials.
Introduction
Despite the tremendous sophistication of materials created by the supramolecular self-assembly of a single component, these systems do not replicate, or even approach, the full functionality of natural systems.1 Many complex processes in Nature emerge from the action of complex, hierarchical structures formed by the precise interaction of multiple, discrete components.2 For example, the interaction and coordination of actin filaments, microtubules, and intermediate filaments in the cytoskeleton mediate cellular motility and wound healing.3 Although each of these components arise from the self-assembly of specific proteins, their functional properties emerge from the higher level organization of these assemblies. The functional competence of self-assembled materials also depends on the precise positioning of the components within the higher order structures. Thus, an important challenge in supramolecular materials is to create multicomponent systems by the co-assembly of discrete, spatially sorted domains of components, such as peptides, and to control their higher-level interactions.Depending on the ability of the molecules to distinguish between self and non-self, a multicomponent system either partitions into sorted, single-component nanostructures4–9 or co-assembles into structures with both types of monomers.10–14 It is important to be able to control which outcome emerges from a multicomponent assembly process because each possibility provides distinct interactions between the components, and thus offers different value prospects for specific applications.15,16 Strategies have been developed to induce self/self interactions at the monomer level to create self-sorted, multicomponent systems.17–22 However, stimulating higher order interactions between separate, self-sorted domains within a single nanostructure is exceptionally challenging to achieve because the sorted domains must engage in self/non-self interactions that were not present at the first level of monomer assembly.23–25 The use of heteroseeds to induce the co-assembly of a second monomer has been exploited to create hierarchical26,27 and blocky28–33 multicomponent nanostructures. Recently, Hamachi and co-workers developed a strategy to control the network-level self-sorting of two nanofibers by controlling the assembly of a peptide-based hydrogelator in the presence of assembled lipid-type nanofibers.17 By controlling the kinetics of seed formation using dynamic oxime formation, the co-assembly could be directed toward either an interpenetrated or parallel network of nanofibers. Herein, we describe the assembly of a multicomponent nanostructure comprised of two self-sorted, self-assembled components that interact electrostatically at the supramolecular scale, producing a nanofiber-wrapped nanotube. We have previously developed hierarchical, multilayer nanotube composites via the interaction of self-assembled nanotubes with either covalent polymers or single-walled carbon nanotubes.34–37 This approach relied on a preformed nanotube to interact strongly with the polymer, avoiding potential interactions among the components at the monomer level of assembly. In this work, we extend this strategy to the co-assembly of two noncovalent components into a nanofiber-wrapped nanotube, composed of discrete layers of self-sorted components (Scheme 1).
Results and discussion
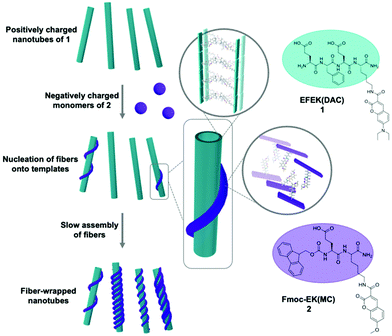
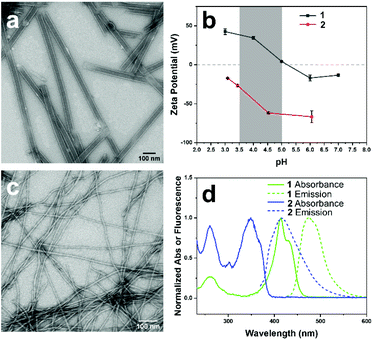
The two components of the co-assembly, EFEK(DAC), 1, and Fmoc-EK(MC), 2, were designed to be oppositely charged and sufficiently structurally distinct to ensure that self-sorting would predominate at the molecular level, and to be capable of electrostatic integration at the supramolecular level (Scheme 1). Additionally, molecules 1 and 2 also featured coumarin chromophores, 7-(N,N-diethylamino)-3-coumarin (DAC) and 7-methoxy-3-coumarin (MC), respectively. Significant spectral overlap between the emission of 2 and the absorbance of 1 allowed them to serve as a FRET pair to report the interaction of the two components at the supramolecular level (Fig. 1d).38 Based on our previous work, the first peptide, EFEK(DAC), 1, exhibited a pH dependent, self-assembly process that produced positively charged, rigid nanotubes, at pH values below 5 and negatively charged, helical nanoribbons in the pH range of 6–8 (Fig. 1a and b).39 The nanotubes exhibited diameters of 41 ± 5 nm by TEM, and AFM cross-sectional heights of 10 ± 2 nm, reflecting twice the wall dimensions (5 nm) due to compression by the AFM tip. The nanotube walls were composed of two stacked, β-sheet aggregates of 1, which positioned the hydrophobic coumarin and phenylalanine sidechains toward the interior (Scheme 1).The second component, 2, which contained a negatively charged, glutamic acid sidechain (pKa 3.22, Fig. S4†), assembled over 1–2 weeks at 1 mM into thin, flexible nanofibers with average widths of 10 ± 2 nm by TEM (Fig. 1c, and S1†). Circular dichroism (CD) and TEM analysis indicated that self-assembly was not efficient at lower concentrations than 1 mM in water (Fig. S7 and S9†). However, the assembled nanofibers at 1 mM were stable over a pH range of 2–8 (Fig. S8†) and displayed increasingly negative zeta potentials as the pH was increased (Fig. 1b). AFM cross-sectional analysis revealed a bimodal distribution of heights, reflecting the presence of both fibrils (6.4±1.3 nm) and nanofibers (14 ± 1.2 nm) (Fig. S2†). Therefore, the helically twisted nanofibers were likely formed by the intertwining of two smaller fibrils. Deconvolution of the FT-IR spectrum of 2, pre-assembled in D2O, revealed characteristic peaks at 1635 and 1653 cm−1, indicating the presence of β-sheet (75%) and α-helix/random coil (25%) structure, respectively (Fig. S6†).40 Accordingly, the fibrils were formed by the β-sheet assembly of two molecules of 2 (2.4 × 2.5 nm) (Fig. S3†), arranged in a bilayer structure, as shown in Scheme 1.
We reasoned that the comparatively smaller and flexible nanofibers of 2 could form an integrated, multicomponent architecture by helically wrapping around the larger, more rigid nanotubes of 1 (diameter: 41 ± 5 nm), provided an attractive electrostatic interaction between the components were present, which did not divert the monomer-level, self-sorting process. Comparing zeta potential values of assembled 1 and 2 at different pH values, shown in Fig. 1b, revealed an ideal pH window in the range of pH 3.5–5, in which the assemblies of 1 and 2 would possess complementary surface charges to enable an attractive electrostatic interaction. In this pH range, 1 and 2 display positively and negatively charged ionization states, respectively, and efficiently assemble.
The propensity of the monomers to undergo self-sorting and/or co-assembly depends critically on the nature of their intermolecular interactions at each level of assembly. Prior studies have indicated that the ability of a system to undergo a self-sorting process requires structurally distinct building blocks that assemble via distinct driving forces.4,5 The capability of both peptide monomers, 1 and 2, to assemble via a β-sheet mechanism, along with their electrostatic complementarity, could potentially divert the system from a self-sorting process toward a non-sorted, co-assembled structure. To probe these possibilities, we initiated the co-assembly of 1 and 2 at both the monomeric stage and as pre-assembled nanostructures, and evaluated the processes via UV-vis absorbance, circular dichroism (CD), and TEM imaging (Fig. S10 and 11†). The self-assembly of 1 into nanotubes was indicated by the emergence of a split absorbance peak corresponding to an excitonic couplet of the DAC chromophore in the range of ∼400–450 nm (λmax 414 nm);39 whereas, the nanofibers formed by 2 featured an MC absorption from ∼315–395 nm (λmax 350 nm) (Fig. S5a†). The CD spectrum of 1 at pH 3.80 displayed a positive peak at 405 nm and a negative peak at 453 nm, while 2 displayed a positive peak at 356 nm with an additional shoulder peak at about 370 nm (Fig. S5b†). To initiate the assembly process as monomers, a mixture of 1 and 2 (1![[thin space (1/6-em)]](https://www.rsc.org/images/entities/char_2009.gif) :
:![[thin space (1/6-em)]](https://www.rsc.org/images/entities/char_2009.gif) 1) was dissolved in 2,2,2-trifluoroethanol (TFE), a solvent in which neither molecule assembled, prior to lyophilization and resuspension in water at pH 4.0 to initiate co-assembly. Although the UV-vis spectrum of the mixture resembled that of the assembled states of 1 and 2, the intensity of CD signals remained low in both the MC and DAC absorption regions over two weeks, indicating the presence of a disordered aggregate (Fig. S10a and b†). Analysis of the TEM images confirmed the formation of disordered, fibrous structures which slowly transitioned to sorted, noninteracting nanofiber and nanotube structures over time (Fig. S10c and d†). Under these conditions, the mutual electrostatic interaction between the monomers hampered their respective assembly pathways into self-sorted nanostructures. To facilitate orthogonal interactions at the supramolecular level, the pre-assembled nanostructures of 1 and 2 were combined under conditions with a lower potential for monomer level interactions to impede the co-assembly process. Thus, 1 and 2 were pre-assembled into nanotubes (1 mM, aged 24 h, pH 3.8) and nanofibers (1 mM, diluted from a 5 mM sample that was aged for 2 weeks at pH 7.0), respectively, and then combined in equimolar quantities at pH 4 (Fig. S11†). After initially mixing the pre-assembled components together, and after 24 h, the UV-vis and CD spectra reflected a sorted mixture of the separately assembled forms of 1 and 2, showing no perceptible shifts or additional peaks, consistent with a mixture of self-sorted nanostructures and no detectable molecular exchange. TEM images of the mixture after 24 h showed some instances of fibers coiling around the nanotubes, which were discernible as thin, wavy fibers (5–10 nm widths) on top of the linear nanotube structures, but most nanofibers and nanotubes were not integrated. These two experiments confirmed the capability of 1 and 2 to undergo an orthogonal assembly process and the potential for higher order interactions, but neither condition provided homogeneous, nanofiber-wrapped nanotube structures.
1) was dissolved in 2,2,2-trifluoroethanol (TFE), a solvent in which neither molecule assembled, prior to lyophilization and resuspension in water at pH 4.0 to initiate co-assembly. Although the UV-vis spectrum of the mixture resembled that of the assembled states of 1 and 2, the intensity of CD signals remained low in both the MC and DAC absorption regions over two weeks, indicating the presence of a disordered aggregate (Fig. S10a and b†). Analysis of the TEM images confirmed the formation of disordered, fibrous structures which slowly transitioned to sorted, noninteracting nanofiber and nanotube structures over time (Fig. S10c and d†). Under these conditions, the mutual electrostatic interaction between the monomers hampered their respective assembly pathways into self-sorted nanostructures. To facilitate orthogonal interactions at the supramolecular level, the pre-assembled nanostructures of 1 and 2 were combined under conditions with a lower potential for monomer level interactions to impede the co-assembly process. Thus, 1 and 2 were pre-assembled into nanotubes (1 mM, aged 24 h, pH 3.8) and nanofibers (1 mM, diluted from a 5 mM sample that was aged for 2 weeks at pH 7.0), respectively, and then combined in equimolar quantities at pH 4 (Fig. S11†). After initially mixing the pre-assembled components together, and after 24 h, the UV-vis and CD spectra reflected a sorted mixture of the separately assembled forms of 1 and 2, showing no perceptible shifts or additional peaks, consistent with a mixture of self-sorted nanostructures and no detectable molecular exchange. TEM images of the mixture after 24 h showed some instances of fibers coiling around the nanotubes, which were discernible as thin, wavy fibers (5–10 nm widths) on top of the linear nanotube structures, but most nanofibers and nanotubes were not integrated. These two experiments confirmed the capability of 1 and 2 to undergo an orthogonal assembly process and the potential for higher order interactions, but neither condition provided homogeneous, nanofiber-wrapped nanotube structures.
The structure and sequence of co-assemblies can often be controlled by the addition of less reactive monomers to existing pre-assembled components, which serve as “seeds” to kinetically accelerate an assembly process.14,29,30,41–48 We reasoned that slow assembly of the monomers of 2 in the presence of fully formed nanotubes would allow the assembling nanofibers of 2 to nucleate from the pre-assembled nanotubes of 1 and elongate along the length of the structure. Due to the presence of an N-terminal Fmoc group, 2 exhibited lower aqueous solubility in the monomeric state compared to 1 at a concentration of 1 mM or higher, requiring several days to fully dissolve without vigorous stirring. It is notable that 2 exhibited significantly improved solubility in the nanofiber state. Therefore, a solid sample of monomeric 2, prepared by first dissolving in TFE to disassemble any aggregates and then drying, was added to a 1 mM solution of pre-assembled nanotubes in a 1![[thin space (1/6-em)]](https://www.rsc.org/images/entities/char_2009.gif) :
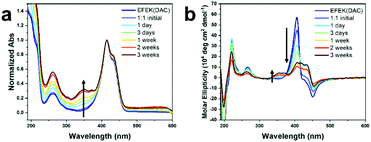
:![[thin space (1/6-em)]](https://www.rsc.org/images/entities/char_2009.gif) 1 ratio at a pH of 4.0. In this mixture, 2 was initially present as an insoluble, white solid that slowly dissolved over a timescale of 1–2 weeks without any vigorous stirring, which could be measured by an increase in the MC absorption peak at ∼350 nm (Fig. 2a) over time. Zeta potential measurements of the 1
1 ratio at a pH of 4.0. In this mixture, 2 was initially present as an insoluble, white solid that slowly dissolved over a timescale of 1–2 weeks without any vigorous stirring, which could be measured by an increase in the MC absorption peak at ∼350 nm (Fig. 2a) over time. Zeta potential measurements of the 1![[thin space (1/6-em)]](https://www.rsc.org/images/entities/char_2009.gif) :
:![[thin space (1/6-em)]](https://www.rsc.org/images/entities/char_2009.gif) 1 mixture indicated an initial value of 27.4 ± 2.84 mV, as expected for a mixture of predominantly positively charged nanotubes, at pH 3.8.39 After 3 weeks, the zeta potential of the sample converged on a value of −1.92 ± 0.376 at a pH of 4.0, which indicated a near neutralization of charge using a 1
1 mixture indicated an initial value of 27.4 ± 2.84 mV, as expected for a mixture of predominantly positively charged nanotubes, at pH 3.8.39 After 3 weeks, the zeta potential of the sample converged on a value of −1.92 ± 0.376 at a pH of 4.0, which indicated a near neutralization of charge using a 1![[thin space (1/6-em)]](https://www.rsc.org/images/entities/char_2009.gif) :
:![[thin space (1/6-em)]](https://www.rsc.org/images/entities/char_2009.gif) 1 ratio of the two components. Circular dichroic spectra taken over this timescale also showed peaks emerging from both the MC and DAC chromophores, with the MC peak increasing in intensity slightly while the DAC peaks decreased (Fig. 2b). The formation of a mixture of self-sorted assemblies was indicated by the absorption and CD spectra, which reflected an approximate superposition of the spectra of each individual component. The CD peaks for the MC and DAC chromophores emanated from the close packing interactions of the chromophores within the co-assembly.49 The slight deviation in the CD spectra from that of a perfect superposition, such as the decrease in the DAC peak at ∼405 nm, likely indicated a difference in chromophore packing due to slight unwinding of the nanotubes caused by the interaction between the two components.
1 ratio of the two components. Circular dichroic spectra taken over this timescale also showed peaks emerging from both the MC and DAC chromophores, with the MC peak increasing in intensity slightly while the DAC peaks decreased (Fig. 2b). The formation of a mixture of self-sorted assemblies was indicated by the absorption and CD spectra, which reflected an approximate superposition of the spectra of each individual component. The CD peaks for the MC and DAC chromophores emanated from the close packing interactions of the chromophores within the co-assembly.49 The slight deviation in the CD spectra from that of a perfect superposition, such as the decrease in the DAC peak at ∼405 nm, likely indicated a difference in chromophore packing due to slight unwinding of the nanotubes caused by the interaction between the two components.
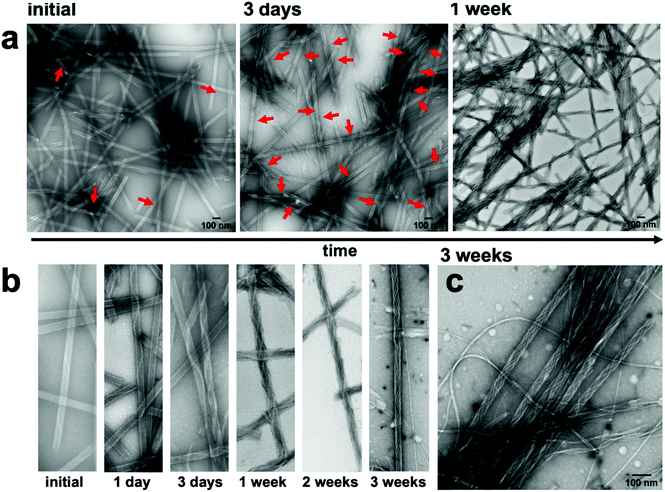
Monitoring the temporal evolution of the co-assembly process by TEM and AFM imaging revealed that immediately after mixing, only rare instances of nanofibers that were helically wrapped over the nanotubes via one or two helical turns were present (Fig. 3a, b, S15, and S20†). The nanofibers continued to elongate along the length of the nanotube, progressively increasing in coverage density over the course of one week until all nanotubes were wrapped by at least one nanofiber, and no isolated, noninteracting nanofibers were apparent. However, after 2–3 weeks, a few isolated nanofibers emerged as the surface of the nanotubes gradually became saturated with the nanofibers (Fig. 3b, c, S12 and S15†). As suggested by the near zero zeta potential at a 1![[thin space (1/6-em)]](https://www.rsc.org/images/entities/char_2009.gif) :
:![[thin space (1/6-em)]](https://www.rsc.org/images/entities/char_2009.gif) 1 (1
1 (1![[thin space (1/6-em)]](https://www.rsc.org/images/entities/char_2009.gif) :
:![[thin space (1/6-em)]](https://www.rsc.org/images/entities/char_2009.gif) 2) ratio, increasing the proportion of 1 or 2 in the co-assembly process produced more isolated, non-interacting nanotubes or nanofibers, respectively, observed in the TEM images (Fig. S21†).
2) ratio, increasing the proportion of 1 or 2 in the co-assembly process produced more isolated, non-interacting nanotubes or nanofibers, respectively, observed in the TEM images (Fig. S21†).
Although most nanotubes remained fully intact as part of the co-assembled structure, there were a few, rare occurrences in which the tubes partially unwound into helical ribbons (Fig. S13†). This was evident in regions of the nanofiber-wrapped nanotubes in which the walls of the nanotubes were not visible, suggesting a partial uncoiling of the nanotube template. In prior assembly studies of 1, the CD signal at ∼405 nm was attributed to a negative excitonic couplet centered at ∼415 nm, which emanated from π–π* transitions among adjacent, close packed coumarin rings within the nanotube.39 The negative couplet indicated that the coumarins were packed with an M-type helical twist-sense within the nanotubes. This CD signal inverted to a positive couplet upon conversion of the nanotubes into nanoribbons as the surface charge transitioned from positive to negative with a pH increase. Accordingly, the partially unwound regions of the nanotube were the likely source of the decreased amplitude of the CD signal at ∼405 nm of the co-assembly, compared with the spectra of the isolated nanotubes (Fig. 2b). The partial unwinding of the co-assembly likely emerged from the lowering of the zeta potential as the nanotubes and nanofibers combined to form a charge-neutralized species.50 It is noteworthy that the nanotube to ribbon transition for isolated nanotubes of 1 started at the isoelectric pH, where the zeta potential was zero. Thus, the interaction of the nanotubes and nanofibers could be expected to produce a similar electrostatic environment at the interface, causing a local relaxation or reorganization of the components. However, these partially unwound regions were quite rare in the images and did not increase over time. For example, TEM imaging of the co-assembly after 9 months showed fully intact nanofiber-wrapped nanotubes without any additional unwound regions (Fig. S19†).
Performing the co-assembly process at a lower concentration (0.5 mM, Fig. S14†) or at slightly elevated temperatures (30 °C for 4 h, Fig. S16†) reduced the time required to fully introduce monomeric 2 into the solution from weeks to 1 day or 4 h, respectively. As evidenced by TEM imaging, both conditions were similarly successful in producing the fiber-wrapped nanotubes within that timeframe. However, the lower concentration mixture also produced more instances of non-integrated fibers and nanotubes, and the heated sample appeared to slightly disassemble the nanotubes after 4 h, as evidenced by the appearance of small fibrous aggregates around the tubes. Conversely, combining the two components at higher concentration (1.5 mM, Fig. S18†) produced a viscous mixture, which hindered the co-assembly process, due to slower dissolution of 2 and inhomogeneous mixing of the components. Thus, fewer fiber-wrapped nanotubes were observed after 3 days, compared to the same time-point at 1 mM.
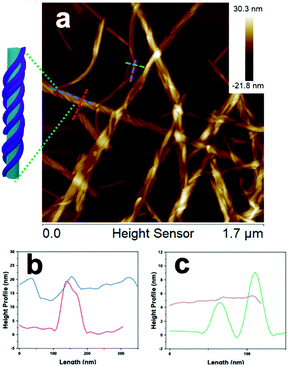
Inspection of the co-assembled sample at 1 mM, after three weeks, by AFM imaging showed a mixture of a few individual fibers and the coated nanotubes, with the nanofibers appearing as parallel lines covering the nanotubes, which indicated a single-handed, helical wrapping sense (Fig. 4a, and S15†). In contrast, the wrapping helicity appeared as a cross-hatched pattern by TEM imaging due to the transmission of electrons through the sample, whereas AFM only probed the surface of the nanofiber-wrapped nanotubes. Cross-sectional analysis of the fiber-wrapped nanotubes provided heights of 15–20 nm (Fig. 4b), indicating an increase in height of ∼5–10 nm, compared with the 10 nm AFM height of the isolated nanotubes (Fig. 4c), reflecting a compressed nanotube with a height of twice the wall thickness.39 These dimensions indicated that the nanotubes were wrapped by single fibrils of 2 (5 nm) rather than the fully formed nanofibers comprised of two intertwined fibrils (10 nm).
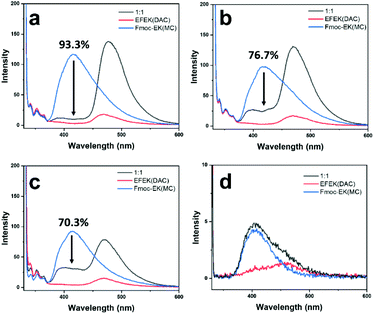
To further probe the utility of the fibers binding to the nanotube surface, energy transfer between the two components was studied. As shown in Scheme 1, molecules 1 and 2 each contained coumarin chromophores, which had sufficient spectral overlap for Förster resonance energy transfer (FRET) to occur. FRET involves energy transfer through non-radiative, dipole–dipole coupling where the donor fluorophore acts as an oscillator that exchanges energy through space with an acceptor that has a similar resonance frequency.51 Since the MC and DAC chromophores of 1 and 2 contained the prerequisite spectral overlap, close proximity of the two should lead to energy transfer. This would be evident if excitation of the MC donor led to a decrease in the intensity of the donor emission and an increase in intensity of the acceptor emission.52 Accordingly, fluorescence spectra of mixtures of 1 and 2 were compared under different conditions (Fig. 5). In each case, samples were excited at 330 nm, which predominantly excited the MC donor. Fig. 5 shows the emission of individual samples of 1 and 2 compared to mixtures of (a) fiber-wrapped nanotubes, (b) pre-assembled mixtures of fibers and nanotubes at pH 4.0, (c) pre-assembled mixtures of fibers and nanotubes at pH 6.0, and (d) mixtures of monomers at low concentrations. The mixture of monomers (d) showed no evidence of energy transfer, as the emission of the mixture equaled a summation of the emission intensities of the individual components. FRET efficiencies were calculated for each mixture and displayed in Fig. 5 (ESI, eqn (1)†), revealing the highest efficiency of 93.3% for the fiber-wrapped nanotubes, followed by 76.7% for pre-assembled mixtures at pH 4.0, and 70.3% for pre-assembled mixtures at pH 6.0. As expected from TEM imaging, the strategy of assembling the fibers onto the nanotube template provided the best conditions for bringing the chromophores into close proximity, while mixtures of pre-assembled fibers and nanotubes provided some instances of bundling and wrapping to facilitate energy transfer but to a lesser degree. Although no electrostatic interactions were expected between 1 and 2 at pH 6.0, the energy transfer observed could be due to random overlap of the nanostructures at sufficiently high concentrations, as has been observed in systems of narcissistically self-sorted fibrillar networks.52 Subsequent dilution of the pH 6.0 mixture of 1 and 2 to lower concentrations resulted in a decrease in the percentage of energy transfer (Fig. S17†). The homogeneity and control obtained by forming fiber-wrapped nanotubes offered an optimal environment for energy transfer and has potential utility as a multicomponent architecture for future optoelectronic applications and light-harvesting devices.53,54
Conclusions
In conclusion, a strategy to co-assemble a multicomponent nanostructure comprised of two discrete building blocks was described. Co-assembly proceeded via a hierarchical process initiated by self-sorted assembly at the molecular level followed by supramolecular association into a multilayered nanotube structure. Optimal co-assembly required the slow self-assembly of the nanofibers of 2 in the presence of the pre-assembled nanotube template of 1. Under these conditions, the nanofibers progressively assembled along the nanotube template over time, leading to homogeneous, nanofiber-wrapped nanotubes. Although the structures of the building blocks were sufficiently distinct to promote self-sorting, the slow assembly of 2 encouraged nucleation of the nanofibers along the nanotubes to produce an integrated, composite nanostructure with higher FRET efficiency. The use of molecules that formed into nanofibers and nanotubes was ideal because the nanotube structure acted as a rigid scaffold for the more flexible nanofibers to wrap around the outside. The ability to predictably co-assemble sorted components into multicomponent structures will be important for the development of new, functional materials with optimal performance.Conflicts of interest
There are no conflicts to declare.Acknowledgements
This material is based upon work supported by the National Science Foundation (CHE-2106924).Notes and references
- T. Aida, E. W. Meijer and S. I. Stupp, Science, 2012, 335, 813–817 CrossRef CAS PubMed
.
- E. Karsenti, Nat. Rev. Mol. Cell Biol., 2008, 9, 255–262 CrossRef CAS PubMed
.
- S. Z. Wu and M. Bezanilla, J. Cell Biol., 2018, 217, 3531–3544 CrossRef CAS PubMed
.
- J. Boekhoven, A. M. Brizard, M. C. A. Stuart, L. Florusse, G. Raffy, A. Del Guerzo and J. H. van Esch, Chem. Sci., 2016, 7, 6021–6031 RSC
.
- R. Kubota, S. Liu, H. Shigemitsu, K. Nakamura, W. Tanaka, M. Ikeda and I. Hamachi, Bioconjugate Chem., 2018, 29, 2058–2067 CrossRef CAS PubMed
.
- C. Felip-León, S. Díaz-Oltra, F. Galindo and J. F. Miravet, Chem. Mater., 2016, 28, 7964–7972 CrossRef
.
- K. L. Morris, L. Chen, J. Raeburn, O. R. Sellick, P. Cotanda, A. Paul, P. C. Griffiths, S. M. King, R. K. O'Reilly and L. C. Serpell, Nat. Commun., 2013, 4, 1480 CrossRef PubMed
.
- E. R. Draper, J. R. Lee, M. Wallace, F. Jäckel, A. J. Cowan and D. J. Adams, Chem. Sci., 2016, 7, 6499–6505 RSC
.
- D. J. Cornwell, O. J. Daubney and D. K. Smith, J. Am. Chem. Soc., 2015, 137, 15486–15492 CrossRef CAS PubMed
.
- K. V. Rao, K. Jayaramulu, T. K. Maji and S. J. George, Angew. Chem., Int. Ed., 2010, 49, 4218–4222 CrossRef CAS PubMed
.
- M. A. Khalily, G. Bakan, B. Kucukoz, A. E. Topal, A. Karatay, H. G. Yaglioglu, A. Dana and M. O. Guler, ACS Nano, 2017, 11, 6881–6892 CrossRef CAS PubMed
.
- H. Frisch, J. P. Unsleber, D. Ludeker, M. Peterlechner, G. Brunklaus, M. Waller and P. Besenius, Angew. Chem., Int. Ed., 2013, 52, 10097–10101 CrossRef CAS PubMed
.
- M. Tena-Solsona, S. Alonso-de Castro, J. F. Miravet and B. Escuder, J. Mater. Chem. B, 2014, 2, 6192–6197 RSC
.
- D. Gorl, X. Zhang, V. Stepanenko and F. Wurthner, Nat. Commun., 2015, 6, 7009 CrossRef PubMed
.
- C. Colquhoun, E. R. Draper, E. G. B. Eden, B. N. Cattoz, K. L. Morris, L. Chen, T. O. McDonald, A. E. Terry, P. C. Griffiths, L. C. Serpell and D. J. Adams, Nanoscale, 2014, 6, 13719–13725 RSC
.
- A. K. Patterson and D. K. Smith, Chem. Commun., 2020, 56, 11046–11049 RSC
.
- R. Kubota, K. Nagao, W. Tanaka, R. Matsumura, T. Aoyama, K. Urayama and I. Hamachi, Nat. Commun., 2020, 11, 4100 CrossRef CAS PubMed
.
- S. Onogi, H. Shigemitsu, T. Yoshii, T. Tanida, M. Ikeda, R. Kubota and I. Hamachi, Nat. Chem., 2016, 8, 743–752 CrossRef CAS PubMed
.
- H. Shigemitsu, T. Fujisaku, W. Tanaka, R. Kubota, S. Minami, K. Urayama and I. Hamachi, Nat. Nanotechnol., 2018, 13, 165–172 CrossRef CAS PubMed
.
- A. M. Castilla, E. R. Draper, M. C. Nolan, C. Brasnett, A. Seddon, L. L. E. Mears, N. Cowieson and D. J. Adams, Sci. Rep., 2017, 7, 8380 CrossRef PubMed
.
- K. L. Morris, L. Chen, J. Raeburn, O. R. Sellick, P. Cotanda, A. Paul, P. C. Griffiths, S. M. King, R. K. O'Reilly, L. C. Serpell and D. J. Adams, Nat. Commun., 2013, 4, 1480 CrossRef PubMed
.
- S. L. Higashi, K. M. Hirosawa, K. G. N. Suzuki, K. Matsuura and M. Ikeda, ACS Appl. Bio Mater., 2020, 3, 9082–9092 CrossRef CAS PubMed
.
- G. Moreno-Alcantar, A. Aliprandi, R. Rouquette, L. Pesce, K. Wurst, C. Perego, P. Bruggeller, G. M. Pavan and L. De Cola, Angew. Chem., Int. Ed., 2021, 60, 5407–5413 CrossRef CAS PubMed
.
- W. Ji, S. Zhang, S. Yukawa, S. Onomura, T. Sasaki, K. Miyazawa and Y. Zhang, Angew. Chem., Int. Ed., 2018, 57, 3636–3640 CrossRef CAS PubMed
.
- S. Prasanthkumar, S. Ghosh, V. C. Nair, A. Saeki, S. Seki and A. Ajayaghosh, Angew. Chem., Int. Ed., 2015, 54, 946–950 CrossRef CAS PubMed
.
- Y. Liu, C. Peng, W. Xiong, Y. Zhang, Y. Gong, Y. Che and J. Zhao, Angew. Chem., Int. Ed., 2017, 56, 11380–11384 CrossRef CAS PubMed
.
- Y. Liu, Y. Gong, Y. Guo, W. Xiong, Y. Zhang, J. Zhao, Y. Che and I. Manners, Chem. – Eur. J., 2019, 25, 13484–13490 CrossRef CAS PubMed
.
- A. Sarkar, T. Behera, R. Sasmal, R. Capelli, C. Empereur-mot, J. Mahato, S. S. Agasti, G. M. Pavan, A. Chowdhury and S. J. George, J. Am. Chem. Soc., 2020, 142, 11528–11539 CrossRef CAS PubMed
.
- A. Sarkar, R. Sasmal, C. Empereur-mot, D. Bochicchio, S. V. K. Kompella, K. Sharma, S. Dhiman, B. Sundaram, S. S. Agasti, G. M. Pavan and S. J. George, J. Am. Chem. Soc., 2020, 142, 7606–7617 CrossRef CAS PubMed
.
- W. Zhang, W. Jin, T. Fukushima, A. Saeki, S. Seki and T. Aida, Science, 2011, 334, 340–343 CrossRef CAS PubMed
.
- S. H. Jung, D. Bochicchio, G. M. Pavan, M. Takeuchi and K. Sugiyasu, J. Am. Chem. Soc., 2018, 140, 10570–10577 CrossRef CAS PubMed
.
- W. Wagner, M. Wehner, V. Stepanenko and F. Würthner, CCS Chem., 2019, 1, 598–613 CrossRef CAS
.
- A. Sarkar, R. Sasmal, A. Das, A. Venugopal, S. S. Agasti and S. J. George, Angew. Chem., Int. Ed., 2021, 60, 18209–18216 CrossRef CAS PubMed
.
- M. Ji, M. B. Dawadi, A. R. LaSalla, Y. Sun, D. A. Modarelli and J. R. Parquette, Langmuir, 2017, 33, 9129–9136 CrossRef CAS PubMed
.
- M. Ji, M. L. Mason, D. A. Modarelli and J. R. Parquette, Chem. Sci., 2019, 10, 7868–7877 RSC
.
- M. Ji, B. Daniels, A. Shieh, D. A. Modarelli and J. R. Parquette, Chem. Commun., 2017, 53, 12806–12809 RSC
.
- M. Ji and J. R. Parquette, Chem. – Eur. J., 2020, 26, 8572–8578 CrossRef CAS PubMed
.
- T. Berthelot, J. C. Talbot, G. Lain, G. Deleris and L. Latxague, J. Pept. Sci., 2005, 11, 153–160 CrossRef CAS PubMed
.
- M. L. Mason, R. F. Lalisse, T. J. Finnegan, C. M. Hadad, D. A. Modarelli and J. R. Parquette, Langmuir, 2019, 35, 12460–12468 CrossRef CAS PubMed
.
- T. Miyazawa and E. R. Blout, J. Am. Chem. Soc., 1961, 83, 712–719 CrossRef CAS
.
- X. Wang, G. Guerin, H. Wang, Y. Wang, I. Manners and M. A. Winnik, Science, 2007, 317, 644 CrossRef CAS PubMed
.
- J. R. Finnegan, D. J. Lunn, O. E. Gould, Z. M. Hudson, G. R. Whittell, M. A. Winnik and I. Manners, J. Am. Chem. Soc., 2014, 136, 13835–13844 CrossRef CAS PubMed
.
- H. Qiu, Y. Gao, V. A. Du, R. Harniman, M. A. Winnik and I. Manners, J. Am. Chem. Soc., 2015, 137, 2375–2385 CrossRef CAS PubMed
.
- D. Zhao and J. S. Moore, Org. Biomol. Chem., 2003, 1, 3471–3491 RSC
.
- S. Ogi, V. Stepanenko, K. Sugiyasu, M. Takeuchi and F. Wurthner, J. Am. Chem. Soc., 2015, 137, 3300–3307 CrossRef CAS PubMed
.
- M. Wehner and F. Wurthner, Nat. Rev. Chem., 2020, 4, 38–53 CrossRef CAS
.
- S. Ogi, V. Stepanenko, J. Thein and F. Würthner, J. Am. Chem. Soc., 2016, 138, 670–678 CrossRef CAS PubMed
.
- Y. Liu, C. Peng, W. Xiong, Y. Zhang, Y. Gong, Y. Che and J. Zhao, Angew. Chem., Int. Ed., 2017, 56, 11380–11384 CrossRef CAS PubMed
.
- G. Gottarelli, S. Lena, S. Masiero, S. Pieraccini and G. P. Spada, Chirality, 2008, 20, 471–485 CrossRef CAS PubMed
.
- J. K. Sahoo, M. A. VandenBerg, E. E. Ruiz Bello, C. D. Nazareth and M. J. Webber, Nanoscale, 2019, 11, 16534–16543 RSC
.
-
J. R. Lakowicz, in Principles of Fluorescence Spectroscopy, Springer US, 3 edn, 2006, ch. 443–475, p. 954, DOI:10.1007/978-0-387-46312-4
.
- C. Felip-León, S. Díaz-Oltra, F. Galindo and J. F. Miravet, Chem. Mater., 2016, 28, 7964–7972 CrossRef
.
- Q. Song, S. Goia, J. Yang, S. C. L. Hall, M. Staniforth, V. G. Stavros and S. Perrier, J. Am. Chem. Soc., 2021, 143, 382–389 CrossRef CAS PubMed
.
- G. Sun, W. Qian, J. Jiao, T. Han, Y. Shi, X.-Y. Hu and L. Wang, J. Mater. Chem. A, 2020, 8, 9590–9596 RSC
.
Footnotes |
| † Electronic supplementary information (ESI) available. See DOI: 10.1039/d1nr08508e |
| ‡ These authors contributed equally to this work. |
| This journal is © The Royal Society of Chemistry 2022 |

