 Open Access Article
Unveiling the particle size effect and surface reactivity of Pt/C nanoparticles for ammonia electrooxidation using in situ infrared spectroscopy†
Niloofar
Aligholizadeh K
,
Ashwini Reddy
N
 ,
Evans A.
Monyoncho
and
Elena A.
Baranova
 *
*
Department of Chemical and Biological Engineering, Centre for Catalysis Research and Innovation (CCRI), Nexus for Quantum Technologies (NexQT), University of Ottawa, 161 Louis-Pasteur, Ottawa, Ontario K1N 6N5, Canada. E-mail: elena.baranova@uottawa.ca
First published on 8th September 2023
Abstract
The ammonia electrooxidation reaction (AmER) has attracted considerable attention due to its potential for hydrogen storage and transportation, as well as its possible application in direct ammonia fuel cells. In the present work, we studied ammonia electrooxidation on carbon-supported Pt/C nanoparticles (NPs) of four average sizes of 1.3, 2.2, 2.8, and 4.2 nm. Carbon-supported Pt NPs with a 20 wt% metal loading were synthesized using the polyol method, and the control of the synthesis solution pH allowed the formation of Pt NPs of different average sizes, which was confirmed by TEM. The onset potential was more negative for the smallest nanoparticles (1.3 nm) compared to those for the larger ones. Pt/C with a mean particle size of 2.2 nm showed better stability while exhibiting comparable activity to the 1.3 nm particles. As revealed by in situ polarization modulation infrared reflection absorption spectroscopy (PM-IRRAS), the oxidation products included N–H species, azide ions, and nitrate and nitrite compounds. The N–H stretching peak was observed at about 2800 cm−1 on the Pt surface and in the bulk of the electrolyte. However, the intensity of peaks corresponding to the reaction products was different on the surface of Pt and in the bulk of the electrolyte. NO2− was mostly observed in the bulk of the electrolyte. In contrast, NO3− was present on the Pt surface. PM-IRRAS demonstrated that the particle size affected the catalytic activity of Pt/C NPs but not their selectivity. In addition, the PM-IRRAS technique allowed, for the first time, distinguishing both symmetric and asymmetric N–O bonds that were not observed previously using IR spectroscopy during ammonia electrooxidation.
Keywords: Ammonia electrooxidation; Carbon-supported Pt nanoparticle; Catalyst; PM-IRRAS; In situ infrared spectroscopy.
1 Introduction
Ammonia is a promising candidate for high hydrogen storage and utilization in transportation not only because of its high hydrogen content (121 kg H2 m−3) but also because it is the most cost-effective source of energy compared to other fuel sources like methanol and gasoline, at approximately 6.30 $ per 100 km.1 The low cost of ammonia is approximately 0.54 $ per kg H2 per unit of stored energy compared to that of hydrogen energy (14.95 $ per kg H2),2,3 and in addition, it is a CO2-free energy system. Ammonia can be liquefied under moderate pressures and temperatures of around 8–10 bar and 20 °C and stored as a liquid for further applications and easy transport.4 Furthermore, ammonia can be used as a suitable fuel source in direct ammonia fuel cells (DAFCs).5–8The electrochemical oxidation of ammonia has been investigated on several mono- and bimetallic electrocatalysts to improve the reaction kinetics and find active catalysts such as Pt, Pt–Ir, Pt–Ir–Ni, etc.9–18 As compared to some active catalysts, platinum has been reported to be the most effective catalyst with reversibility against surface poisoning in the ammonia electrooxidation reaction (AmER).19,20
Several studies have been conducted to investigate the use of transition metals (Pt, Pd, Rh, Ru, Au, Ag, Cu, Ni, and Ir) as ammonia oxidation electrocatalysts.8–17,21–25 They reported that Pt and Ir catalysts with the lowest binding energy towards adsorbed atomic nitrogen (Nads) have increased ammonia oxidation reaction activity.12,13 Pt is the most investigated and promising metal catalyst for the ammonia oxidation reaction, capable of generating high current densities at lower overpotentials.26,27
The mechanism of ammonia electrooxidation on Pt in alkaline solution proposed by Oswin–Salomon and Gerischer–Mauerer consists of several hydrogenation steps.28–30 After being adsorbed on the catalyst surface, ammonia molecules undergo dehydrogenation into various N–H species and finally to N2. The last dehydrogenation step of NH produces Nads atoms, strongly binding intermediates that poison Pt active surface sites.28
Ammonia electrooxidation on the Pt surface is a highly structure-sensitive reaction that also depends on the size and the surface and bulk structure of nanocatalysts.28,31 A change in the nanoparticle size could lead to changes in the Pt crystallographic orientation, and also to changes in the oxidation state, which results in the alteration of the Pt electronic structure.26,32 It has been reported that the most active crystallite plane of Pt for ammonia electrooxidation is (100), followed by (111) and (110).26,31,33 Several studies have been conducted to investigate this facet effect.31,33,34 The higher Pt (100) activity is linked to its ability to stabilize adsorbed active NH2 intermediates and not Nads, compared to the fcc Pt (111) surface.35,36 Furthermore, the adsorption energy of the poisonous product Nads is lower on Pt (100) compared to that on the Pt (111) facets.19,37 As a result, cubic Pt nanoparticles with a high number of Pt (100) facets have a substantially higher peak current density for the AmER than those with more Pt (111) surfaces.27,38
Studies on single Pt crystal electrodes, as well as electrochemically prepared (100) surfaces, revealed that the particle size of nanostructured catalysts could have a significant effect on the electrocatalytic performance of Pt, as the distribution and number of crystal planes depend on the particle size and the catalyst fabrication method.39,40
In situ infrared (IR) spectroscopy and Raman spectroscopy are powerful techniques for studying reaction mechanisms and product analysis.41,42 Although the IR spectroscopy technique is efficient for analyzing solid–liquid interfaces, several obstacles, like strong IR absorption by aqueous electrolytes, may conceal the reaction products and intermediates.43 In an early work, ammonia electrooxidation was studied on Pt electrocatalysts using the infrared reflection absorption spectroscopy (IRRAS) technique.44 It is well-known that adsorbed N–H species are major intermediates of the AmER;30 however, they could not be observed using infrared spectroscopy due to the huge peak overlaps in the water and nitrogen wavenumber regions. In a recent study using attenuated total reflection infrared reflection absorption spectroscopy (ATR-IRRAS), N2H4 was observed during ammonia electrooxidation as an intermediate formed on Pt.42,45 An N–O peak was also observed at relatively higher anodic potentials. Furthermore, surface-enhanced Raman spectroscopy (SERS) was used to detect N-containing products on the surface of platinum group metals (PGMs).46 Adsorbed azide anions were found to form on a Pt catalyst due to interaction between adsorbed ammonia molecules and generated N2H4.46
Polarization modulation infrared reflection absorption spectroscopy (PM-IRRAS) is a powerful technique to investigate solid/liquid and solid/gas interfaces and, in recent years, has attracted significant attention in electrochemistry and electrocatalysis.43,48 This technique can simultaneously distinguish reaction species directly on the electrode surface and in the electrolyte in immediate contact with the electrode surface while suppressing signals from water.49 In recent years, we have used in situ PM-IRRAS to study the electrooxidation of ethanol and glycerol on various Pd- and Ni-based nanoparticles.50,53–55
In the present study, we applied PM-IRRAS to study the AmER in alkaline media on size-defined Pt/C nanoparticles to elucidate the surface reactivity, oxidation products and catalyst selectivity. To this end, we fabricated carbon-supported Pt nanoparticles of four average sizes using the polyol synthesis method. To investigate the particle size effect and product distribution, we applied cyclic voltammetry, chronoamperometry, and the in situ PM-IRRAS technique. First, the detailed electrochemical characterization of Pt/C for the AmER is shown, and then optimization of the PM-IRRAS experimental approach for ammonia electrooxidation in 1 M KOH is presented, followed by in situ reaction product analysis under various anodic polarizations.
2 Results and discussion
Fig. 1 shows the TEM images and size distribution histograms of Pt/C NPs synthesized at various pH values. The resulting nanoparticles are spherical in shape, and show a narrow size distribution and no agglomeration. The average particle size ranges between 1.3 and 4.2 nm. The TEM results confirm that the size of the Pt nanoparticle catalysts was adjusted by changing the NaOH content from 0.08 to 0.25 M, corresponding to a pH increase from 5 to 8.2.46,47Table 1 summarizes the NaOH concentrations, as well as the initial and final pH values of the synthesis solution along with the average particle size.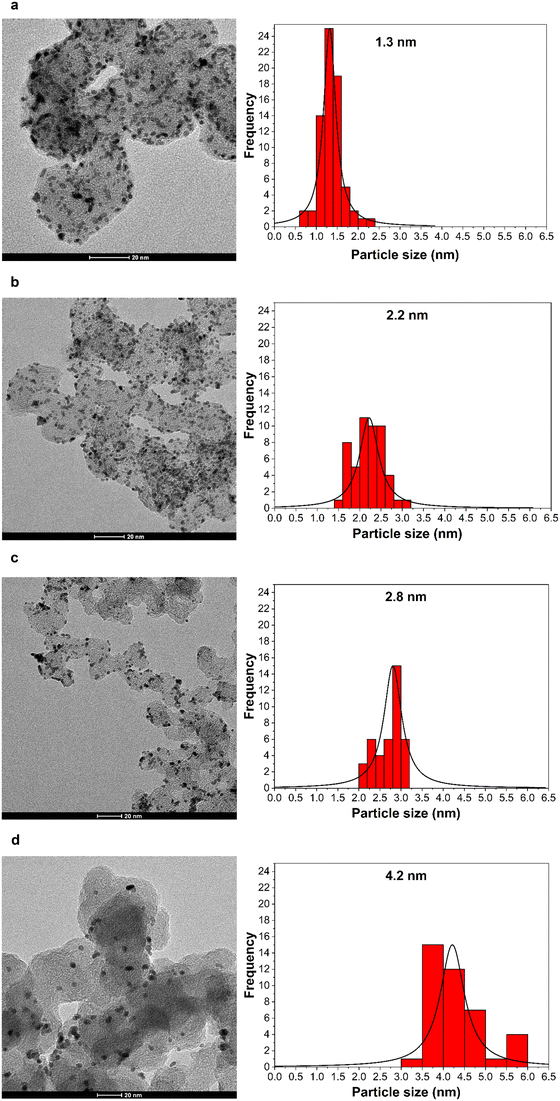 | ||
| Fig. 1 (Left) TEM images and (right) corresponding size distribution histograms of carbon-supported Pt nanoparticles of various mean particle sizes: – (a) 1.3 nm, (b) 2.2 nm, (c) 2.8 nm, (d) 4.2 nm. | ||
2.1 Electrooxidation of ammonia
Fig. 2 shows the cyclic voltammograms of Pt/C nanoparticles in 1 M KOH in the presence and absence of 0.5 M NH4OH in the potential range of −0.9 to 0.0 V vs. Hg/HgO at 20 mV s−1. The current was normalized by the electrochemically active surface area (ECSA) obtained from the integration of the surface under the CV in the hydrogen adsorption/desorption region in 1 M KOH, Fig. S1.† The ECSA values (Table 1) do not show a clear trend with the particle size increase. This could be attributed to the change in the surface oxidation state of Pt NPs with increasing size. Earlier,47 the XPS analysis of Pt/C NPs synthesized in ethylene glycol showed that the smallest (∼1 nm) Pt/C NPs were mostly metallic, whereas for 2.2 nm NPs and larger ones, the existence of platinum atoms in the higher oxidation states of 2+ and 4+ was detected, indicating that the Pt surface consists of metal and oxides. This in turn will affect the active surface area and NP activity.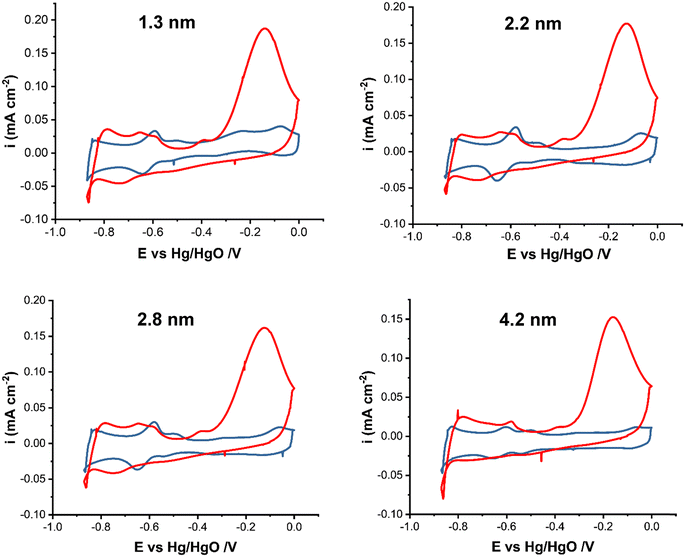 | ||
| Fig. 2 Cyclic voltammograms of Pt/C catalysts of various average sizes as indicated in the figure in 1 M KOH (blue line) and in 1 M KOH + 0.5 M NH4OH (red line) at 20 mV s−1. | ||
The CV scans in Fig. 2 are in agreement with studies on ammonia electrooxidation on carbon-supported Pt.51–53 In 1 M KOH, the CVs show a PtOx formation peak at ∼−0.1 V and the corresponding reduction peak between −0.1 and −0.35 V depending on the particle size. Hydrogen adsorption starts past −0.4 V in the cathodic scan. In the presence of ammonia, the large oxidation peak (red line) at ∼−0.2 V corresponds to ammonia electrooxidation on Pt. The current decrease past −0.2 V is due to the formation of inactive PtOx and surface poisoning by reaction intermediates, e.g., Nads. In ammonia containing solution, hydrogen evolution occurs at around −0.8 V compared to ∼−0.85 V in 1 M KOH. The presence of ammonia also affects the hydrogen adsorption/desorption region, which shows a shift to higher potentials of −0.35 V compared to it being in the −0.4 V to −0.83 V region in the absence of ammonia. This shift indicates that ammonium cations affect the binding energy of hydrogen, leading to a change in the corresponding potential. The observed small anodic peak prior to the ammonia oxidation peak has been attributed to the arrangement of ammonia molecules on the surface of Pt nanoparticles.23,54 The current density reaches 0.18 mA cm−2 for Pt/C with a 1.3 nm mean particle size as the highest and 0.15 mA cm−2 for 4.2 nm Pt/C as the lowest (Fig. S2 in the ESI†).
Fig. 3a shows a comparison of the forward scan of CVs in ammonia-containing solution. The activity decreases as the particle size increases, demonstrating the relationship between the particle size and the catalytic activity of Pt nanoparticles. Smaller Pt particles generally have a larger surface area, resulting in a higher catalytic output. In the literature, some disagreement exists regarding the Pt particle size effect on electrochemical reactions, where, in addition to the size, the synthesis procedure and as a result the surface and bulk composition, and in some cases the particle shape, influence the reactivity. For instance, it has been reported that decreasing the catalyst particle size below 3 nm or increasing the specific surface area reduces the Pt catalytic activity.55,56
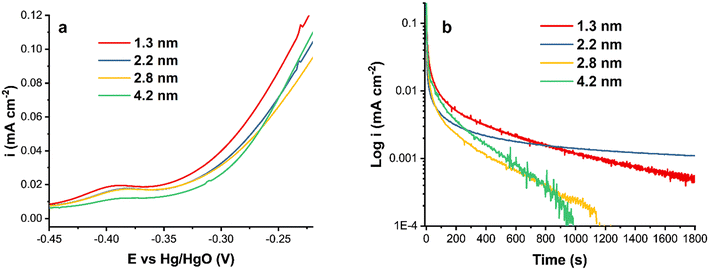 | ||
| Fig. 3 (a) A comparison of the forward CV scans of Pt/C catalysts at ν = 20 mV s−1 and (b) chronoamperograms of Pt/C catalysts at −0.3 V in 1 M KOH + 0.5 M NH4OH. | ||
The current density normalized by the ECSA is lower for the 4.2 nm Pt/C catalyst compared to that of the smaller nanoparticles. This is due to the surface structural differences and the amount of surface PtOx, also observed in the hydrogen region (Fig. 2). The onset potential is more negative for the smallest Pt nanoparticles and nearly equal for the two intermediate sizes.
Fig. 3b shows the chronoamperometric measurements of Pt/C catalysts of various average sizes at −0.3 V. As can be observed, the two largest particles, 2.8 and 4.2 nm, were rapidly deactivated without reaching steady state. The steep decline could be attributable to the formation of passive atomic Nads intermediates that block Pt active sites.23,57 The surface poisoning by Nads could also be responsible for the observed current density noise for Pt/C of 1.3, 2.8 and 4.2 nm sizes (Fig. 3b). The noise decreases as the stability of Pt/C nanoparticles increases.
2.2 In situ PM-IRRAS measurements
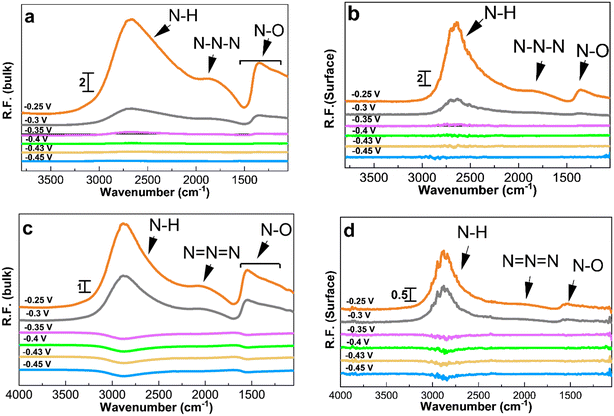
PM-IRRAS enables distinguishing between oxidation species adsorbed on the catalyst surface and those released into the electrolyte. Chronoamperometry experiments were coupled with PM-IRRAS in 1 M KOH to collect reference spectra before switching the electrolyte to 1 M KOH + 0.5 M NH4OH.Fig. 4 depicts the spectra collected during ammonia electrooxidation for the two Pt/C catalysts with the highest activity and the best short-term stability, i.e., 1.3 and 2.2 nm. The applied potentials ranged from the double layer region at ∼−0.5 V to the ammonia oxidation potential at −0.25 V vs. Hg/HgO. Depending on the potential, different peaks with varying intensities were observed (Fig. 4), and the corresponding band assignments are listed in Table 2. After applying specific potentials, four distinct bands emerged at 1290–1360, 1475–1550, 2000–2120, and 2700–3000 cm−1.
| Wavenumber (cm−1) | Bond | Assignment |
|---|---|---|
| 3000–2700 | N–H | N2H4, N2H2, NH2, NH, … |
| 2120–2000 | N![[double bond, length as m-dash]](https://www.rsc.org/images/entities/char_e001.gif) N N![[double bond, length as m-dash]](https://www.rsc.org/images/entities/char_e001.gif) N N |
Azide ion |
| 1550–1475 | N–O | NO3− |
| 1360–1290 | N–O | NO2− |
The peak at 3000–2700 cm−1 is related to N–H species and starts appearing at around −0.35 V for 1.3 nm and at a more positive potential of −0.3 V for 2.2 nm Pt/C, which is in agreement with the onset potentials in the CVs, Fig. 3a. The intensity of this peak increases as the potential becomes more positive. The peak confirms the AmER on the Pt electrode and the peak intensity reaches its maximum at around −0.25 V. The differences in the intensity of the peaks in the bulk and on the surface shows that N–H compounds desorb from the surface and diffuse into the bulk of the solution.
The peak at around 2010 cm−1 observed during ammonia electrooxidation on the Pt surface and in the bulk of the electrolyte corresponds to azide ions, N3−, according to surface-enhanced Raman spectroscopy.28,54 The interaction of hydrazine (N2H4) and ammonia molecules produces azide ions. The asymmetric and symmetric N–O bonds in the bulk of the electrolyte correspond to nitrate and nitrite compounds with peaks at 1550–1475 cm−1 and 1360–1290 cm−1, respectively.58,59 As seen, the symmetric nitrite components are not visible on the 1.3 and 2.2 nm Pt surfaces, which could be due to the immediate desorption of these species from the surface after formation. Overall, all IR peaks have a higher intensity and appear earlier for the smallest 1.3 nm Pt/C catalyst, confirming its higher reactivity and earlier onset potential observed in Fig. 3.
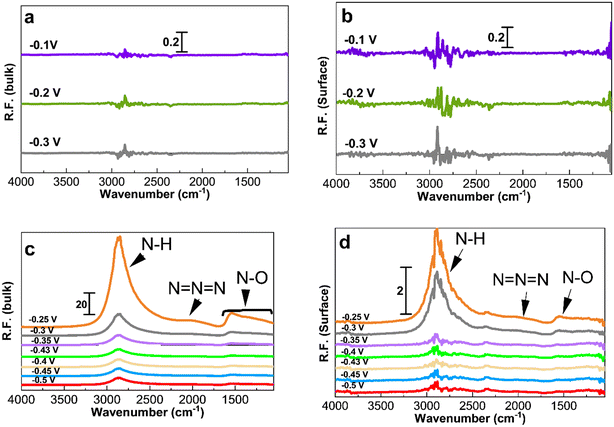
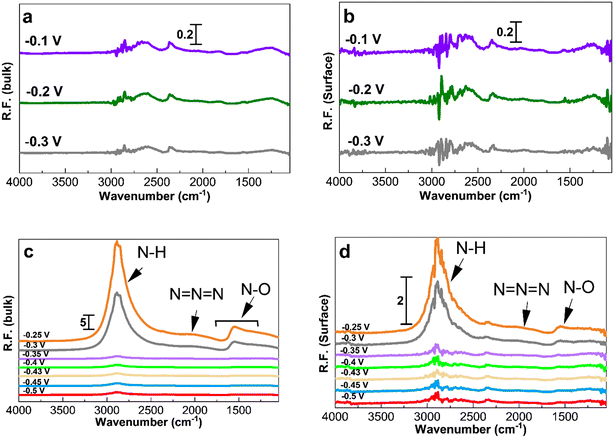
Fig. 5 and 6 show the collected spectra on the Pt/C catalysts of 1.3 nm and 2.2 nm, respectively. The left hand side corresponds to spectra in the electrolyte and the right hand side spectra are recorded on the Pt surface. In these experiments, the reference spectra to process the data are acquired in 1 M KOH at −0.4 V in order to see the effect of the ammonia electrolyte. Fig. 5a and b and 6a and b show the PM-IRRAS spectra at −0.3, −0.2, and −0.1 V in 1 M KOH in the absence of ammonia, and as expected, no oxidation species are observed.
Fig. 5c and 6c show the existence of ammonia peaks at 2900 cm−1 at the start of the experiment at −0.5 V, reflecting the effect of the ammonia electrolyte on both bulk and surface spectra. In comparison to those in Fig. 4, the peaks are more intense because the effect of the electrolyte has not been omitted. As can be seen, N–O species centered at 1500 cm−1 are mostly present in the electrolyte and were observed only at high anodic potentials on the surface. It also seems that there is less N–O formation for larger NPs and only at high potentials based on the peak intensity.
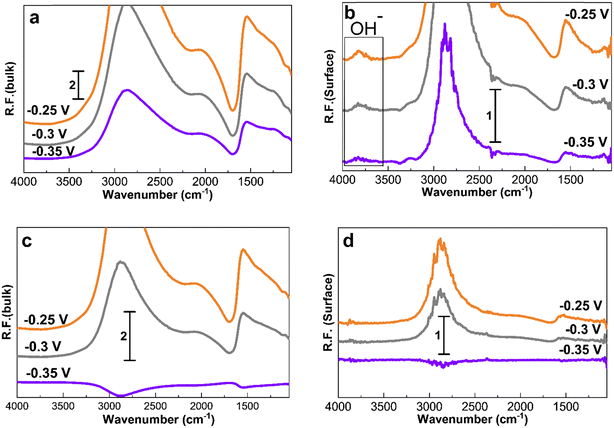
Fig. 7 shows the spectra obtained at −0.35, −0.3, and −0.25 V for 30 min to study the accumulation of products and intermediates. Like in Fig. 4 to 6, the larger Pt/C NPs of 2.2 nm do not show N–H and N–O peaks at −0.35 V in the electrolyte (Fig. 7c) or on the surface (Fig. 7d), indicating the absence of ammonia electrooxidation at this potential. The smallest sized catalyst shows the highest peak intensities at a given potential. In addition, the formation of OH− at 3600 cm−1 on the surface of 1.3 nm Pt/C NPs was clearly observed. This peak was only seen on the surface but not in the electrolyte nor on the larger NPs. The coverage of the Pt surface by OH− could be a potential reason for the short-term stability difference between 1.3 and 2.2 nm nanoparticles. It was reported that OH− ions could be strongly attached to the surface of Pt catalysts and cover the active sites competing with ammonia molecules.24,60 It is therefore assumed that oxygenated ions also play a negative role in blocking active surface sites, in addition to the Nads atoms.
3 Conclusions
The influence of the Pt nanoparticle size on the ammonia electrooxidation reaction was investigated. PM-IRRAS was combined with electrochemical measurements to explore ammonia electrooxidation on carbon-supported Pt/C NPs in alkaline environments. The study demonstrated a clear relationship between the nanocatalyst size and catalytic activity. The smallest sized Pt particles, 1.3 nm, displayed better activity and a lower onset potential, while the 2.2 nm Pt particles showed better durability and reasonable activity. Various oxidation potentials were applied to detect the oxidation species using in situ PM-IRRAS. N–H species, azide ions, and nitrate and nitrite compounds have been identified as the main reaction products. At higher anodic potentials of −0.3 V and −0.25 V, when Pt oxidation takes place, the formation of N–O species was also observed. NO2− was mostly observed on the catalyst surface. In contrast, NO3− was mostly identified in the bulk indicating its fast desorption. PM-IRRAS allowed the detection of both symmetric and asymmetric N–O bonds, as well as N–O linked to surface NO2−, which was not possible with the ATR-FTIR technique.In addition, OH− species were detected on the surface of 1.3 nm Pt in the oxidation potential region of −0.35 to −0.25 which could not be seen in the spectra corresponding to the electrolyte side. It has been reported that OH− can become strongly attached to the surface of Pt catalysts and cover the active sites. This could be one of the reasons why 1.3 nm Pt is less stable than 2.2 nm Pt.
4 Experimental
4.1 Synthesis of carbon-supported Pt
Carbon-supported Pt catalysts were synthesized using a polyol synthesis method described previously.61,62 First, 104 mg of PtCl4 (Alfa Aesar, 99.9% metals basis) was dissolved in 12 mL of ethylene glycol (Fisher Scientific). Four reaction mixtures of PtCl4 and glycerol were prepared containing 0.25, 0.15, 0.1, and 0.08 M NaOH (ACP Chemicals Inc.). After 30 minutes of refluxing at 160 °C, the mixtures formed colloidal solutions of Pt nanoparticles. The colloids were then mixed with a corresponding amount of carbon (Vulcan XC-72, Cabot) support. The mixture was stirred for 24 hours to achieve high dispersion of nanocatalysts with a metal loading of 20 wt%. The supported catalysts were centrifuged and thoroughly washed in ultra-pure deionized water (18 Ω cm) and then dried in a freeze dryer (LABCONCO, 4.5 L cascade, benchtop freeze dry).4.2 Characterization of the nanoparticles
The size and morphology of Pt/C catalysts were examined using a JEM-2100F FETEM (JEOL) transmission electron microscope (TEM). The particle size distribution was determined using ImageJ software.All electrochemical and spectro-electrochemical measurements were carried out in an in-house built spectro-electrochemical cell made of Teflon, as previously reported.50,63,64 The cell was fitted with a calcium fluoride (CaF2) hemicylinder IR window (RJ Spectroscopy Co.). The working electrode consisted of a glassy carbon (GC) disk (0.197 cm2 surface area) integrated in a Teflon rod equipped with a micrometer to adjust the distance between the electrode and the IR window. A Pt wire twisted around the working electrode was used as a counter electrode and Hg/HgO (Koslow Scientific) served as a reference electrode. 1 M KOH and 1 M KOH + 0.5 M NH4OH aqueous solutions were prepared by using KOH (85% KOH basis, Sigma-Aldrich) and ammonium hydroxide, NH4OH, 14.8 N (Fisher Scientific). All potentials were measured and reported versus the Hg/HgO reference electrode, unless otherwise stated.
4.3 In situ PM-IRRAS measurements
Polarization modulation infrared reflection absorption spectroscopy (PM-IRRAS) and electrochemical tests were carried out by integrating a Fourier transform infrared spectrometer (Bruker Tensor 37) equipped with an additional polarization modulation accessory (PMA 50 XL) located in a chamber and the spectro-electrochemical cell.45,49,63,65 Cyclic voltammetry (CV) and chronoamperometry (CA) were carried out using a PARSTAT 2263 (Princeton Applied Research) potentiostat. For CV measurements, the potential was scanned from −0.9 to 0 V vs. Hg/HgO at a scan rate of 20 mV s−1 for 10 cycles. The 10th cycle is reported unless otherwise stated. For CA measurements, the potential was fixed at −0.3 V for 30 minutes. A catalyst ink was prepared by adding 6 mg of electrocatalyst powder to 1 mL of deionized water, 100 μL of 5 wt% Nafion® and 100 μL of isopropanol. The ink was sonicated in an ultrasonic bath for 10 minutes. After that, aliquots of 2.5 μL of the ink were deposited onto the GC surface and dried at 60 °C for 10 minutes. The electrolyte was degassed using nitrogen gas (99.999%, Linde). Prior to the in situ spectroscopy analysis, a mercury cadmium telluride light detector (LN-MCT Narrow PMA50, Infrared Associates, Inc., Stuart, FL) was cooled down with liquid nitrogen to avoid potential damage due to an increase in temperature by infrared beams. Pushing the working electrode toward the calcium fluoride window, an estimated average thickness of 10 μm of electrolyte was achieved.50 All spectra were collected at a spectral resolution of 8 cm−1 by acquiring 256 scans. The collected spectra were acquired under chronoamperometry (CA) while the potential was kept constant at different ammonia oxidation states for 5 minutes or 30 min. The infrared beam was adapted to hit the GC surface at 68° which is an optimum angle.64 The surface and bulk reflectivity factors (R.F.s) were calculated using eqn (1) and (2), which are based on a previously introduced methodology:64 | (1) |
 | (2) |
Conflicts of interest
The authors declare no conflict of interest.Acknowledgements
This work was supported by the Natural Sciences and Engineering Research Council of Canada (NSERC) Discovery Grant (RGPIN05494).References
- I. Dincer, D. Erdermir, M. Iberia, H. Karasu and G. Vezina, Ammonia energy technologies, Springer Nature Switzerland, 2022 Search PubMed.
- A. M. Elbaz, S. Wang, T. F. Guiberti and W. L. Roberts, Review on the recent advances on ammonia combustion from the fundamentals to the applications, Fuel Commun., 2022, 10, 100053 CrossRef.
- F. B. Juangsa, A. R. Irhamna and M. Aziz, Production of ammonia as potential hydrogen carrier: Review on thermochemical and electrochemical processes, Int. J. Hydrogen Energy, 2021, 46, 14455–14477 CrossRef CAS.
- D. R. MacFarlane, P. V. Cherepanov, J. Choi, B. H. R. Suryanto, R. Y. Hodgetts, J. M. Bakker, F. M. Ferrero Vallana and A. N. Simonov, A roadmap to the ammonia economy, Joule, 2020, 4, 1186–1205 CrossRef CAS.
- G. Jeerh, M. Zhang and S. Tao, Recent progress in ammonia fuel cells and their potential applications, J. Mater. Chem. A, 2021, 9, 727–752 RSC.
- S. Farhad and F. Hamdullahpur, Conceptual design of a novel ammonia-fuelled portable solid oxide fuel cell system, J. Power Sources, 2010, 195, 3084–3090 CrossRef CAS.
- T. Wang, Y. Zhao, B. P. Setzler, R. Abbasi, S. Gottesfeld and Y. Yan, A high-performance 75 W direct ammonia fuel cell stack, Cell Rep. Phys. Sci., 2022, 3, 100829 CrossRef CAS.
- J. C. M. Silva, S. Ntais, É. Teixeira-Neto, E. V. Spinacé, X. Cui, A. O. Neto and E. A. Baranova, Evaluation of carbon supported platinum–ruthenium nanoparticles for ammonia electro-oxidation: Combined fuel cell and electrochemical approach, Int. J. Hydrogen Energy, 2017, 42, 193–201 CrossRef CAS.
- H. Zhang, H. Wang, L. Zhou, Q. Li, X. Yang, Y. Wang, M. Zhang and Z. Wu, Efficient and highly selective direct electrochemical oxidation of ammonia to dinitrogen facilitated by NiCu diatomic site catalysts, Appl. Catal., B, 2023, 328, 122544 CrossRef CAS.
- N. N. Fomena, S. Garbarino, J. Gaudet, L. Roué and D. Guay, Nanostructured Pt surfaces with Ir submonolayers for enhanced NH3 electro-oxidation, ChemElectroChem, 2017, 4, 1327–1333 CrossRef CAS.
- L. Song, Z. Liang, Z. Ma, Y. Zhang, J. Chen, R. R. Adzic and J. X. Wang, Temperature-dependent kinetics and reaction mechanism of ammonia oxidation on Pt, Ir, and PtIr alloy catalysts, J. Electrochem. Soc., 2018, 165, J3095–J3100 CrossRef CAS.
- N. Sacré, M. Duca, S. Garbarino, R. Imbeault, A. Wang, A. H. Youssef, J. Galipaud, G. Hufnage, A. Ruediger, L. Roué and D. Guay, Tuning Pt-Ir interactions for NH3 electrocatalysis, ACS Catal., 2018, 8, 2508–2518 CrossRef.
- Y. Li, X. Li, H. S. Pillai, J. Lattimer, N. Mohd Adli, S. Karakalos, M. Chen, L. Guo, H. Xu, J. Yang, D. Su, H. Xin and G. Wu, Ternary PtIrNi catalysts for efficient electrochemical ammonia oxidation, ACS Catal., 2020, 10, 3945–3957 CrossRef CAS.
- S. S. P. Rahardjo and Y. J. Shih, Electrochemical characteristics of silver/nickel oxide (Ag/Ni) for direct ammonia oxidation and nitrogen selectivity in paired electrode system, Chem. Eng. J., 2023, 452, 139370 CrossRef CAS.
- Y. J. Shih and C. H. Hsu, Kinetics and highly selective N2 conversion of direct electrochemical ammonia oxidation in an undivided cell using NiCo oxide nanoparticle as the anode and metallic Cu/Ni foam as the cathode, Chem. Eng. J., 2021, 409, 128024 CrossRef CAS.
- M. D. Zott, P. Garrido-Barros and J. C. Peters, Electrocatalytic ammonia oxidation mediated by a polypyridyl iron catalyst, ACS Catal., 2019, 9, 10101–10108 CrossRef CAS.
- M. F. Shabik, M. M. Hasan, K. A. Alamry, M. M. Rahman, Y. Nagao and M. A. Hasnat, Electrocatalytic oxidation of ammonia in the neutral medium using Cu2O.CuO film immobilized on glassy carbon surface, J. Electroanal. Chem., 2021, 897, 115592 CrossRef CAS.
- S. S. Prabowo Rahardjo and Y. J. Shih, Electrocatalytic ammonia oxidation mediated by nickel and copper crystallites decorated with platinum nanoparticle (PtM/G, M = Cu, Ni), ACS Sustainable Chem. Eng., 2022, 10, 5043–5054 CrossRef CAS.
- H. S. Pillai and H. Xin, New insights into electrochemical ammonia oxidation on Pt(100) from first principles, Ind. Eng. Chem. Res., 2019, 58, 10819–10828 CrossRef CAS.
- S. Johnston, S. Cohen, C. K. Nguyen, K. N. Dinh, T. D. Nguyen, S. Giddey, C. Munnings, A. N. Simonov and D. R. MacFarlane, A survey of catalytic materials for ammonia electrooxidation to nitrite and nitrate, ChemSusChem, 2022, 15, e202200614 CrossRef CAS PubMed.
- J. C. M. Silva, R. M. Piasentin, E. V. Spinacé, A. O. Neto and E. A. Baranova, The effect of antimony-tin and indium-tin oxide supports on the catalytic activity of Pt nanoparticles for ammonia electro-oxidation, Mater. Chem. Phys., 2016, 180, 97–103 CrossRef CAS.
- J. C. M. Silva, M. H. Assumpção, P. Hammer, A. O. Neto, E. V. Spinacé and E. A. Baranova, Iridium-rhodium nanoparticles for ammonia oxidation: Electrochemical and fuel cell studies, ChemElectroChem, 2017, 4, 1101–1107 CrossRef CAS.
- M. H. M. T. Assumpção, R. M. Piasentin, P. Hammer, R. F. B. De Souza, G. S. Buzzo, M. C. Santos, E. V. Spinacé, A. O. Neto and J. C. M. Silva, Oxidation of ammonia using PtRh/C electrocatalysts: Fuel cell and electrochemical evaluation, Appl. Catal., B, 2015, 174, 136–144 CrossRef.
- S. Gottesfeld, The direct ammonia fuel cell and a common pattern of electrocatalytic processes, J. Electrochem. Soc., 2018, 165, J3405–J3412 CrossRef CAS.
- A. Allagui, S. Sarfraz, S. Ntais, F. Al Momani and E. A. Baranova, Electrochemical behavior of ammonia on Ni98Pd2 nano-structured catalyst, Int. J. Hydrogen Energy, 2014, 39, 41–48 CrossRef CAS.
- Y. T. Chan, K. Siddharth and M. Shao, Investigation of cubic Pt alloys for ammonia oxidation reaction, Nano Res., 2020, 13, 1920–1927 CrossRef CAS.
- S. Johnston, B. H. R. Suryanto and D. R. MacFarlane, Electro-oxidation of ammonia on electrochemically roughened platinum electrodes, Electrochim. Acta, 2019, 297, 778–783 CrossRef CAS.
- I. Katsounaros, M. C. Figueiredo, F. Calle-Vallejo, H. Li, A. A. Gewirth, N. M. Markovic and M. T. M. Koper, On the mechanism of the electrochemical conversion of ammonia to dinitrogen on Pt(1 0 0) in alkaline environment, J. Catal., 2018, 359, 82–91 CrossRef CAS.
- H. G. Oswin and M. Salomon, The anodic oxidation of ammonia at platinum black electrodes in aqueous koh electrolyte, Can. J. Chem., 1963, 41, 1686–1694 CrossRef CAS.
- H. Gerischer and A. Mauerer, Untersuchungen Zur anodischen oxidation von ammoniak an platin-elektroden, J. Electroanal. Chem. Interfacial Electrochem., 1970, 25, 421–433 CrossRef CAS.
- V. Rosca and M. T. M. Koper, Electrocatalytic oxidation of ammonia on Pt(111) and Pt(100) surfaces, Phys. Chem. Chem. Phys., 2006, 8, 2513–2524 RSC.
- J. R. Barbosa, M. N. Leon, C. M. Fernandes, R. M. Antoniassi, O. C. Alves, E. A. Ponzio and J. C. M. Silva, PtSnO2/C and Pt/C with preferential (100) orientation: High active electrocatalysts for ammonia electro-oxidation reaction, Appl. Catal., B, 2020, 264, 118458 CrossRef CAS.
- N. Sacré, G. Hufnagel, J. Galipaud, E. Bertin, S. A. Hassan, M. Duca, L. Roué, A. Ruediger, S. Garbarino and D. Guay, Pt thin films with nanometer-sized terraces of (100) orientation, J. Phys. Chem. C, 2017, 121, 12188–12198 CrossRef.
- R. Sharma and K. K. Kar, Particle size and crystallographic orientation controlled electrodeposition of platinum nanoparticles on carbon nanotubes, Electrochim. Acta, 2015, 156, 199–206 CrossRef CAS.
- S. W. Wallace, I. T. McCrum and M. J. Janik, Ammonia electro-oxidation mechanism on the platinum (100) surface, Catal. Today, 2021, 371, 50–57 CrossRef CAS.
- D. Borodin, O. Galparsoro, I. Rahinov, J. Fingerhut, M. Schwarzer, S. Hörandl, D. J. Auerbach, A. Kandratsenka, D. Schwarzer, T. N. Kitsopoulos and A. M. Wodtke, Steric hindrance of NH3 diffusion on Pt(111) by Co-adsorbed O-atoms, J. Am. Chem. Soc., 2022, 144, 21791–21799 CrossRef CAS PubMed.
- D. Borodin, I. Rahinov, O. Galparsoro, J. Fingerhut, M. Schwarzer, K. Golibrzuch, G. Skoulatakis, D. J. Auerbach, A. Kandratsenka, D. Schwarzer, T. N. Kitsopoulos and A. M. Wodtke, Kinetics of NH3 desorption and diffusion on Pt: Implications for the Ostwald process, J. Am. Chem. Soc., 2021, 143, 18305–18316 CrossRef CAS PubMed.
- C. M. Zalitis, A. R. Kucernak, J. Sharman and E. Wright, Design principles for platinum nanoparticles catalysing electrochemical hydrogen evolution and oxidation reactions: Edges are much more active than facets, J. Mater. Chem. A, 2017, 5, 23328–23338 RSC.
- S. Le Vot, L. Roué and D. Bélanger, Study of the electrochemical oxidation of ammonia on platinum in alkaline solution: Effect of electrodeposition potential on the activity of platinum, J. Electroanal. Chem., 2013, 691, 18–27 CrossRef CAS.
- Z. Liu, Y. Yang, B. Shu, J. Liu, X. Chen, Y. Li, Y. Deng, X. Han, W. Hu and C. Zhong, A facile electrochemical method to prepare pt disk electrode with (100) preferential orientation for investigating structure-sensitive electro-oxidation reactions, Int. J. Electrochem. Sci., 2016, 11, 4675–4687 CrossRef CAS.
- J. Y. Ye, J. L. Lin, Z. Y. Zhou, Y. H. Hong, T. Sheng, M. Rauf and S. G. Sun, Ammonia electrooxidation on dendritic Pt nanostructures in alkaline solutions investigated by in-situ FTIR spectroscopy and online electrochemical mass spectroscopy, J. Electroanal. Chem., 2018, 819, 495–501 CrossRef CAS.
- T. Matsui, S. Suzuki, Y. Katayama, K. Yamauchi, T. Okanishi, H. Muroyama and K. Eguchi, In situ attenuated total reflection infrared spectroscopy on electrochemical ammonia oxidation over Pt electrode in alkaline aqueous solutions, Langmuir, 2015, 31, 11717–11723 CrossRef CAS PubMed.
- P. Müller and I. Hermans, Applications of modulation excitation spectroscopy in heterogeneous catalysis, Ind. Eng. Chem. Res., 2017, 56, 1123–1136 CrossRef.
- Y. Katayama, T. Okanishi, H. Muroyama, T. Matsui and K. Eguchi, Enhanced supply of hydroxyl species in CeO2-modified platinum catalyst studied by in situ ATR-FTIR spectroscopy, ACS Catal., 2016, 6, 2026–2034 CrossRef CAS.
- K. Siddharth, P. Alam, M. D. Hossain, N. Xie, G. S. Nambafu, F. Rehman, J. W. Y. Lam, G. Chen, J. Cheng, Z. Luo, G. Chen, B. Z. Tang and M. Shao, Hydrazine detection during ammonia electro-oxidation using an aggregation-induced emission dye, J. Am. Chem. Soc., 2021, 143, 2433–2440 CrossRef CAS PubMed.
- M. E. Abdelsalam, S. Mahajan, P. N. Bartlett, J. J. Baumberg and A. E. Russell, SERS at structured palladium and platinum surfaces, J. Am. Chem. Soc., 2007, 23, 7399–7406 CrossRef PubMed.
- R. J. Isaifan, S. Ntais and E. A. Baranova, Particle size effect on catalytic activity of carbon supported Pt nanoparticles for complete ethylene oxidation, Appl. Catal., A, 2013, 464–465, 87–94 CrossRef CAS.
- I. Brand, Application of polarization modulation infrared reflection absorption spectroscopy in electrochemistry, Springer Nature Switzerland, 2020 Search PubMed.
- C. P. Vinod, New and future developments in catalysis: Chapter 12, Insights into heterogeneous catalysis through surface science techniques, Elsevier B.V., 2013 Search PubMed.
- E. A. Monyoncho, S. N. Steinmann, C. Michel, E. A. Baranova, T. K. Woo and P. Sautet, Ethanol electro-oxidation on palladium revisited using polarization modulation infrared reflection absorption spectroscopy (PM-IRRAS) and density functional theory (DFT): Why is it difficult to break the C-C bond?, ACS Catal., 2016, 6, 4894–4906 CrossRef CAS.
- J. C. M. Silva, S. Ntais, É. Teixeira-Neto, E. V. Spinacé, X. Cui, A. O. Neto and E. A. Baranova, Evaluation of carbon supported platinumeruthenium nanoparticles for ammonia electro-oxidation: Combined fuel cell and electrochemical approach, Int. J. Hydrogen Energy, 2017, 193–201, 1–9 Search PubMed.
- A. Allagui, M. Oudah, X. Tuaev, S. Ntais, F. Almomani and E. A. Baranova, Ammonia electro-oxidation on alloyed PtIr nanoparticles of well-defined size, Int. J. Hydrogen Energy, 2013, 38, 2455–2463 CrossRef CAS.
- J. C. M. Silva, S. G. Silva, R. F. B. De Souza, G. S. Buzzo, E. V. Spinacé, A. O. Neto and M. H. M. T. Assumpc, PtAu/C electrocatalysts as anodes for direct ammonia fuel cell, Appl. Catal., A, 2015, 490, 133–138 CrossRef CAS.
- Z. Liu, Y. Li, X. Zhang, S. Rao, J. Li, W. Wang, Z. Sun and J. Yang, Surface structure engineering of PtPd nanoparticles for boosting ammonia oxidation electrocatalysis, ACS Appl. Mater. Interfaces, 2022, 14, 28816–28825 CrossRef CAS PubMed.
- H. Yano, M. Watanabe, A. Iiyama and H. Uchida, Particle-size effect of Pt cathode catalysts on durability in fuel cells, Nano Energy, 2016, 29, 323–333 CrossRef CAS.
- B. Roldan Cuenya and F. Behafarid, Nanocatalysis: Size- and shape-dependent chemisorption and catalytic reactivity, Surf. Sci. Rep., 2015, 70, 135–187 CrossRef CAS.
- T. L. Lomocso and E. A. Baranova, Electrochemical oxidation of ammonia on carbon-supported bi-metallic PtM (M = Ir, Pd, SnOx) nanoparticles, Electrochim. Acta, 2011, 56, 8551–8558 CrossRef CAS.
- F. R. Rima, K. Nakata, K. Shimazu and M. Osawa, Surface-enhanced infrared absorption spectroscopic studies of adsorbed nitrate, nitric oxide, and related compounds. 3. Formation and reduction of adsorbed nitrite at a platinum electrode, J. Phys. Chem. C, 2010, 6011–6018 CrossRef CAS.
- M. Krausa and N. D. La Plats, DEMS-cyclic voltammetry investigation of the electrochemistry of nitrogen compounds in 0.5 M potassium hydroxide, Electrochim. Acta, 1994, 39, 23–31 CrossRef.
- G. G. Botte, Electrochemical method for providing hydrogen using ammonia and ethanol, US Pat., US8221610B2, 2012 Search PubMed.
- E. A. Baranova, C. Bock, D. Ilin, D. Wang and B. MacDougall, Infrared spectroscopy on size-controlled synthesized Pt-based nano-catalysts, Surf. Sci., 2006, 600, 3502–3511 CrossRef CAS.
- A. Allagui, M. Oudah, X. Tuaev, S. Ntais, F. Almomani and E. A. Baranova, Ammonia electro-oxidation on alloyed PtIr nanoparticles of well-defined size, Int. J. Hydrogen Energy, 2013, 38, 2455–2463 CrossRef CAS.
- M. S. E. Houache, K. Hughes, A. Ahmed, R. Safari, H. Liu, G. A. Botton and E. A. Baranova, Electrochemical valorization of glycerol on Ni-Rich bimetallic NiPd nanoparticles: Insight into product selectivity using in situ polarization modulation infrared-reflection absorption spectroscopy, ACS Sustainable Chem. Eng., 2019, 7, 14425–14434 CrossRef CAS.
- E. A. Monyoncho, V. Zamlynny, T. K. Woo and E. A. Baranova, The utility of polarization modulation infrared reflection absorption spectroscopy (PM-IRRAS) in surface and in situ studies: New data processing and presentation approach, Analyst, 2018, 143, 2563–2573 RSC.
- M. S. E. Houache, E. Cossar, S. Ntais and E. A. Baranova, Electrochemical modification of nickel surfaces for efficient glycerol electrooxidation, J. Power Sources, 2018, 375, 310–319 CrossRef CAS.
Footnote |
| † Electronic supplementary information (ESI) available. See DOI: https://doi.org/10.1039/d3im00063j |
| This journal is © Institute of Process Engineering of CAS 2023 |

