 Open Access Article
Creative Commons Attribution 3.0 Unported Licence
A molecular dynamics approach to modelling oxygen diffusion in PLA and PLA clay nanocomposites†
J. C.
Lightfoot
 *a,
B.
Castro-Dominguez
 a,
A.
Buchard
 b and
S. C.
Parker
*b
aDepartment of Chemical Engineering, University of Bath, Bath, BA2 7AY, UK. E-mail: jcl68@bath.ac.uk
bCentre for Sustainable and Circular Technologies, Department of Chemistry, University of Bath, Bath, BA2 7AY, UK. E-mail: chsscp@bath.ac.uk
First published on 24th April 2023
Abstract
Poly(lactic acid), PLA, is an emerging bioplastic, considered a sustainable alternative to petroleum-derived, single-use plastics for packaging applications. This is of global significance, as this industry accounts for 38% of plastic consumption, with only one third of waste recycled. One approach to enhance the barrier performance of biodegradable PLA is via the addition of clay fillers, which are currently explored through trial-and-error experiments. Mathematical models fail to reliably predict potential improvements prior to synthesis, due to complex interfacial interactions between components. We outline atom-level molecular dynamics and Monte Carlo simulation techniques to generate polymer nanoclay composite systems and achieve highly accurate predictions of gas diffusion. We highlight statistical requirements which are historically not met in polymer/gas diffusion modelling and provide the first investigation into the relationship between penetrant diffusion and free volume in PLA composites. Widespread use of these predictive techniques can direct experimental research, towards developing superior sustainable packaging materials.
1. Introduction
Due to its synthesis from plant material, its non-toxicity and biodegradability, poly(lactic acid) (PLA) is considered one of the most promising sustainable alternatives to petroleum derived plastics in a number of technical applications. Notable applications of this polymer are in biomedical fields and in commodity applications such as in textiles and packaging.1,2 When considering the latter, the barrier performance of the packaging material is a key property to control, to ensure adequate protection from product degradation and eventual spoiling.3 Generally, high performing packaging materials are considered to be those where gas solubility and gas diffusion in the permeating material is low.4To this end, much research has focused on the addition and dispersion of clay nanoparticles within polymers. These act to reduce the rate of diffusion of gas within the material, as penetrating molecules are forced to take longer, more tortuous pathways.5 Clays including mica, smectite, saponite, montmorillonite and kaolinite have been previously added to PLA. Not only has the addition of nanoclays been demonstrated to improve the barrier performance of the polymer, but thermomechanical and even biodegradability properties may also be enhanced.6–10 Indeed, the use of non-toxic and naturally occurring clays as fillers is beneficial from an environmental perspective, to maintain the sustainability credentials of the PLA biopolymer.
This effect is influenced by the quantity and dispersion of the nanoclay platelets. By extension, the degree of clay delamination in the polymer matrix is important as this dictates the quantity of polymer/clay interfacial regions, which can be increased by varying process conditions5,11 or through surface modification.12 Surface modifications, such as inorganic ion exchange13,14 reduce the surface energy between clay layers, increasing the spacing between stacked silicate layers and improving dispersion, and exfoliation.7,14 An increase in polymer/clay affinity can also be achieved, with increased attraction between substances resulting in improved compatibility and wetting of clay surfaces by polymer chains.14,15
Several mathematical models exist to model the permeability of polymer/clay nanocomposites,13 which predict changes to predefined gas permeability values of neat polymers, from the dimensions, shape, dispersion and quantity of clay nanoparticles in a given arrangement and orientation. However, as these mathematical predictions are based solely on the tortuosity of the diffusion pathway, they suffer from poor performance in complex systems. This includes materials where chemical contributions are enhanced, such as in those where surfaces have been modified, or where a high clay content leads to agglomeration of clay stacks and non-uniform dispersions.13
The use of molecular dynamics (MD) simulations to predict the effect of different clays on gas diffusion in polymer systems is therefore promising – as complex chemical interactions which dictate the performance of the nanocomposite (e.g. filler dispersity and interfacial interactions between filler and polymer16) are modelled. However, the calculation of gas transport coefficients in high barrier plastics at ambient conditions from MD simulation is notoriously difficult, due to the inherently poor statistics associated with the low solubility and diffusion coefficients in these systems. Gas diffusion coefficients in PLA have been very poorly predicted, often incorrect by 2–4 orders of magnitude with respect to experimental values, due to these difficulties in obtaining statistically meaningful and non-anomalous transport coefficients.4,17–19 These challenges have also impeded a meaningful study into the inclusion of nanoclays in in PLA systems. With no robust methodology in place to accurately predict penetrant diffusion coefficients in PLA, oxygen diffusion is overestimated by three orders of magnitude relative to the synthetic value, and the conclusions drawn fail to reflect the differences in behaviour between the systems in the Einstein regime.20
We have previously demonstrated the statistical requirements for accurately calculating oxygen diffusion coefficients directly from the trajectories of MD simulations in polyethylene terephthalate and polyethylene furanoate.21 By running in excess of 15 duplicate simulations and monitoring penetrant diffusion over 200 ns in each case, calculated transport coefficients are consistent, reflect diffusion in a non-anomalous regime and demonstrate good agreement with their experimental counterparts. By employing this method of improved statistic to PLA, it was possible to not only calculate oxygen diffusion in neat PLA, but to devise a workflow to predict the barrier improvement factor of PLA nanocomposites.
2. Methods
The general procedure for generating and validating polymeric systems benchmarks experimental and ab initio density functional theory (DFT) results against those collected from molecular dynamics (MD) simulation. In particular, conformational and energetic characterisation was used to validate the bonding and non-bonding parameters and energetic terms of the force field.2.1. Structure generation
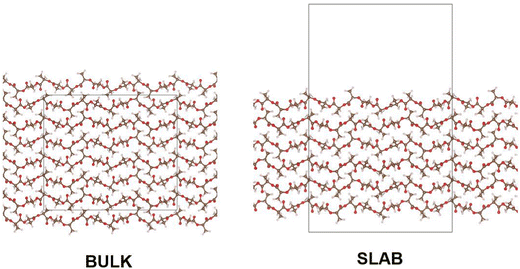
In modelling a neat amorphous PLLA system, four monodisperse systems were independently generated, containing chains of 20, 40, 100 and 200 repeat units in length and capped with methyl substituents. Force field parameters were assigned using DL_FIELD 4.6,22 employing the OPLS_2005 force field to describe PLA due to its previous success in modelling polymers,21,23 and its outperformance of other force fields tested in this work. Systems were equilibrated in the following manner: employing an NPT ensemble, systems were compacted over 2 ns at 100 atm and 750 K. Following a 1 ns return to ambient conditions, systems were exposed to 4 rounds of simulated annealing over a 10 ns NPT simulation, with temperatures cycling between 298 K and 1200 K. A final 1 ns NPT simulation at ambient conditions followed annealing, ahead of production simulations. The initial system compression was performed using DL_POLY molecular simulation code,24 due to its superior performance in modelling severely unequilibrated systems. All subsequent MD simulations were performed using the GROMACS package.25,26 All equilibration simulations employed a Berendsen thermostat and barostat. Production simulations used a Nose–Hoover thermostat and, when relevant, MTTK barostat. Pyrophyllite-containing composite systems were generated following the same workflow, other than for polymer chains which were inserted into a simulation cell already containing a single pyrophyllite layer. This clay slab was grown from crystallographic data using METADISE,27 and described using the CLAYFF general force field for inorganic materials.28 In this initial investigation, a single sheet of pyrophyllite, Al2Si4O10(OH)2, was selected as a model study, due to its well defined structure and composition. Whilst we anticipate the disruptive effect of the clay on the polymer to be replicated by all clay minerals, variations in clay composition and functionalisation should be considered for future studies to reflect the compositions used in experimental studies.A 100% crystalline system of PLA was built from the α-crystal structure, as determined by Kanamoto et al.29 through wide-angle synchrotron X-ray and neutron diffraction measurements. METADISE was used to generate bulk and slab crystalline systems; in the bulk, crystal units were grown, such that chains were 20 repeat units in length and systems were 6 chains in depth – giving a cell dimension of 27 × 26 × 62 Å. Chains were oriented such that periodic boundaries intercepted chain length orthogonally, effectively generating polymer chains of infinite length. Slab crystalline systems were built to the same dimensions as their bulk counterpart, using METADISE software to generate a PLA surface along Miller index (100) – this is depicted in Fig. 1. In molecular dynamics, these systems were equilibrated following a NσT simulation to allow for anisotropic changes to box dimensions. Systems used in DFT were built in the same manner, to 10 repeat units in length and 4 chains in depth, due to size constraints of the higher-level calculation.
2.2. Structural characterisation techniques
The conformation of polymer chains was analysed in both neat and composite systems. Distributions of select dihedral angles were collected over a 200 ns simulation in the NVT ensemble at 298 K, for comparison between systems and with experiment. Average bulk densities in simple systems were obtained from fluctuations in volume over a 1 ns NpT simulation under atmospheric conditions. Z-Density, relevant for the composite system, was obtained over a 1 ns NσT MD simulation, with isotropic scaling for simulation box angles α, β and γ. The orientation and location of the pyrophyllite layer was used to determine the ‘Z’ direction, as that which run orthogonal to the clay surface, and the boundaries of the polymer phase. The polymer region was then divided into segments, with the density of each collected over the course of the simulation.2.3. Energetic characterisation techniques
Interfacial surface energy, defined as the excess energy of a surface exposed to vacuum, per unit area, was calculated from the results of MD simulation and contrasted with values obtained from DFT calculation. This was derived from the energy of bulk and slab PLA systems, using eqn (1):30,31 | (1) |
2.4. Diffusion modelling
Oxygen diffusion in PLA systems followed the statistically robust general work-flow previously proposed in our earlier studies.21 Equilibrated systems were saturated with oxygen through grand canonical Monte Carlo simulation using a partial oxygen pressure of 1 atm; using the DL_MONTE code,35 oxygen insertion, displacement and rotation moves were performed over 1![[thin space (1/6-em)]](https://www.rsc.org/images/entities/char_2009.gif) 000
000![[thin space (1/6-em)]](https://www.rsc.org/images/entities/char_2009.gif) 000 MC steps, with a weighting of 60%, 20% and 20% respectively. Using the GROMACS package for molecular dynamics simulation,25,26 gas-saturated systems were relaxed via a 1 ns 298 K MD simulation, using the NPT ensemble to allow for volume changes to accommodate the additional oxygen molecules. Diffusion was calculated from the average mean squared displacement of oxygen across 20 subsequent 200 ns NVT simulations, using random seeding to generate the initial velocities of atoms. Einstein diffusion was established once a linear relation was attained between MSD and time, from which the application of the Einstein relation allowed for the extrapolation of the oxygen diffusion coefficient.
000 MC steps, with a weighting of 60%, 20% and 20% respectively. Using the GROMACS package for molecular dynamics simulation,25,26 gas-saturated systems were relaxed via a 1 ns 298 K MD simulation, using the NPT ensemble to allow for volume changes to accommodate the additional oxygen molecules. Diffusion was calculated from the average mean squared displacement of oxygen across 20 subsequent 200 ns NVT simulations, using random seeding to generate the initial velocities of atoms. Einstein diffusion was established once a linear relation was attained between MSD and time, from which the application of the Einstein relation allowed for the extrapolation of the oxygen diffusion coefficient. | (2) |
To analyse the distribution of free volume within these systems, 50 frames were extracted from the MD trajectory at 10 ns intervals during the non-anomalous diffusion regime. The SCAN function of DL_MONTE was employed to probe the energy of oxygen insertion along a 0.5 Å three-dimensional grid of each extracted configuration. This allowed for the identification of potential sites for oxygen occupancy and hence regions of free volume.
3. Results and discussion
3.1. Development and validation of neat PLA system
Ahead of modelling more complex composite PLA systems, crystalline and amorphous PLLA systems were generated. To attain realistic predictions of system behaviour, it was essential to ensure that a suitable force field was employed. These models were verified following the generalised protocol for system validation outlined previously.21Firstly, the energetic parameters of the force field were benchmarked against ab initio calculations. The interfacial energy of PLA in the crystalline state was calculated through DFT and MD simulation, from the difference, as a function of surface area, between bulk and slab polymeric systems (eqn (1)). Good agreement was obtained between these results, as presented in Table 1. This consistency between atomistic and more accurate quantum methods indicated suitable energetic parameters for modelling PLA using the OPLS 2005 force field.
| DFT | MD | Experiment | |
|---|---|---|---|
| E interfacial/J m−2 | 0.119 | 0.092 | — |
| ρ crystal/g cm−3 | 1.314 | 1.274 | 1.29 |
A structural validation was also performed by comparing the densities of crystalline PLA in DFT and MD, alongside experimental values determined from Wide Angle Neutron Diffraction. As fractional free volume has been determined a key parameter in governing penetrant diffusion, the minimal deviations (1.6%) in density at room temperature between MD-modelled systems and experimentally derived structures indicated that the selected OPLS force field was suitable for subsequent diffusion calculations. This was further evidenced by the agreement between density values derived from DFT and zero-kelvin MD simulations, demonstrating that the bonding and non-bonding distance terms of the force field suitably replicate the system behaviour as calculated from first principles.
Structural validation of MD-generated models was also performed in the amorphous phase and cross-referenced with experimental results. Four amorphous systems were analysed, built from polymers of increasing degrees of polymerisation, to investigate the conformation and packing over a range of chain lengths. The amorphous density of each system is detailed in Table 1, where density was analysed at room temperature and pressure following a simulated annealing procedure. All models were able to replicate the experimental amorphous density of 1.248 g cm−3,36 with an associated error of less than 5% in each case.
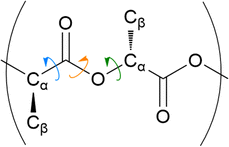
The distribution of key dihedral angles in the poly(L-lactic acid) structure was analysed for all amorphous systems. To compare simulated results to a material system, conformations were consolidated with the rotations observed in disordered systems through Raman spectroscopy, as performed by Yang and co-workers.37 This structural comparison verifies that the conformations adopted by amorphous polymer chains resemble those observed experimentally, for further validation of the force fields and methods used in generating equilibrated systems. Dihedral angles of interest were all four body interactions located along the chain backbone; C–O–Cα–C, Cα–C–O–Cα and O–Cα–C–O (Fig. 2). All distributions achieved by models followed those observed experimentally, as plotted in Fig. 3. Dihedral C–O–Cα–C occupies both trans and gauche conformations, expected at 160° and 73/287° respectively, in a 1![[thin space (1/6-em)]](https://www.rsc.org/images/entities/char_2009.gif) :
:![[thin space (1/6-em)]](https://www.rsc.org/images/entities/char_2009.gif) 9 distribution. Whist a very slight distribution is seen at ∼160°, mostly this angle occupies the trans configuration in simulated systems, in agreement with the experimentally determined dominant conformation. Both trans and gauche conformations are occupied in approximately equal ratios by O–Cα–C–O in simulated systems. Although both conformations exist experimentally, the trans conformation at 200° is expected to be more populated (76–86%) than the gauche conformation at 48/312° (14–24%). Raman spectroscopy reveals the Cα–C–O–Cα angle to be entirely in the trans conformation at 180°, reproduced exactly in amorphous systems modelled with an OPLS force field.
9 distribution. Whist a very slight distribution is seen at ∼160°, mostly this angle occupies the trans configuration in simulated systems, in agreement with the experimentally determined dominant conformation. Both trans and gauche conformations are occupied in approximately equal ratios by O–Cα–C–O in simulated systems. Although both conformations exist experimentally, the trans conformation at 200° is expected to be more populated (76–86%) than the gauche conformation at 48/312° (14–24%). Raman spectroscopy reveals the Cα–C–O–Cα angle to be entirely in the trans conformation at 180°, reproduced exactly in amorphous systems modelled with an OPLS force field.
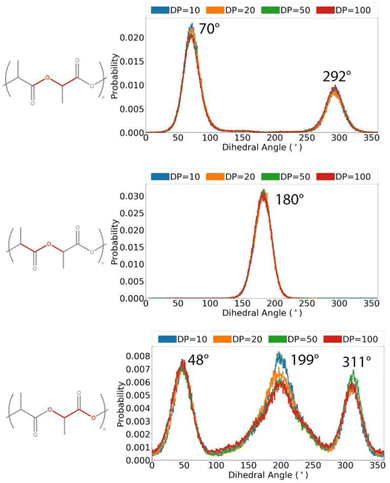 | ||
| Fig. 3 Distributions of key dihedral angles in the PLA backbone, for amorphous systems of varying chain lengths, calculated from a simulation at 298 K in the NVT ensemble. | ||
3.2. Development and validation of PLA pyrophyllite system
The suitability of the OPLS force field in modelling PLA has been assessed; energetic terms have been validated using a crystalline PLA model, and structural terms have been referenced to experimental data in amorphous systems. Having validated the force field, it was then possible to build polymer systems from which to analyse gas diffusion, which occurs via amorphous fractions. A PLA/pyrophyllite composite model was therefore built to contain amorphous PLA chains in contact with a clay slab. Before the composite model could be judged as reliable, it was essential to characterise the amorphous polymer domain. Specifically, while polymer characteristics at the interface may be distinct, the centre of the amorphous polymeric region needed to be bulk-like and simulate the characteristics of the analogous neat PLA system, for the model to be considered valid.The distributions of key dihedral angles in the PLA chain were analysed and compared to those attained in a neat PLA system of the same degree of polymerisation (DP = 20). The almost identical angle distributions of PLA in the composite system compared to those in of the pure polymer, also following the experimentally observed trends, demonstrated an appropriate composite model was attained (Fig. 4).
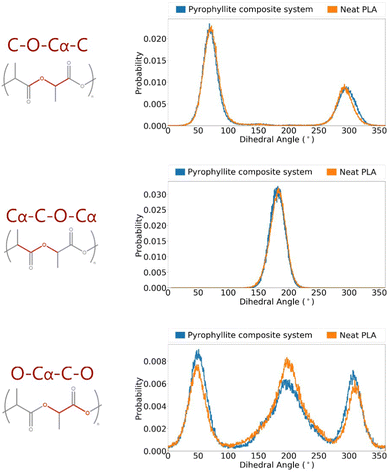 | ||
| Fig. 4 Angle distributions of key polymer backbone dihedrals of amorphous PLLA in a pyrophyllite composite system. | ||
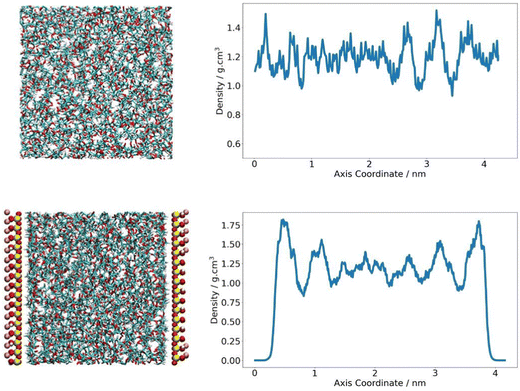
The density of the PLA domain in the composite system was analysed. As polymer chains at the clay interface are expected to behave differently to polymers in the bulk, it was appropriate to consider polymer density as a function of its location in the simulation cell and distance from the pyrophyllite surface. A Z-density profile was collected and compared to an analogous plot of pure polymer, where the Z-direction was defined as the axis orthogonal to the clay surface. In the neat PLA system, density was seen to fluctuate around an average value of 1.19 g cm−3, with fluctuations largely falling within 20% of this value – reaching a minimum of 1.0 g cm−3 and a maximum of 1.5 g cm−3. In the composite system, PLA chains were situated at proximity of ∼2 Å to the clay surface. The density of the middle region of the amorphous PLA domain follows the same trends of the pure amorphous PLA analogue. PLA density in the central 60% of the polymer phase fluctuates between 1.0–1.4 g cm−3, with an average value of 1.19 g cm−3. The consistency between this value and the system density of PLA in a neat system indicates that the amorphous PLA domain is sufficiently large to reproduce bulk-like behaviour away from the pyrophyllite surface.
To either side of the pyrophyllite layer, there was evidence of the formation of primary and secondary high-density shells; these were characterised by a significantly higher than average polymer density of 1.8 g cm−3 and 1.6 g cm−3 respectively, with low-density troughs between shells of ∼0.88 g cm−3. In these high-density polymer layers, density is 50% and 35% larger than that of the average system, as depicted in Fig. 5. These shells are likely to have been formed by the attraction between polymer and clay, following the experimental observations of Priestley et al., who identified that polymer density was enhanced for chains adsorbed onto nanocomposite surfaces.38 They found that, in situ polymer adsorption to the composite surface increased chain density initially. However, the presence of a highly packed polymer layer formed at the interface subsequently impeded further interpenetration of the polymer. This obstruction hindered further chain adsorption to the surface, leading to regions of excess free volume running through the adsorbed layer. This phenomenon may account for the observed formation primary and secondary dense layers in the simulation, with shells separated by sparely packed regions where polymer density is at a minimum. As the intensity of adsorption is inherently linked to the level of attraction between polymer and clay, more favourable interactions between polymer and clay lead to higher density layers and therefore further slow gas transport.
A study indicates that polymers in this adsorbed layer are immobilised relative to the bulk,39 with these regions referred to as rigid amorphous fractions (RAF). The formation of a RAF surrounding filler particles in composite systems has been previously observed experimentally in composite systems.40–42 To evaluate whether this phenomenon was manifested in composite models, we characterised chain mobility throughout the polymer environment. Diffusion coefficients were calculated for each carbon (Cβ) of every polymer chain individually, which was then mapped to the location of the atom over the MD trajectory.
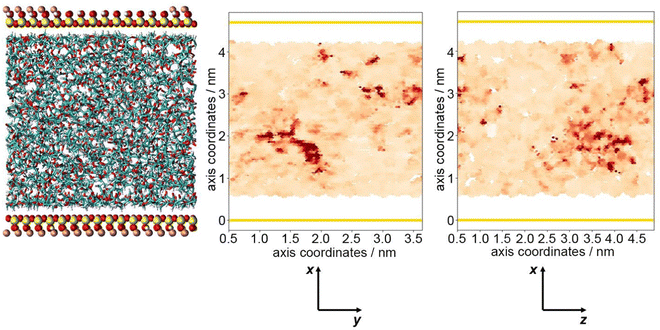
These coordinates and coefficients may be plotted as a heatmap, to depict the fluctuations in mobility in relation to the location of the interface. This is shown in Fig. 6, where darker shades of red represent areas occupied by more mobile atoms, possessing larger diffusion coefficients. By visualising the system in this way, it was not possible to distinguish separate, well-defined domains relating to the previously observed highly dense layers at the interface. It is likely that this lack of definition is due to simulation length, as the libration experienced by all chain atoms remains very low. Trends may be more pronounced by increasing the length of simulations, however the large quantity of data required for this plot imposes a practical limit on the size of trajectory that can feasibly be processed (1681 diffusion coefficients calculated individually and correlated with 337 881 distinct coordinates). With the data available, general trends may be extrapolated; atoms at the polymer/clay interface tend to have lower diffusion coefficients, whereas the most mobile of atoms are observed towards the centre of the polymer system. This is likely due to attractive forces between polymer chains and clay surfaces, tethering chains in place and restricting polymer movement at the boundary. Experimentally, this phenomenon is responsible for the formation of a RAF, indicating a realistic portrayal of polymer behaviour in composite models.40–42
3.3. Oxygen diffusion modelling
Oxygen diffusion through amorphous PLA was evaluated in both neat polymer and polymer composite systems. Following the previously reported minimum statistical requirements for accurate calculations of oxygen diffusion from MSD in high barrier polymer systems,21 penetrant diffusion was calculated over 20 duplicate 200 ns simulations. The associated oxygen diffusion coefficients are reported in Table 2.| System | D simulated/cm2 s−2 |
|---|---|
| Neat PLA | 4.03 ± 0.58 × 10⁻⁸ |
| PLA/pyrophyllite | 1.33 ± 0.27 × 10⁻⁸ |
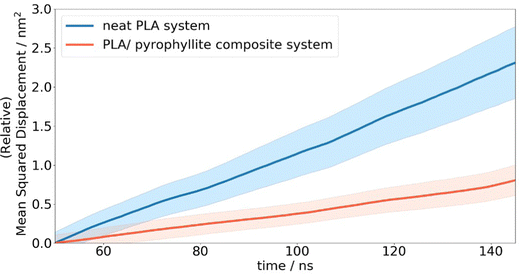
In the case of neat amorphous PLA, the linear Einstein diffusion regime was established after 50 ns of simulation, and henceforth maintained with an R2 value of 0.998 (Fig. 7). The realisation of Einstein diffusion mechanics is reaffirmed by the close agreement between the log(MSD) against log(time) plot calculated from the raw data and the ideal straight line curve of log(MSD) = log(time) + log(6D) for the calculated diffusion coefficient, D. Oxygen diffusion in PLA was calculated as 4.03 ± 0.58 × 10⁻⁸ cm2 s−1, showing a close resemblance to the experimental value of 1.37 × 10⁻⁸ cm2 s−1.43 While no uncertainty data is provided for the cited experimental diffusion coefficient, reported coefficients from different sources show a standard deviation of 2.3 × 10⁻⁹ cm2 s−1. This is consistent with the level of uncertainty associated with our computational predictions, calculated from the standard error of oxygen MSD across all repeat simulations. This prediction is significantly more accurate than previous attempts to calculate oxygen diffusion in PLA from MD simulation, which are incorrect by 3 orders of magnitude due to not being able to access statistics and simulation CPU time.4,19 The error in previous calculations is therefore far greater than the level of variation exhibited experimentally.
Compared to simulated gas transport in the neat PLA systems, oxygen diffusion was measured as 3× lower in composite systems, at 1.33 ± 0.27 × 10⁻⁸ cm2 s−1, when the amorphous polymer was in contact with a layer of pyrophyllite. This matches the trends observed experimentally, where clay additives are added to PLA to enhance barrier properties. A ‘barrier improvement factor’ (BIF) is used experimentally to monitor improvements to barrier properties on mixing, defined as the ratio of transmission through a neat film to the transmission through the composite film.13 BIFs for PLA/montmorillonite nanocomposites are reported in the region of 1.5–3, for 3–10 wt% clay loading – on the same scale as simulated results. Although not directly comparable due to the differences in clay composition, morphology and particle size used in this experiment, these results indicate reasonable and plausible modelled behaviour for oxygen molecules in a PLA/clay composite system.
In addition to isotropic diffusion, anisotropic diffusion was also calculated, as presented in Table 3; this is particularly important in the composite system, where diffusion is likely to be both directional and space dependent due to the placement of the clay walls. Indeed, whereas directional diffusion was found to be approximately equal in pure PLA systems, oxygen diffusion was found to be significantly more impeded along the x-axis. In this direction, oxygen diffusion coefficients were 6.6 times lower than that of a neat system; this being the direction orthogonal to the clay surface through which the penetrant gas cannot pass. However, although there are no physical barriers to prevent oxygen diffusion along the y- or z axis in a composite system, diffusion is nonetheless more than halved in these directions. This implies that the barrier performance is enhanced due to structural changes to the polymer phase, caused by interactions with the clay surface. In order to further understand the oxygen diffusion pathway and reasons for the reduced diffusion in the composite system, a structural investigation is performed, specifically with respect to sites of increased oxygen retention.
| D(isotropic) × 108 cm2 s−1 | D(x) × 108 cm2 s−1 | D(y) × 108 cm2 s−1 | D(z) × 108 cm2 s−1 | |
|---|---|---|---|---|
| Neat | 4.03 ± 0.58 | 4.64 ± 1.00 | 3.97 ± 0.65 | 3.27 ± 0.52 |
| Composite | 1.33 ± 0.27 | 0.71 ± 0.13 | 1.82 ± 0.32 | 1.48 ± 0.59 |
| D neat/Dcomposite | 3.03 | 6.57 | 2.18 | 2.22 |
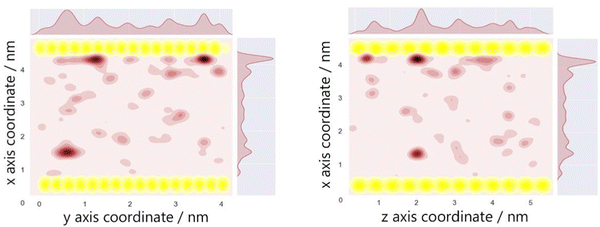
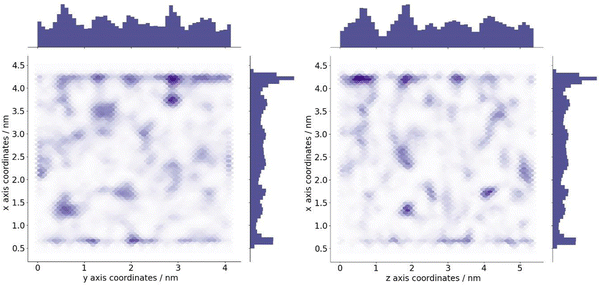
The optimum oxygen location can be obtained from a kernel density estimation (KDE) plot showing the accumulated oxygen coordinates over all timesteps and duplicate simulations. This method allows for the visualisation of the probability density of oxygen positioning with respect to its location within the system, as demonstrated in Fig. 8. Whilst molecular oxygen is seen to dwell throughout the system, representative of the sporadic mechanism of gas diffusion in bulk polymers, few identifiable sites exist where the oxygen retention is notably longer. These hotspots, depicted in dark red, lie either at the pyrophyllite interface, or in proximity to the boundary, localised in low density areas between highly dense PLA shells. This is likely due to a combination of factors; firstly, favourable interactions between oxygen and the clay surface lead to increased retention at the clay surface. Additionally, molecules may be trapped at the interface by the high-density polymer layer which separates oxygen from the polymer bulk, where gas diffusion is faster due to decreased density and higher chain mobility. This is further demonstrated by a free volume analysis of the system, averaged over the 200 ns simulation, where the greatest proportion of free volume sites lie between the polymer and clay. In many cases, prominent identified sites, shown in Fig. 9, directly overlay with locations highlighted in Fig. 8, where oxygen is retained for longer.
The fractional free volume (FFV) of PLA was found to be 0.197 and 0.179 in neat systems and in the polymer phase of the composite system (see ESI†). These values are consistent with the increased polymer density observed in the PLA/clay composite, causing an overall lower FFV. However, differences between these values are subtle, as the majority of PLA in a composite system is bulk-like in nature and therefore biases the overall FFV towards that of the neat value. Considering a singular value does not sufficiently portray the physical nuances of the system; such observations may only be obtained when considering a free volume distribution, as in Fig. 9, which enables the observation of a higher fraction of free volume directly at the interface between polymer and clay. This observation and the direct correlation between long-lived free volume sites and oxygen retention is significant. Whereas free volume quantity has been established to facilitate diffusion, herein we observe large volumes which retain penetrant gas and cause a reduction in diffusion. This is due to the entrapment of free volume sites by rigid and highly dense surrounding polymer. This highlights the importance to consider the dynamics of free volume over time, and its distribution, rather than an overall FFV value.
The validity of modelling composite systems as infinite slab layers can be rationalised by considering the pathway of oxygen displacement between filler nanoplatelets. Due to the low height to length ratio of nanoplatelets, displacement of oxygen parallel to the clay surface – of the type modelled in this study – will limit the rate of penetrant diffusion in these systems. This is due to increased interactions between polymer and penetrant with the clay surface, and hence the greater retention at the interface, as observed in the modelled behaviour. Comparatively, perpendicular displacement between nanoparticles is likely to proceed faster due to the decreased presence of the clay, causing bulk-like diffusion behaviour. This notion forms the basis of the Nielsen permeability model, where diffusion through a regular arrangement of nanoplatelets is considered a one-dimensional problem due to the small thickness of particles comparted to their lateral dimensions.12,13,44,45
By considering a single pyrophyllite surface of infinite length, oxygen molecules in the model developed in this study are prevented from travelling in between layers. Rather, by considering only diffusion parallel to the clay surface, this model probes the effects which are likely to have the greatest effect on slowing gas transport. This is evident when comparing directional diffusion coefficients, where diffusion in the axis normal to the clay surface is vastly reduced. We argue that as these obstructions exist experimentally, it is valid to consider diffusion in all directions, including that which is orthogonal to the clay slab. However, as this phenomenon is exaggerated in simulation, it is likely that the predicted difference in oxygen diffusion between neat and composite systems falls at the higher end of the spectrum, at a BFI of 3. This simple model offers a robust method for testing and comparing the performance of different clays to enhance barrier properties, and in identifying improvements which may be attained through variation in filler composition or surface modification. Gas diffusion is observed to be directly affected by the strength of interaction between the polymer and clay – which is expected to vary with clay and polymer composition. Thus, this methodology can be used effectively to compare and optimise potential polymer composite systems prior to synthesis. Experimental research may be accelerated in the design of superior sustainable packaging materials, by first using computational techniques to identify systems with enhanced properties.
4. Conclusion
In this study we have presented further evidence for the accuracy of our proposed method to quantify penetrant diffusion in bulk polymers at atmospheric conditions, and its versatility towards composite materials. The inability of previous studies to simulate realistic penetrant transport limit has been shown to be due to poor statics, and their short time scale enabled only investigation into anomalous diffusion regimes which are vastly exaggerated relative to experimental values. We achieve realistic oxygen diffusion coefficients by ensuring the generation of stable and valid models, and by collecting sufficient statistics to ensure Einstein diffusion is achieved. Oxygen diffusion coefficients are calculated as 4.03 ± 0.58 × 10⁻⁸ cm2 s−1 and 1.33 ± 0.27 × 10⁻⁸ cm2 s−1 respectively for pure and pyrophyllite-containing PLA systems, and are demonstrated to be converged with respect to mean squared displacement across 20 repeats. Axial diffusion coefficients show that penetrant transport is reduced in all directions – most notably along the x-axis where transport is physically obstructed by the clay surface. However, a reduction by a factor of 2.2 in the y and z directions compared to a neat system suggests that significant intermolecular and interfacial interactions also significantly contribute to impeding oxygen movement. These reductions reflect the barrier improvement factors attained experimentally by PLA nanoclay membranes. Application of the digital tools and methods herein presented have the potential to accelerate the development of composite materials for sustainable packaging sufficiently to respond to the urgency of the ongoing environmental crisis.Further investigation into the structural changes of PLA in contact with a clay surface revealed two highly dense and rigid polymer layers were formed at the clay interface, with a 44% increase in chain packing density in these regions relative to the bulk. While this follows experimental observations, the presence of these dense shells is not acknowledged experimentally to cause the observed improvements to barrier performance in composite materials. The trajectories of diffusing oxygen molecules over the course of the simulation show that the greatest oxygen retention occurs in the highly dense layer. This study therefore links isolated experimental morphological studies with gas permeability, and provides insight into the physical attributes which cause improved barrier performance.
For the first time, we consider the interactions at the interface as a function of free volume density distribution within the system – revealing noteworthy insight into the mechanism by which nanoparticles improve the barrier properties of polymers. Whereas free volume sites are conventionally associated with facilitating gas transport, here we observe that the largest distributions of free volume directly overlay with coordinates of the greatest oxygen retention – both of which are at and in proximity to the interface. Therefore, we conclude that the generally accepted straightforward relationship of greater free volume equating to faster diffusion is not valid in complex heterogeneous systems. In this study, substantial sites of free volume entrap oxygen and hinder diffusion due to their lack of mobility. This stems from a restriction of the surrounding rigid PLA adsorbed to the clay surface. This demonstrates the need to study both the distribution and evolution of free volume over time; a simple quantification of fractional free volume is insufficient in heterogenous composite systems were space-dependent variations in morphology are present.
Given the success of modelling the pyrophyllite/PLA composite system, a useful next step would be to apply this methodology to consider commercially cheaper clays such as montmorillonite, mica, smectite, saponite and kaolinite, which are frequently added to PLA and for which experimentally barrier improvement factors have been reported.13 Future work may also be to test the robustness of the outlined methodology at various thermodynamics conditions, for example to predict gas permeability properties for pressurised applications or in polymer melts.
Conflicts of interest
There are no conflicts of interest to declare.Acknowledgements
This research made use of the Balena High Performance Computing (HPC) Service at the University of Bath and the ARCHER UK National Supercomputing Service via our membership of the UK HEC Materials Chemistry Consortium (MCC; EPSRC EP/L000202, EP/R029431, EP/T022213). The authors thank the UK EPSRC (EP/L016354/1, studentship to J. C. L., CDT in Sustainable Chemical Technologies, and EP/V051083/1, grant to Manufacturing in Hospital: BioMed 4.0) and the Royal Society (UF/160021 and URF\R\221027 fellowship to A. B.) for research funding.References
- S. Domenek and V. Ducruet, Biodegradable and Biobased Polymers for Environmental and Biomedical Applications, Wiley & Scrivener Publishing, New Jersey, USA, 2016 DOI:10.1002/9781119117360.ch6.
- I. Delidovich, P. J. C. Hausoul, L. Deng, R. Pfützenreuter, M. Rose and R. Palkovits, Alternative Monomers Based on Lignocellulose and Their Use for Polymer Production, Chem. Rev., 2016, 116(3), 1540–1599, DOI:10.1021/acs.chemrev.5b00354.
- A. Figoli, Encyclopedia of Membranes, Springer, Berlin, Heidelberg, 2016 DOI:10.1007/978-3-662-44324-8_851.
- H. Ebadi-Dehaghani, M. Barikani, H. A. Khonakdar, S. H. Jafari, U. Wagenknecht and G. Heinrich, On O2 gas permeability of PP/PLA/clay nanocomposites: A molecular dynamic simulation approach, Polym. Test., 2015, 45, 139–151, DOI:10.1016/j.polymertesting.2015.05.010.
- S. Alix, et al., Effect of Highly Exfoliated and Oriented Organoclays on the Barrier Properties of Polyamide 6 Based Nanocomposites, J. Phys. Chem. C, 2012, 116(8), 4937–4947, DOI:10.1021/jp2052344.
- S. Sinha Ray, K. Yamada, M. Okamoto and K. Ueda, New polylactide-layered silicate nanocomposites. 2. Concurrent improvements of material properties, biodegradability and melt rheology, Polymer, 2003, 44(3), 857–866, DOI:10.1016/S0032-3861(02)00818-2.
- P. Maiti, K. Yamada, M. Okamoto, K. Ueda and K. Okamoto, New Polylactide/Layered Silicate Nanocomposites:
![[thin space (1/6-em)]](https://www.rsc.org/images/entities/char_2009.gif) Role of Organoclays, Chem. Mater., 2002, 14(11), 4654–4661, DOI:10.1021/cm020391b.
Role of Organoclays, Chem. Mater., 2002, 14(11), 4654–4661, DOI:10.1021/cm020391b. - S. Sinha Ray, K. Yamada, M. Okamoto, Y. Fujimoto, A. Ogami and K. Ueda, New polylactide/layered silicate nanocomposites. 5. Designing of materials with desired properties, Polymer, 2003, 44(21), 6633–6646, DOI:10.1016/j.polymer.2003.08.021.
- S. S. Ray, K. Yamada, A. Ogami, M. Okamoto and K. Ueda, New Polylactide/Layered Silicate Nanocomposite: Nanoscale Control Over Multiple Properties, Macromol. Rapid Commun., 2002, 23(16), 943–947 CrossRef CAS.
- S. Sinha Ray, K. Yamada, M. Okamoto, A. Ogami and K. Ueda, New Polylactide/Layered Silicate Nanocomposites. 3. High-Performance Biodegradable Materials, Chem. Mater., 2003, 15(7), 1456–1465, DOI:10.1021/cm020953r.
- B. Alexandre, et al., Water barrier properties of polyamide 12/montmorillonite nanocomposite membranes: Structure and volume fraction effects, J. Memb. Sci., 2009, 328(1), 186–204, DOI:10.1016/j.memsci.2008.12.004.
- L. E. Nielsen, Models for the Permeability of Filled Polymer Systems, J. Macromol. Sci., Part A: Pure Appl. Chem., 1967, 1(5), 929–942, DOI:10.1080/10601326708053745.
- S. Singha and M. S. Hedenqvist, A Review on Barrier Properties of Poly(Lactic Acid)/Clay Nanocomposites, Polymers, 2020, 12(5), 1095, DOI:10.3390/polym12051095.
- E. Castro-Aguirre, R. Auras, S. Selke, M. Rubino and T. Marsh, Impact of Nanoclays on the Biodegradation of Poly(Lactic Acid) Nanocomposites, Polymers, 2018, 10(2), 202, DOI:10.3390/polym10020202.
- M. R. Kamal, J. U. Calderon and B. R. Lennox, Surface Energy of Modified Nanoclays and Its Effect on Polymer/Clay Nanocomposites, J. Adhes. Sci. Technol., 2009, 23(5), 663–688, DOI:10.1163/156856108X379164.
- S. Morimune-Moriya, M. Kotera and T. Nishino, Alignment control of clay and its effect on properties of polymer nanocomposites, Polymer, 2022, 256, 125202, DOI:10.1016/j.polymer.2022.125202.
- L.-Q. Liao, Y.-Z. Fu, X.-Y. Liang, L.-Y. Mei and Y.-Q. Liu, Diffusion of CO2 Molecules in Polyethylene Terephthalate/Polylactide Blends Estimated by Molecular Dynamics Simulations, Bull. Korean Chem. Soc., 2013, 34, 753–758 CrossRef CAS.
- T. Xiang and B. D. Anderson, Water uptake, distribution, and mobility in amorphous poly(D,L-lactide) by molecular dynamics simulation, J. Pharm. Sci., 2014, 103(9), 2759–2771 CrossRef CAS PubMed.
- A. Salehi, S. H. Jafari, H. A. Khonakdar and H. Ebadi-Dehaghani, Temperature dependency of gas barrier properties of biodegradable PP/PLA/nanoclay films: Experimental analyses with a molecular dynamics simulation approach, J. Appl. Polym. Sci., 2018, 135(35), 46665, DOI:10.1002/app.46665.
- A. Prada, et al., Nanoparticle Shape Influence over Poly(lactic acid) Barrier Properties by Molecular Dynamics Simulations, ACS Omega, 2022, 7(3), 2583–2590, DOI:10.1021/acsomega.1c04589.
- J. C. Lightfoot, A. Buchard, B. Castro-Dominguez and S. C. Parker, Comparative Study of Oxygen Diffusion in Polyethylene Terephthalate and Polyethylene Furanoate Using Molecular Modeling: Computational Insights into the Mechanism for Gas Transport in Bulk Polymer Systems, Macromolecules, 2022, 55(2), 498–510, DOI:10.1021/acs.macromol.1c01316.
- C. W. Yong, Descriptions and Implementations of DL_F Notation: A Natural Chemical Expression System of Atom Types for Molecular Simulations, J. Chem. Inf. Model., 2016, 56(8), 1405–1409, DOI:10.1021/acs.jcim.6b00323.
- W. Damm, A. Frontera, J. Tirado–Rives and W. L. Jorgensen, OPLS all-atom force field for carbohydrates, J. Comput. Chem., 1997, 18(16), 1955–1970 CrossRef CAS.
- I. T. Todorov, W. Smith, K. Trachenko and M. T. Dove, DL_POLY_3: new dimensions in molecular dynamics simulations via massive parallelism, J. Mater. Chem., 2006, 16(20), 1911–1918, 10.1039/B517931A.
- S. Pronk, et al., GROMACS 4.5: a high-throughput and highly parallel open source molecular simulation toolkit, Bioinformatics, 2013, 29(7), 845–854, DOI:10.1093/bioinformatics/btt055.
- H. J. C. Berendsen, D. van der Spoel and R. van Drunen, GROMACS: A messagepassing parallel molecular dynamics implementation, Comput. Phys. Commun., 1995, 91(1), 43–56, DOI:10.1016/0010-4655(95)00042-E.
- G. W. Watson, E. T. Kelsey, N. H. de Leeuw, D. J. Harris and S. C. Parker, Atomistic simulation of dislocations, surfaces and interfaces in MgO, J. Chem. Soc., Faraday Trans., 1996, 92(3), 433–438, 10.1039/FT9969200433.
- R. T. Cygan, J.-J. Liang and A. G. Kalinichev, Molecular Models of Hydroxide, Oxyhydroxide, and Clay Phases and the Development of a General Force Field, J. Phys. Chem. B, 2004, 108(4), 1255–1266, DOI:10.1021/jp0363287.
- K. Wasanasuk, et al., Crystal Structure Analysis of Poly(l-lactic Acid) α Form On the basis of the 2-Dimensional Wide-Angle Synchrotron X-ray and Neutron Diffraction Measurements, Macromolecules, 2011, 44(16), 6441–6452, DOI:10.1021/ma2006624.
- V. Fiorentini and M. Methfessel, Extracting convergent surface energies from slab calculations, J. Phys.: Condens. Matter, 1996, 8(36), 6525, DOI:10.1088/0953-8984/8/36/005.
- R. Tran, et al., Surface energies of elemental crystals, Sci. Data, 2016, 3(1), 160080, DOI:10.1038/sdata.2016.80.
- J. Hafner and G. Kresse, Properties of Complex Inorganic Solids, Springer, Boston, USA, 1997 DOI:10.1007/978-1-4615-5943-6_10.
- G. Kresse and J. Hafner, Ab initio molecular-dynamics simulation of the liquid-metal-amorphous-semiconductor transition in germanium, Phys. Rev. B: Condens. Matter Mater. Phys., 1994, 49(20), 14251–14269, DOI:10.1103/PhysRevB.49.14251.
- G. Kresse and J. Furthmüller, Efficient iterative schemes for ab initio total-energy calculations using a plane-wave basis set, Phys. Rev. B: Condens. Matter Mater. Phys., 1996, 54(16), 11169–11186, DOI:10.1103/PhysRevB.54.11169.
- J. A. Purton, J. C. Crabtree and S. C. Parker, DL_MONTE: a general purpose program for parallel Monte Carlo simulation, Mol. Simul., 2013, 39(14–15), 1240–1252, DOI:10.1080/08927022.2013.839871.
- S. Farah, D. G. Anderson and R. Langer, Physical and mechanical properties of PLA, and their functions in widespread applications—A comprehensive review, Adv. Drug Delivery Rev., 2016, 107, 367–392, DOI:10.1016/j.addr.2016.06.012.
- S. Kang, S. L. Hsu, H. D. Stidham, P. B. Smith, M. A. Leugers and X. Yang, A Spectroscopic Analysis of Poly(lactic acid) Structure, Macromolecules, 2001, 34(13), 4542–4548, DOI:10.1021/ma0016026.
- K. Randazzo, et al., Direct Visualization and Characterization of Interfacially Adsorbed Polymer atop Nanoparticles and within Nanocomposites, Macromolecules, 2021, 54(21), 10224–10234, DOI:10.1021/acs.macromol.1c01557.
- A. Mujtaba, et al., Detection of Surface-Immobilized Components and Their Role in Viscoelastic Reinforcement of Rubber–Silica Nanocomposites, ACS Macro Lett., 2014, 3(5), 481–485, DOI:10.1021/mz500192r.
- J. Benz and C. Bonten, Rigid Amorphous Fraction as an Indicator for Polymer-Polymer Interactions in Highly Filled Plastics, Polymers, 2021, 13(19), 3349, DOI:10.3390/polym13193349.
- P. Klonos, et al., Morphology, crystallization and rigid amorphous fraction in PDMS adsorbed onto carbon nanotubes and graphite, Polymer, 2018, 139, 130–144, DOI:10.1016/j.polymer.2018.02.020.
- S. Koutsoumpis, K. N. Raftopoulos, O. Oguz, C. M. Papadakis, Y. Z. Menceloglu and P. Pissis, Dynamic glass transition of the rigid amorphous fraction in polyurethaneurea/SiO2 nanocomposites, Soft Matter, 2017, 13(26), 4580–4590, 10.1039/C7SM00397H.
- C. Courgneau, S. Domenek, A. Guinault, L. Avérous and V. Ducruet, Effect of crystallization on barrier properties of formulated polylactide, Polym. Int., 2012, 61(2), 180–189, DOI:10.1002/pi.3167.
- A. A. Sapalidis, F. K. Katsaros and N. K. Kanellopoulos, PVA/Montmorillonite Nanocomposites: Development and Properties, ed. J. Cuppoletti, IntechOpen, Rijeka, 2011, ch. 2 Search PubMed.
- J. Macher, P. Golestaneh, A. E. Macher, M. Morak and A. Hausberger, Filler Models Revisited: Extension of the Nielson Model with Respect to the Geometric Arrangements of Fillers, Polymers, 2022, 14(16), 3327, DOI:10.3390/polym14163327.
Footnote |
| † Electronic supplementary information (ESI) available. See DOI: https://doi.org/10.1039/d3ma00158j |
| This journal is © The Royal Society of Chemistry 2023 |

