DOI:
10.1039/D3QI01649H
(Research Article)
Inorg. Chem. Front., 2023,
10, 6701-6710
Structural confinement toward suppressing concentration and thermal quenching for improving near-infrared luminescence of Fe3+†
Received
18th August 2023
, Accepted 19th September 2023
First published on 21st September 2023
Abstract
Luminescence concentration quenching and thermal quenching are closely related to the energy transfer (ET) process between optically active ions. Herein, we utilize the structural confinement effect in Sr9Ga(PO4)7 (SGP) to selectively control ET pathways so as to suppress luminescence concentration and thermal quenching. In the Fe3+-doped SGP compound, the relatively large Fe3+–Fe3+ distances can inhibit the ET between Fe3+ ions, leading to weak concentration quenching. The Sr9Ga0.8(PO4)7:0.2Fe3+ (SGP:0.2Fe3+) phosphor exhibits the highest near-infrared (NIR) luminescence intensity, and the emission intensity for 50% and 100% Fe3+-doped SGP phosphors is 73.46% and 18.25% of that for the optimal sample SGP:0.2Fe3+, respectively. Upon co-doping Yb3+ into SGP:0.2Fe3+, Fe3+–Yb3+ distances are much shorter than those of Fe3+–Fe3+, causing energy to quickly migrate from the quenching center Fe3+ to the thermally stable center Yb3+. The thermal stability of SGP:0.2Fe3+,0.07Yb3+ is greatly enhanced compared to SGP:0.2Fe3+. This study provides a strategy for enhancing NIR luminescence through utilizing structural confinement to control ET pathways toward suppressing concentration and thermal quenching. Finally, we demonstrate the potential applications of SGP:0.2Fe3+ and SGP:0.2Fe3+,0.07Yb3+ phosphors in night vision and optical thermometry fields.
1. Introduction
Near-infrared (NIR) luminescent materials have aroused extensive research for their applications in the fields of night vision, plant growth, biomedical imaging, food analysis, etc. owing to the advantages of invisibility to human eyes, characteristic absorption by certain molecules and strong penetrating ability of NIR light.1–6 Hitherto, the majority of research on NIR luminescent materials has been concentrated on Cr3+ activators with 3d3 electronic configuration, and plenty of excellent Cr3+-activated NIR phosphors have been developed, such as Sr2ScSbO6:Cr3+, LaMgGa11O19:Cr3+, Ca3Sc2Si3O12:Cr3+, ScBO3:Cr3+, Ca2LuZr2Al3O12:Cr3+ and so on.7–11 However, there exists the potential risk of Cr3+ ions in these materials being oxidized to Cr6+ ions, which may deteriorate the NIR luminescence efficiency severely.12–14 In particular, the oxidation of chromium ions will greatly increase the toxicity of Cr3+-doped phosphors, potentially causing damage to any organisms and their structures, such as human cells and internal organs, thereby further inhibiting practical bio-applications especially in long-term in vivo therapies.15,16 Therefore, it is of great importance to develop alternatives to Cr3+ emitters that exhibit NIR luminescence.
Trivalent transition metal Fe3+ ion, as an essential element in the human body, has been a promising environmentally friendly and chemically stable alternative activator for NIR emission. Fe3+ ions are characterized by their half-filled 3d5 electronic configuration, and both octahedral and tetrahedral sites are suitable for Fe3+ to exhibit NIR luminescence.17 Similar to Cr3+ ions, the emission wavelength of Fe3+ ions can be easily tuned because the bare 3d electrons are susceptible to the host environment.18 However, the d–d transition of Fe3+ ions is strictly restricted by the Laporte selection rule, especially in highly symmetric fields,14,19 and moreover suffers from a strong electron–phonon coupling effect, leading to the poor luminescence property of Fe3+ ions. Several strategies have been proposed to enhance Fe3+ luminescence. For instance, a series of Sr2−yCay(InSb)1−zSn2zO6:Fe3+ phosphors with tunable emission from 885 to 1005 nm have been reported through crystallographic site engineering strategy, and thus an efficient double perovskite phosphor Ca2InSbO6:Fe3+ with ultra-high internal quantum efficiency (IQE) of 87% has been developed.14 Besides, Liu et al. reported the zero thermal quenching NIR luminescence up to 200 °C in KAl11O17:Fe3+ through multi-site energy transfer (ET).20 In addition to the methods of crystallographic site engineering and multi-site ET, utilizing the structural confinement effect to suppress luminescence concentration and thermal quenching has also been proved to be an effective way to enhance luminescence in Cr3+-activated phosphors. As reported in Sr9Ga(PO4)7:Cr3+ (SGP:Cr3+) and Sr9Cr(PO4)7:Yb3+ phosphors,21,22 the inhibited Cr3+–Cr3+ ET and induced Cr3+–Yb3+ ET are conducive to improving the NIR emission. The optimal Cr3+ dopant concentration in SGP is up to 80% with suppressed concentration quenching, and the emission intensity of Sr9Cr(PO4)7:0.15Yb3+ at 375 K can be maintained at 100% of that at 80 K due to efficient Cr3+–Yb3+ ET. Considering that Fe3+ and Cr3+ have the same ionic valence and similar ionic radius, the SGP compound with structural confinement effect is an ideal host structure for Fe3+ occupation to achieve NIR emission. Furthermore, through guiding the ET from Fe3+ to the thermally stable center Yb3+, the luminescence thermal stability is expected to be improved.
In this work, based on SGP compound with unique structural characteristic, we investigate the effect of structural confinement on luminescence concentration and thermal quenching for enhancing NIR luminescence. In Fe3+-doped SGP phosphors, the distances between Fe3+ ions are relatively large, giving rise to suppressed Fe3+–Fe3+ ET and high dopant level of Fe3+ ions. Furthermore, when co-doping Yb3+ ions into Sr9Ga0.8(PO4)7:0.2Fe3+ (SGP:0.2Fe3+), the relatively short Fe3+–Yb3+ distances contribute to inducing the ET from the luminescence quenching center Fe3+ to the thermally stable center Yb3+. Compared with the SGP:0.2Fe3+ phosphor, the luminescence thermal stability of SGP:0.2Fe3+,0.07Yb3+ is significantly enhanced. Finally, the potential applications of SGP:0.2Fe3+ and SGP:0.2Fe3+,0.07Yb3+ phosphors in night vision and optical thermometry fields are explored.
2. Experimental section
2.1. Materials and synthesis procedures
Sr9Ga1−x(PO4)7:xFe3+ (SGP:xFe3+) and Sr9−2yGa0.8(PO4)7:0.2Fe3+,yYb3+,yNa+ (SGP:0.2Fe3+,yYb3+) phosphors were synthesized by the traditional high-temperature solid-state reaction. Upon doping Yb3+ ions, the equal molar weight of Na+ ions were added to balance the charge. According to the stoichiometric ratio, high purity (99.99%, Aladdin) raw materials of SrCO3, Ga2O3, NH4H2PO4, Fe2O3, Yb2O3 and Na2CO3 were weighed accurately. The compounds were ground for 30 min in an agate mortar to mix thoroughly. Afterwards, the mixtures were transferred into alumina crucibles and placed inside a box furnace to pre-sinter at 800 °C for 3 h at a heating rate of 2 °C min−1. After cooling down to room temperature naturally, the mixtures were ground again and re-sintered at 1200 °C for 4 h under an air atmosphere inside a box furnace. Finally, the obtained samples were ground to fine powders for subsequent characterization.
2.2. Characterization
Powder X-ray diffraction (XRD) patterns were recorded on a diffractometer (SmartLab, Rigaku, Japan) with Cu Kα radiation (λ = 1.5406 Å) operating at 40 kV and 200 mA. The FullProf Suite package was used to refine the cell parameters.23 A fluorescence spectrophotometer (Edinburgh Instruments, FLS-1000), equipped with a continuous 500 W xenon lamp and a microsecond flashlamp, was used to measure photoluminescence (PL) spectra, photoluminescence excitation (PLE) spectra and luminescence decay curves. The temperature-dependent PL spectra were recorded using the FLS-1000 instrument equipped with a variable-temperature liquid nitrogen optical cryostat Oxford OptistatDN2. An UV-visible-NIR spectrophotometer (Hitachi High-Tech Science Corporation, UH4150), with BaSO4 as the standard, was used to measure diffuse reflection (DR) spectra. Scanning electron microscopy (SEM) images were recorded using a JEOL JSM-6510A microscope equipped with an energy dispersive X-ray analyzer. The IQE and external quantum efficiency (EQE) values were measured using an absolute PL quantum yield spectrometer (Quantaurus-QY Plus C13534-1, Hamamatsu Photonics).
2.3. LED device and thin film fabrication
The phosphor-converted light-emitting diode (pc-LED) devices were manufactured by coating phosphors on 365 nm UV chips (Sanan Optoelectronics). The phosphors and transparent silicone were mixed with a mass ratio of 1![[thin space (1/6-em)]](https://www.rsc.org/images/entities/char_2009.gif) :2 and stirred for 15 min. After coating the glue on the chip, the pc-LED devices were solidified at 160 °C for 1 h. Then, an OHSP-350IRS handheld spectrometer was employed to measure the electroluminescence (EL) spectra of the fabricated pc-LED devices in a dark room under a driving voltage of 4.5 V and a current of 500 mA.
:2 and stirred for 15 min. After coating the glue on the chip, the pc-LED devices were solidified at 160 °C for 1 h. Then, an OHSP-350IRS handheld spectrometer was employed to measure the electroluminescence (EL) spectra of the fabricated pc-LED devices in a dark room under a driving voltage of 4.5 V and a current of 500 mA.
To prepare the thin film, the phosphor was dissolved in polydimethylsiloxane (PDMS) and a small amount of curing agent was added. The mixtures were stirred for 15 min to mix evenly. Then, a transparent mold with the characters “N I R” and a rectangular mold were placed on a polyethylene terephthalate (PET) sheet, and the mixtures were cast on the mold to form a smooth surface. After solidifying in an oven at 160 °C for 2 h, the thin film can be obtained by peeling it from the PET sheet.
3. Results and discussion
3.1. Crystal structure and XRD analysis
The β-Ca3(PO4)2-type structural compound SGP belongs to the monoclinic crystal system with an I12/a1 space group.24 Since SGP has similar crystal structure to Sr9In(PO4)7, we used the crystallographic information of Sr9In(PO4)7 (ICSD 59722) to clarify the structure of SGP. In the SGP structure, Sr2+ ions possess five different crystallographic positions marked as Sr1–Sr5 with the coordination number of eight or nine, while the Ga3+ ion is coordinated to six oxygen ions to form an octahedron.24 Given the same ionic valence and the similar ionic radius of Fe3+ ions (r = 0.645 Å, CN = 6) and Ga3+ ions (r = 0.62 Å, CN = 6),25 Fe3+ ions tend to occupy the sites of Ga3+ ions. The ionic radius of Sr2+ ions (r = 1.26 Å, CN = 8; r = 1.31 Å, CN = 9) is larger than that of Yb3+ ions (r = 0.985 Å, CN = 8; r = 1.042 Å, CN = 9),25 meaning that Yb3+ ions are expected to substitute for Sr2+ ions. Fig. 1a shows the crystal structure viewed from the [001] direction, and it is apparent that [GaO6] octahedra are well separated by Sr–O/P–O polyhedra and distributed in layers. Besides, as shown in Fig. 1b and c, [GaO6] octahedra are positioned far away from each other (9.0173–18.3714 Å), while the distances between [GaO6] and the nearest Sr1–Sr5 atoms are much shorter (3.7393–5.3357 Å). This special structural characteristic confers on the SGP structure the structural confinement effect, which has been discussed in SGP:Cr3+ and Sr9Cr(PO4)7:Yb3+ phosphors.21,22 In view of the structural confinement, the ET path can be controlled, and we speculate that the ET between Fe3+–Fe3+ ions in SGP can be restrained effectively while the Fe3+–Yb3+ ET can be strengthened. Therefore, it is expected to achieve suppressed luminescence concentration quenching in SGP:Fe3+ phosphor and suppressed luminescence thermal quenching in SGP:Fe3+,Yb3+ phosphor.
 |
| | Fig. 1 (a) Crystal structure of SGP viewed from the [001] direction. (b) Distances between [GaO6] octahedra. (c) Distances between Ga and the nearest Sr1–Sr5 atoms. (d) XRD patterns of SGP:xFe3+ (0 ≤ x ≤ 1). (e) Rietveld refinement of SGP:0.2Fe3+. (f) Rietveld refinement of Sr9Fe(PO4)7. | |
Fig. 1d and S1† show the XRD patterns of SGP:xFe3+ (0 ≤ x ≤ 1), SGP:0.2Fe3+,yYb3+ (0.005 ≤ y ≤ 0.20) and SGP:0.1Yb3+ phosphors as well as the standard pattern of the SGP phase (PDF no. 53-0180). All the diffraction peaks can be well indexed to the standard pattern, demonstrating that all the samples are pure phases. Based on the crystallographic information of Sr9In(PO4)7, the Rietveld refinement of SGP:0.2Fe3+ and Sr9Fe(PO4)7 phosphors is conducted as presented in Fig. 1e and f. Table S1† gives the detailed crystallographic parameters, and the values with χ2 = 2.54 and 3.01 ensure the reliability of the refinement. It can be seen that the cell parameters (a, b and c) and the unit cell volume V of Sr9Fe(PO4)7 are a little larger than those of SGP:0.2Fe3+ due to the larger ionic radius of Fe3+ ions. Besides, Fig. S2a and b† present the SEM images and elemental mapping images of SGP:0.2Fe3+ and SGP:0.2Fe3+,0.07Yb3+ phosphors, indicating that the phosphors consist of several irregular particles with sizes of approximately 5–20 μm and all the elements (Sr, Ga, P, O, Fe, Yb, Na) are evenly distributed in the particles.
3.2. Suppressed luminescence concentration quenching in SGP:Fe3+
Fig. 2a displays the DR spectra of all the SGP:xFe3+ (0 ≤ x ≤ 1) phosphors. It can be seen that the absorption bands are mainly located in the UV region (270–400 nm), which can be attributed to the host absorption of SGP (300 nm) as well as the charge transfer (CT) transition between ligand O2− ions and central metal Fe3+ ions (330 nm).26 Compared with the Fe3+-free sample, in addition to the absorption band from O2−–Fe3+ CT transitions, there exist three other absorption bands peaking at about 425, 550 and 750 nm in Fe3+-doped phosphors originating from 6A1(6S) → 4T2(4D), 6A1(6S) → 4T2(4G) and 6A1(6S) → 4T1(4G) transitions of Fe3+ ions,27 respectively. When enhancing the Fe3+ dopant concentration from 5% to 100%, the absorption intensity gradually increases. In particular, for samples with x = 0.8–1, the absorption intensity at around 400–650 nm significantly increases, but it has no effect on the luminescence performance. Fig. 2b and c exhibit the PLE and PL spectra of SGP:xFe3+ (0.05 ≤ x ≤ 1) phosphors. Monitoring at 915 nm, the excitation peaks in the range of 270–400 nm play a dominant role, while the peaks from spin- and parity-forbidden d–d transitions of Fe3+ ions are extremely weak. This indicates that the SGP:Fe3+ phosphor can be excited by 365 nm UV LED chips effectively. Besides, as shown in Fig. 2c, under the excitation of 330 nm, a broad NIR emission band ranging from 750 to 1200 nm centered at 915 nm with full-width at half-maximum (FWHM) value of 155 nm can be observed, which originates from the 4T1(4G) → 6A1(6S) transition of Fe3+ ions in an octahedral crystal field,16 while the emission intensity increases when enhancing the Fe3+ concentration from 5% to 20%, and then decreases. As shown in Fig. S3,† the emission intensity of 50% and 100% Fe3+-doped samples can be maintained at 73.46% and 18.25% that of the 20% Fe3+-doped phosphor, respectively. In general, the optimal Fe3+-dopant concentration in previously reported phosphors is relatively small, such as 0.3%, 1% and 2% in ZnGa2O4, LiAl5O8 and NaScSi2O6,16,18,28 respectively. The suppressed luminescence concentration quenching in Fe3+-doped SGP phosphors is closely related to the unique structural characteristic of SGP. On introducing Fe3+ ions into the SGP host, [FeO6] octahedra are positioned far away from each other, and the octahedra distributed in different layers are well separated by the Sr–O/P–O polyhedra. ET has a close association with the distance between luminescence centers,29 and this special structural characteristic of the SGP can effectively inhibit the ET between Fe3+ ions. Therefore, it is expected to achieve high Fe3+ dopant concentration so as to increase the absorption intensity and thus enhancing the luminescence efficiency. The IQE/EQE values of the optimal sample SGP:0.2Fe3+ are 6.6%/5.3% (Fig. S4a†). A similar phenomenon has been observed in Cr3+-doped SGP phosphors, and the optimal Cr3+ doping concentration is up to 80%.21 All these phenomena are related to the structural confinement effect of the SGP compound. Both Cr3+- and Fe3+-doped SGP phosphors can achieve NIR luminescence and suppressed concentration quenching due to the presence of suitable octahedral sites and the structural confinement effect. However, introducing Cr3+ and Fe3+ ions into SGP has different effects on the luminescence performance. On the one hand, the excitation peak of SGP:Cr3+ matches well with the 450 nm blue LED chip while that of SGP:Fe3+ matches well with the 365 nm UV LED chip. On the other hand, the luminescence efficiency of the Cr3+-doped SGP is higher than that of the Fe3+-doped SGP, and thus the luminescence efficiency of the SGP:Fe3+ phosphor should be further improved in future works.
 |
| | Fig. 2 (a) DR spectra of SGP:xFe3+ (0 ≤ x ≤ 1). (b) PLE and (c) PL spectra of SGP:xFe3+ (0.05 ≤ x ≤ 1). (d) Comparison of the PLE spectrum at 77 K and the DR spectrum of SGP:0.2Fe3+. (e) T–S energy-level diagram of the 3d5 electronic configuration in the octahedral field as well as the PLE and PL spectra of SGP:0.2Fe3+. | |
Generally, the lattice vibration can be greatly minimized at extremely low temperature. The PLE spectrum of SGP:0.2Fe3+ was recorded at 77 K to assign the energy levels accurately. As presented in Fig. 2d, an additional excitation peak at 383 nm appears when the PLE spectrum is recorded at 77 K, and this peak originates from the 6A1(6S) → 4E(4D) transition of Fe3+ ions.26 Fig. S5† shows the magnified PLE spectrum recorded at 77 K and the DR spectrum ranging from 450 to 800 nm of SGP:0.2Fe3+. It can be found that the absorption peaks match well with the excitation peaks. Similar to Cr3+ ions with the 3d3 electronic configuration, as can be seen from the Tanabe–Sugano (T–S) energy-level diagram in Fig. 2e,30 the emission wavelength of Fe3+ is strongly influenced by the crystal field strength. The values of the octahedral crystal field parameter Dq, the Racah parameters B, C and the crystal field strength Dq/B of the SGP:Fe3+ phosphor can be estimated based on the following equations:27,31
| | | E(6A1(6S) → 4T2(4D)) = 13B + 5C | (1) |
| | | E(6A1(6S) → 4E2(4D)) = 17B + 5C | (2) |
| | | E(6A1(6S) → 4T1(4P)) = 18B + 7C | (3) |
| | | E(6A1(6S) → 4T1(4G)) = 10Dq + 10B + 6C − (26B2/10Dq) | (4) |
| | | E(6A1(6S) → 4T2(4G)) = 10Dq + 18B + 6C − (26B2/10Dq) | (5) |
Derived from the excitation peak positions of the PLE spectrum recorded at 77 K, the energy values corresponding to transitions 6A1(6S) → 4E(4D), 6A1(6S) → 4T2(4D) and 6A1(6S) → 4T2(4G) can be determined as 26109.66, 23529.41 and 17699.12 cm−1 (383, 425 and 565 nm), respectively. According to eqn ((1), (2) and (5)), the values of the octahedral crystal field parameter Dq, and the Racah parameters B and C are calculated to be 1111.06, 645.06 and 3028.72 cm−1, respectively. Thus, the crystal field strength Dq/B of the SGP:Fe3+ phosphor is determined to be 1.72. As indicated in Fig. 2e, the d–d transition from excited state 4T1(4G) to ground state 6A1(6S) gives rise to broadband NIR luminescence, and the energy difference between different excitation peaks matches well with that between different energy levels in the T–S diagram (Fig. 2e), further indicating the rationality for the attribution of excitation peaks. Besides, Fig. S6a† presents luminescence decay curves of SGP:xFe3+ (0.05 ≤ x ≤ 1) phosphors excited by 330 nm and monitored at 915 nm. As shown in Fig. S6b,† the lifetime values decrease from 636.99 to 171.59 μs when enhancing the Fe3+ concentration from 5% to 100% owing to the increased possibility of non-radiative ET.32 The lifetime values of Fe3+ ions in SGP are in line with those values of typical Fe3+-doped phosphors, such as NaScSi2O6:Fe3+.28
To meet the requirements of practical applications, phosphors with excellent luminescence thermal stability are significantly important. Fig. S7a and b† show the temperature-dependent PL spectra at 80–500 K of the SGP:0.2Fe3+ phosphor as well as the dependence of PL intensity and PL peak wavelength on temperature. It can be seen that as the temperature increases from 80 to 500 K, the PL peak wavelength gradually shifts from 934 to 885 nm, accompanied by a decrease in the emission intensity. The blue shift of peak wavelength can be ascribed to the reduced crystal field strength. With increasing temperature, the lattice vibration intensifies, thus leading to lattice expansion.33 Since the crystal field parameter Dq is inversely proportional to the 5th power of the metal–ligand distance,34 lattice expansion will reduce the crystal field strength. As shown in the T–S diagram presented in Fig. 2e, the weaker the crystal field strength, the smaller the emission peak wavelength. On the other hand, the reduced emission intensity is ascribed to the luminescence thermal quenching related to non-radiative processes. Fig. S8† displays the configurational coordinate diagram to illustrate the thermal quenching behavior of the SGP:Fe3+ phosphor. The thermal activation energy is an important parameter that characterizes the luminescence thermal stability, which is defined as the energy difference between the lowest point of the 4T1(4G) state and the intersection of 4T1(4G) and 6A1(6S) states. According to eqn (S1),†10 the plot of ln(I0/IT − 1) versus 1/kT for SGP:0.2Fe3+ is shown in Fig. S7c.† It is obvious that the data can be fitted to two lines with different slopes. The larger energy ΔE2 (0.182 eV) in the high-temperature region may be related to the thermal ionization process, while the smaller energy ΔE1 (0.093 eV) in the low-temperature region is the thermal activation energy for non-radiative relaxation.35 The small value of ΔE1 corresponds to the poor thermal stability of SGP:0.2Fe3+, and the T50 value (temperature at which the luminescence intensity is half of its original intensity) of this phosphor is only 260 K (Fig. S7b†). Besides, the Huang–Rhys parameter S can be used to imply the strength of electron–phonon coupling. Based on the relationship between the FWHM value and temperature given in eqn (S2),†36 the plot of FWHM versus T for SGP:0.2Fe3+ is depicted in Fig. S7d.† The FWHM values increase with rising temperature, and the fitted value of S is 2.594, demonstrating a strong electron–phonon coupling effect. Therefore, it is of great significance to take measures to enhance the luminescence thermal stability of the SGP:0.2Fe3+ phosphor.
3.3. Suppressed luminescence thermal quenching in SGP:0.2Fe3+, Yb3+
Efficient energy transfer from Fe3+ to Yb3+.
Introducing rare earth ions Yb3+ as activators into Cr3+-doped phosphors has been proved to be an effective strategy to improve the luminescence property. Inspired by the Cr3+–Yb3+ ET method, it is expected to enhance the luminescence performance through Fe3+–Yb3+ ET by doping Yb3+ ions into the SGP:0.2Fe3+ phosphor. As displayed in Fig. 3a, there exists a large spectral overlap between the emission spectrum of SGP:0.2Fe3+ and the absorption spectrum of SGP:0.2Fe3+,0.15Yb3+ in the wavelength range of 860–1050 nm, indicating the probability of ET from Fe3+ to Yb3+ ions. The absorption band peaking at 965 nm of the Yb3+-doped sample originates from the 2F7/2 → 2F5/2 transition of Yb3+ ions.37 Besides, the PL and PLE spectra can further indicate the occurrence of the ET process. As shown in Fig. 3b, under the excitation of 330 nm, all the Yb3+-doped phosphors display an extra emission band peaking at 978 nm with the wavelength range of 950–1100 nm, which is attributed to the 2F5/2 → 2F7/2 transition of Yb3+ ions.37 Upon increasing the Yb3+ concentration, Fe3+ luminescence quenches rapidly, while Yb3+ luminescence significantly increases until y = 0.07, and then decreases due to the concentration quenching effect. The integrated PL intensity and peak intensity values at 978 nm of the optimal sample SGP:0.2Fe3+,0.07Yb3+ are 1.78 and 4.25 times higher than those of the Yb3+-free sample, and the IQE/EQE values of SGP:0.2Fe3+,0.07Yb3+ are enhanced to 11.8%/9.4% (Fig. S4b†). Compared with the Yb3+-free sample, the luminescence efficiency is significantly improved. In addition, Fig. S9† presents the PLE spectra of SGP:0.2Fe3+,yYb3+ (0 ≤ y ≤ 0.20) monitored at 915 and 978 nm. The PLE spectra monitoring at the Yb3+ emission wavelength presents the same excitation bands as those when monitoring at the Fe3+ emission wavelength, demonstrating the existence of ET from Fe3+ to Yb3+ ions. As depicted in Fig. S10a,† the excitation band of the Yb3+ single-doped SGP phosphor lies in the range of 270–350 nm peaking at around 300 nm, which does not match the 365 nm chip. In particular, through Fe3+ → Yb3+ ET, the emission intensity of the SGP:0.2Fe3+,Yb3+ phosphor can be significantly improved under 365 nm excitation (Fig. S10b†). Besides, as shown in Fig. 3d, with increasing Yb3+ dopant concentration, the PLE intensity at 330 nm reduces monotonously when being monitored at 915 nm while the PLE intensity is first enhanced up until y = 0.07 when being monitored at 978 nm, providing further evidence for the ET from Fe3+ to Yb3+.
 |
| | Fig. 3 (a) PL spectrum of SGP:0.2Fe3+ and DR spectrum of SGP:0.2Fe3+,0.15Yb3+. (b) PL spectra of SGP:0.2Fe3+,yYb3+ (0 ≤ y ≤ 0.20). (c) Dependence of the integrated PL intensity and peak intensity at 978 nm on Yb3+ concentration y. (d) Relationship between the PLE intensity at 330 nm and Yb3+ concentration y monitored at 915 and 978 nm, respectively. (e) Luminescence decay curves of SGP:0.2Fe3+,yYb3+ excited by 330 nm and monitored at 915 nm. (f) Dependence of the ET efficiency on Yb3+ concentration y. | |
To better understand the mechanism of ET between Fe3+ and Yb3+ ions, the ET efficiency of SGP:0.2Fe3+,yYb3+ (0 < y ≤ 0.20) is calculated on the basis of luminescence decay curves. Fig. 3e shows the luminescence decay curves of SGP:0.2Fe3+,yYb3+ (0 ≤ y ≤ 0.20) excited by 330 nm and monitored at 915 nm. It is obvious that the lifetime values are attenuated with rising Yb3+ concentration, the lifetimes for the samples with y = 0, 0.01, 0.07, 0.10, 0.15 and 0.20 are fitted to be 599.79, 494.40, 368.25, 205.48, 179.23 and 112.76 μs, respectively. According to the calculation method for ET efficiency, given in eqn (S3),†38 the ET efficiency of SGP:0.2Fe3+,0.2Yb3+ is up to 81.2% (Fig. 3f), indicating the efficient ET from Fe3+ to Yb3+ ions. The efficient ET from Fe3+ to Yb3+ can be attributed to the structural confinement effect of the SGP structure. ET is closely related to the distance between luminescence centers. As displayed in Fig. 1b and c, upon introducing Fe3+ and Yb3+ ions into the SGP host, Fe3+ substituting for Ga3+ and Yb3+ replacing Sr2+ will form a tight Fe3+–Yb3+ pair with small separation, which is conducive to the efficient Fe3+–Yb3+ ET. The efficient ET from Cr3+ to Yb3+ caused by the structural confinement effect has been verified in Sr9Cr(PO4)7:Yb3+ with the same structure.22 Therefore, it is significant to choose host compounds with structural confinement to control the ET path so as to improve the luminescence performance.
Enhanced luminescence thermal stability in SGP:0.2Fe3+,Yb3+.
Fig. 4a presents temperature-dependent PL spectra at 80–500 K of the SGP:0.2Fe3+,0.07Yb3+ phosphor, and the PL spectrum recorded at 77 K is displayed in Fig. 4b. Besides, as shown in Fig. S11,† the PLE spectra of SGP:0.2Fe3+,0.07Yb3+ monitored at 915 and 978 nm while being recorded at 77 K present the same shapes, demonstrating the existence of Fe3+–Yb3+ ET. Because of the efficient ET from Fe3+ to Yb3+, it can be found that the emission band is composed of several sharp-line emission peaks ranging from 950 to 1100 nm, which originate from the 2F5/2 → 2F7/2 transition of Yb3+ ions.37 Apparently, the sharp-line emission peaks become more separated at low temperature due to the suppressed vibrational coupling effect. The energy-level diagram of Yb3+ in SGP:0.2Fe3+ is constructed roughly as shown in Fig. 4c. There are only two multiplet manifolds in the energy-level diagram of Yb3+, with the ground state 2F7/2 splitting into three Stark levels and the excited state 2F5/2 splitting into four.39 These seven Stark levels are labeled 1 to 7 as the increments of energy. The rich Stark energy levels contribute to the luminescence with multiple phonon side bands. The emission at 971 nm can be determined as the zero-phonon line, corresponding to the transition between the lowest energy level of 2F5/2 and 2F7/2 (5 → 1).40 Thus, the luminescence at around 964, 992, 1002, 1011, 1022 and 1068 nm can be attributed to the transition from different 2F5/2 sub-levels to 2F7/2 sub-levels as denoted in Fig. 4c.
 |
| | Fig. 4 (a) Temperature-dependent PL spectra at 80–500 K of SGP:0.2Fe3+,0.07Yb3+. (b) PL spectrum of SGP:0.2Fe3+,0.07Yb3+ recorded at 77 K. (c) Energy-level diagram of Yb3+. (d) Relationship between the integrated emission intensity and the temperature of SGP:0.2Fe3+ and SGP:0.2Fe3+,0.07Yb3+. | |
In addition, as reported in many Cr3+ and Yb3+ co-doped phosphors, such as LiScP2O7:Cr3+,Yb3+, Ca2LuZr2Al3O12:Cr3+,Yb3+, Gd3Sc1.5Al0.5Ga3O12:Cr3+,Yb3+, etc., thermal quenching can be effectively suppressed compared to the Yb3+-free sample.11,41,42 Analogously, as shown in Fig. 4d, co-doping Yb3+ to the SGP:0.2Fe3+ phosphor can significantly enhance the luminescence thermal stability. It is obvious that the T50 values are greatly raised from 260 K for SGP:0.2Fe3+ to 365 K for SGP:0.2Fe3+,0.07Yb3+. The improved thermal stability is ascribed to the efficient ET from Fe3+ to Yb3+ ions. Similar to transition metal Cr3+ ions, the d–d transition of Fe3+ ions with the 3d5 configuration is strongly coupled to the host lattice due to the bare 3d electron, and thus the non-radiative transition is strong, causing the poor luminescence thermal stability of the SGP:0.2Fe3+ phosphor. In contrast, the f–f transition of Yb3+ ions is hardly influenced by the host lattice because its 4f orbitals are shielded by the outer 5s and 5p orbitals, making the Yb3+ ion a thermally stable luminescence center. In the SGP compound with structural confinement, the Fe3+–Fe3+ distances are relatively large and the Fe3+–Yb3+ distances are extremely short, which contribute to the inhibited Fe3+–Fe3+ ET and the induced Fe3+–Yb3+ ET. Therefore, more energy is migrated from the luminescence quenching center Fe3+ to the thermally stable center Yb3+ so as to suppress the luminescence thermal quenching of the SGP:0.2Fe3+,0.07Yb3+ phosphor.
3.4. Potential applications in night vision and optical thermometry fields
Night vision.
To demonstrate the potential applications of SGP:0.2Fe3+ and SGP:0.2Fe3+,0.07Yb3+ phosphors, two NIR pc-LED devices were fabricated by coating the abovementioned NIR phosphors on 365 nm UV chips. Fig. 5a and b present the EL spectra of the fabricated NIR pc-LED devices as well as photographs of the packaged lamps with the light off and on. The spectrum of the pc-LED device manufactured with SGP:0.2Fe3+ exhibits a broad NIR emission band over the range of 750–1100 nm, which is consistent with the PL spectrum shown in Fig. 2c. The spectral dip at about 910 nm in Fig. 5a originates from the instrumental error in this wavelength region. Then, we explored the applications of this NIR pc-LED device in the night vision field. As shown in Fig. 5c, when irradiated by NIR light from the fabricated NIR pc-LED device, the pattern on the box and the powder in the bottle are clearly visible in the dark with the aid of a NIR camera. In particular, the different colors in the pattern can be distinguished and displayed with shadows of different degrees, demonstrating promising application in distinguishing color. Besides, as shown on the left in Fig. 5d, a thin film with three characters “N I R” was made by mixing the SGP:0.2Fe3+ phosphor with PDMS. Under the irradiation of 365 nm light, the characters “N I R” can be observed in the dark (right-hand image in Fig. 5d). These results indicate that NIR pc-LED devices prepared from the SGP:0.2Fe3+ phosphor and 365 nm chip have application prospects in the field of night vision.
 |
| | Fig. 5 EL spectra of fabricated NIR pc-LED devices with (a) SGP:0.2Fe3+ and (b) SGP:0.2Fe3+,0.07Yb3+ coated on 365 nm UV chips as well as photographs of the packaged lamps with the light off and on. (c) Photographs of the box and bottle captured under natural light using a visible camera (left) and under NIR light using a NIR camera (right). (d) Photographs of thin film made using the SGP:0.2Fe3+ phosphor and glue captured under natural light using a visible camera (left) and in the dark using a NIR camera under the irradiation of 365 nm light (right). | |
Optical thermometry.
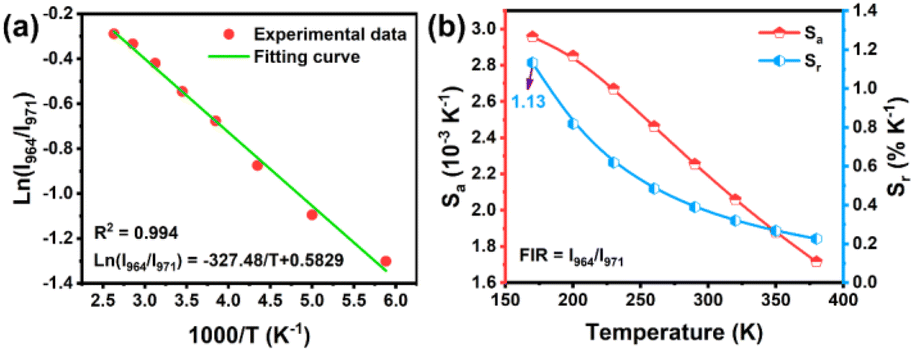
In addition, we investigated potential applications of the SGP:0.2Fe3+,0.07Yb3+ phosphor in the field of optical thermometry. Optical thermometry based on fluorescence intensity ratio (FIR) technology has great advantages of high detection precision and resolution, wide detection temperature range as well as tunable size, making it a promising candidate for non-contact thermometry.43 As illustrated in Fig. 4a, the SGP:0.2Fe3+,0.07Yb3+ phosphor exhibits several distinct and separated emission peaks due to the rich energy-level structure of Yb3+ ions. With increasing temperature from 80 to 500 K, the positions of these emission peaks are almost unchanged while the emission intensity of different peaks display different variation trends, providing the possibility that this phosphor could be used in FIR-based optical thermometry. The FIR of anti-Stokes vibronic emission at 964 nm and zero-phonon line emission at 971 nm can be fitted well according to the following equation:43| |  | (6) |
where B and ΔE are constants, T is the temperature, and k represents the Boltzmann constant (8.617 × 10⁻⁵ eV K−1). As shown in Fig. 6a, the experimental data can be well fitted in the temperature range of 170 to 380 K. The fitted function is ln(I964/I971) = −327.48/T + 0.5829, and thus the constants ΔE/k and B are 327.48 K and 1.79, respectively. Besides, the absolute sensitivity (Sa) and the relative sensitivity (Sr) are two parameters used to evaluate the applicability of optical thermometry quantitatively, both of which can be calculated according to the following equations:44,45| |  | (7) |
| |  | (8) |
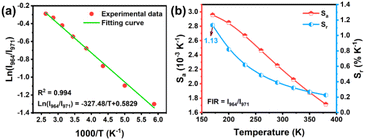 |
| | Fig. 6 (a) Plot of I964/I971versus 1000/T. (b) The absolute sensitivity Sa and the relative sensitivity Sr values in the temperature range of 170–380 K. | |
According to the data fitted using eqn (6), the values of Sa and Sr are calculated and presented in Fig. 6b. It can be seen that Sa and Sr decrease when increasing the temperature from 170 to 380 K, and the maximum of Sr is up to 1.13% K−1 at 170 K, indicating that the SGP:0.2Fe3+,0.07Yb3+ phosphor has the potential to be utilized as a low-temperature sensor.
4. Conclusions
In this work, a series of SGP:Fe3+ and SGP:0.2Fe3+,Yb3+ NIR phosphors were synthesized via the traditional high-temperature solid-state reaction. The effect of structural confinement on luminescence concentration and thermal quenching is discussed in detail. Upon doping Fe3+ ions into SGP, a broad NIR emission band peaking at 915 nm can be observed. The relatively large Fe3+–Fe3+ distances lead to weak luminescence concentration quenching. The optimal Fe3+ dopant concentration is up to 20%, and the emission intensity of Sr9Fe(PO4)7 is maintained at 18.25% that of SGP:0.2Fe3+. Furthermore, by introducing Yb3+ ions into SGP:0.2Fe3+, the tight Fe3+–Yb3+ pair is conducive to strengthening the ET from the luminescence quenching center Fe3+ to the thermally stable center Yb3+, thus suppressing the luminescence thermal quenching. Finally, we fabricated two NIR pc-LED devices by combining SGP:0.2Fe3+ and SGP:0.2Fe3+,0.07Yb3+ on 365 nm UV chips, and demonstrated that the two phosphors are promising candidates for applications in the night vision field. Besides, the application of SGP:0.2Fe3+,0.07Yb3+ in the field of optical thermometry has been explored, indicating the potential application of the SGP:0.2Fe3+,0.07Yb3+ phosphor being utilized in low-temperature sensors.
Conflicts of interest
The authors declare no conflict of interest.
Acknowledgements
This work is supported by the National Natural Science Foundation of China (no. 12274023 and 51972020). We express our special thanks to Prof. Zhiguo Xia from South China University of Technology for the IQE/EQE measurements.
References
- F. Y. Zhao, Z. Song and Q. L. Liu, Advances in chromium–activated phosphors for near–infrared light sources, Laser Photonics Rev., 2022, 16, 2200380 CrossRef CAS
 .
.
- C. P. Wang, X. M. Wang, Y. Zhou, S. Zhang, C. Li, D. F. Hu, L. Xu and H. Jiao, An ultra-broadband near-infrared Cr3+-activated gallogermanate Mg3Ga2GeO8 phosphor as light sources for food analysis, ACS Appl. Electron. Mater., 2019, 1, 1046–1053 CrossRef CAS .
- M.-H. Fang, G. N. A. De Guzman, Z. Bao, N. Majewska, S. Mahlik, M. Grinberg, G. Leniec, S. M. Kaczmarek, C.-W. Yang, K. M. Lu, H.-S. Sheu, S. F. Hu and R. S. Liu, Ultra-high-efficiency near-infrared Ga2O3:Cr3+ phosphor and controlling of phytochrome, J. Mater. Chem. C, 2020, 8, 11013–11017 RSC .
- A. Guelpa, F. Marini, A. du Plessis, R. Slabbert and M. Manley, Verification of authenticity and fraud detection in South African honey using NIR spectroscopy, Food Control, 2017, 73, 1388–1396 CrossRef CAS .
- L. L. Zhang, D. D. Wang, Z. D. Hao, X. Zhang, G. H. Pan, H. J. Wu and J. H. Zhang, Cr3+–doped broadband NIR garnet phosphor with enhanced luminescence and its application in NIR spectroscopy, Adv. Opt. Mater., 2019, 7, 1900185 CrossRef .
- L. You, R. D. Tian, T. L. Zhou and R.-J. Xie, Broadband near-infrared phosphor BaMgAl10O17:Cr3+ realized by crystallographic site engineering, Chem. Eng. J., 2021, 417, 129224 CrossRef CAS .
- M. Zhao, S. Q. Liu, H. Cai, F. Y. Zhao, Z. Song and Q. L. Liu, Efficient broadband near-infrared phosphor Sr2ScSbO6:Cr3+ for solar-like lighting, Sci. China Mater., 2022, 65, 748–756 CrossRef CAS .
- S. Q. Liu, Z. Z. Wang, H. Cai, Z. Song and Q. L. Liu, Highly efficient near-infrared phosphor LaMgGa11O19:Cr3+, Inorg. Chem. Front., 2020, 7, 1467–1473 RSC .
- Z. W. Jia, C. X. Yuan, Y. F. Liu, X.-J. Wang, P. Sun, L. Wang, H. C. Jiang and J. Jiang, Strategies to approach high performance in Cr3+-doped phosphors for high-power NIR-LED light sources, Light: Sci. Appl., 2020, 9, 86 CrossRef CAS PubMed .
- Q. Y. Shao, H. Ding, L. Q. Yao, J. F. Xu, C. Liang and J. Q. Jiang, Photoluminescence properties of a ScBO3:Cr3+ phosphor and its applications for broadband near-infrared LEDs, RSC Adv., 2018, 8, 12035–12042 RSC .
- S. He, L. L. Zhang, H. Wu, H. J. Wu, G. H. Pan, Z. D. Hao, X. Zhang, L. G. Zhang, H. Zhang and J. H. Zhang, Efficient super broadband NIR Ca2LuZr2Al3O12:Cr3+,Yb3+ garnet phosphor for pc–LED light source toward NIR spectroscopy applications, Adv. Opt. Mater., 2020, 8, 1901684 CrossRef CAS .
- J. W. Qiao, G. J. Zhou, Y. Y. Zhou, Q. Y. Zhang and Z. G. Xia, Divalent europium-doped near-infrared-emitting phosphor for light-emitting diodes, Nat. Commun., 2019, 10, 5267 CrossRef PubMed .
- Y. Wei, P. P. Dang, Z. G. Dai, G. G. Li and J. Lin, Advances in near-infrared luminescent materials without Cr3+: crystal structure design, luminescence properties, and applications, Chem. Mater., 2021, 33, 5496–5526 CrossRef CAS .
- D. J. Liu, G. G. Li, P. P. Dang, Q. Q. Zhang, Y. Wei, L. Qiu, M. S. Molokeev, H. Z. Lian, M. M. Shang and J. Lin, Highly efficient Fe3+-doped A2BB′O6 (A = Sr2+, Ca2+; B, B′ = In3+, Sb5+, Sn4+) broadband near-infrared-emitting phosphors for spectroscopic analysis, Light: Sci. Appl., 2022, 11, 112 CrossRef CAS PubMed .
- Z. H. Zhou, X. D. Yi, P. X. Xiong, X. Y. Xu, Z. Ma and M. Y. Peng, Cr3+-free near-infrared persistent luminescence material LiGaO2:Fe3+: optical properties, afterglow mechanism and potential bioimaging, J. Mater. Chem. C, 2020, 8, 14100–14108 RSC .
- L. Xiang, X. J. Zhou, Y. J. Wang, L. Li, S. Jiang, G. T. Xiang, C. Jing, J. F. Li and L. Yao, Environmentally-friendly and low-cost Fe3+-doped broadband NIR light-emitting phosphors, J. Lumin., 2022, 252, 119293 CrossRef CAS .
- M. Z. Li, Y. H. Jin, L. F. Yuan, B. Wang, H. Y. Wu, Y. H. Hu and F. Wang, Near-infrared long afterglow in Fe3+-activated Mg2SnO4 for self-sustainable night vision, ACS Appl. Mater. Interfaces, 2023, 15, 13186–13194 CrossRef CAS PubMed .
- A. J. S. Silva, T. D. Nascimento, P. A. M. Nascimento, W. S. Silveira, I. D. S. Carvalho and M. V. D. S. Rezende, Effect of dopant concentrations on the luminescent properties of LiAl5O8:Fe phosphors, Phys. Status Solidi B, 2021, 258, 2000584 CrossRef CAS .
- W. Shu, R. F. Qiang, S. G. Xiao, X. L. Yang and J. W. Ding, Enhanced red emission in LiAl5O8:Fe3+ phosphor by B3+ doping, J. Alloys Compd., 2011, 509, 3886–3888 CrossRef CAS .
- G. C. Liu, S. Zhang and Z. G. Xia, Multi-sites energy transfer in Fe3+-doped KAl11O17 phosphor toward zero thermal quenching near-infrared luminescence, Opt. Lett., 2023, 48, 1296–1299 CrossRef CAS PubMed .
- F. Y. Zhao, H. Cai, Z. Song and Q. L. Liu, Structural confinement for Cr3+ activators toward efficient near-infrared phosphors with suppressed concentration quenching, Chem. Mater., 2021, 33, 3621–3630 CrossRef CAS .
- F. Y. Zhao, H. Cai, Z. Song and Q. L. Liu, Structural confinement toward controlling energy transfer path for enhancing near-infrared luminescence, Chem. Mater., 2021, 33, 8360–8366 CrossRef CAS .
- T. Roisnel and J. Rodríguez-Carvajal, WinPLOTR: a Windows tool for powder diffraction patterns analysis, Mater. Sci. Forum, 2001, 378, 118–123 Search PubMed .
- A. A. Belik, F. Izumi, T. Ikeda, M. Okui, A. P. Malakho, V. A. Morozov and B. I. Lazoryak, Whitlockite-related phosphates Sr9A(PO4)7 (A = Sc, Cr, Fe, Ga, and In): structure refinement of Sr9In(PO4)7 with synchrotron X-ray powder diffraction data, J. Solid State Chem., 2002, 168, 237–244 CrossRef CAS .
- R. D. Shannon, Revised effective ionic radii and systematic studies of interatomic distances in halides and chalcogenides, Acta Crystallogr., 1976, 32, 751–767 CrossRef .
- F. Qi, G. S. Tu, B. T. Tu, H. Wang, J. Zhang, W. M. Wang and Z. Y. Fu, Crystal structure and luminescence mechanism of novel Fe3+–doped Mg0.752Al2.165O4 deep red–emitting phosphors, J. Am. Ceram. Soc., 2022, 105, 5783–5792 CrossRef CAS .
- G. T. Pott and B. D. McNicol, Zero-phonon transition and fine structure in the phosphorescence of Fe3+ ions in ordered and disordered LiAl5O8, J. Chem. Phys., 1972, 56, 5246–5254 CrossRef CAS .
- X. G. Zhang, D. W. Chen, X. Chen, C. Zhou, P. C. Chen, Q. Pang and L. Y. Zhou, Broadband near-infrared luminescence from Fe3+-activated NaScSi2O6 phosphors for luminescence thermometry and night-vision applications, Dalton Trans., 2022, 51, 14243–14249 RSC .
- D. L. Dexter, A theory of sensitized luminescence in solids, J. Chem. Phys., 1953, 21, 836–850 CrossRef CAS .
- Y. Tanabe and S. Sugano, On the absorption spectra of complex ions II, J. Phys. Soc. Jpn., 1954, 9, 766–779 CrossRef CAS .
- S. S. Pedro, O. Nakamura, R. B. Barthem and L. P. Sosman, Photoluminescence and photoacoustic spectroscopies of Fe3+ in the LiGa5O8−LiGaSiO4−Li5GaSi2O8 system, J. Fluoresc., 2009, 19, 211–219 CrossRef CAS PubMed .
- J. D. Ni, Y. Chen, B. Y. Qu and L. Wang, The experimental and theoretical research on the near infrared luminescent property of KAl11O17:Fe3+ and RbAl11O17:Fe3+, Opt. Mater.: X, 2022, 16, 100212 CAS .
- F. Y. Zhao, Z. Song, J. Zhao and Q. L. Liu, Double perovskite Cs2AgInCl6:Cr3+: broadband and near-infrared luminescent materials, Inorg. Chem. Front., 2019, 6, 3621–3628 RSC .
- P. D. Rack and P. H. Holloway, The structure, device physics, and material properties of thin film electroluminescent displays, Mater. Sci. Eng., R, 1998, 21, 171–219 CrossRef .
- T. Y. Liu, H. Cai, N. Mao, Z. Song and Q. L. Liu, Efficient near–infrared pyroxene phosphor LiInGe2O6:Cr3+ for NIR spectroscopy application, J. Am. Ceram. Soc., 2021, 104, 4577–4584 CrossRef CAS .
- X.-D. Wei, L.-Y. Cai, F.-C. Lu, X.-L. Chen, X.-Y. Chen and Q.-L. Liu, Structure and luminescence of Ca2Si5N8:Eu2+ phosphor for warm white light-emitting diodes, Chin. Phys. B, 2009, 18, 3555–3562 CrossRef CAS .
- B. Klimesz, R. Lisiecki and W. Ryba-Romanowski, Oxyfluorotellurite glasses doped with neodymium and ytterbium–thermal and spectroscopic properties as well as energy transfer phenomena, J. Lumin., 2018, 199, 310–318 CrossRef CAS .
- P. I. Paulose, G. Jose, V. Thomas, N. V. Unnikrishnan and M. K. R. Warrier, Sensitized fluorescence of Ce3+/Mn2+ system in phosphate glass, J. Phys. Chem. Solids, 2003, 64, 841–846 CrossRef CAS .
- R. Ternane, M. Ferid, Y. Guyot, M. Trabelsi-Ayadi and G. Boulon, Spectroscopic properties of Yb3+ in NaYbP2O7 diphosphate single crystals, J. Alloys Compd., 2008, 464, 327–331 CrossRef CAS .
- Y. Guyot, M. Guzik, G. Alombert-Goget, J. Pejchal, A. Yoshikawa, A. Ito, T. Goto and G. Boulon, Assignment of Yb3+ energy levels in the C2 and C3i centers of Lu2O3 sesquioxide either as ceramics or as crystal, J. Lumin., 2016, 170, 513–519 CrossRef CAS .
- L. Q. Yao, Q. Y. Shao, S. Y. Han, C. Liang, J. H. He and J. Q. Jiang, Enhancing near-infrared photoluminescence intensity and spectral properties in Yb3+ codoped LiScP2O7:Cr3+, Chem. Mater., 2020, 32, 2430–2439 CrossRef CAS .
- E. T. Basore, H. J. Wu, W. G. Xiao, G. J. Zheng, X. F. Liu and J. R. Qiu, High-power broadband NIR LEDs enabled by highly efficient blue-to-NIR conversion, Adv. Opt. Mater., 2021, 9, 2001660 CrossRef CAS .
- H. Suo, C. F. Guo and T. Li, Broad-scope thermometry based on dual-color modulation up-conversion phosphor Ba5Gd8Zn4O21:Er3+/Yb3+, J. Phys. Chem. C, 2016, 120, 2914–2924 CrossRef CAS .
- T. Zheng, L. H. Zhou, X. J. Qiu, D. Yang, M. Runowski, S. Lis, P. Du and L. Luo, Er3+, Yb3+ co-doped Sr3(PO4)2 phosphors: a ratiometric luminescence thermometer based on Stark levels with tunable sensitivity, J. Lumin., 2020, 227, 117517 CrossRef CAS .
- J. P. Xue, H. M. Noh, B. C. Choi, S. H. Park, J. H. Kim, J. H. Jeong and P. Du, Dual-functional of non-contact thermometry and field emission displays via efficient Bi3+ → Eu3+ energy transfer in emitting-color tunable GdNbO4 phosphors, Chem. Eng. J., 2020, 382, 122861 CrossRef CAS .
|
| This journal is © the Partner Organisations 2023 |
Click here to see how this site uses Cookies. View our privacy policy here. 
 * and
Quanlin
Liu
* and
Quanlin
Liu