 Open Access Article
Design, synthesis and evaluation of a myricetin and nobiletin hybrid compound for alleviating hyperuricemia based on metabolomics and gut microbiota†
Yan Li‡
 abc,
Liu-Yang Pu‡
 ac,
Yayun Lid,
Guanbao Zhue and
Zhengzhi Wu*abc
aShenzhen Institute of Translational Medicine, The First Affiliated Hospital of Shenzhen University, Shenzhen Second People's Hospital, Shenzhen 518035, China. E-mail: szwzz001@163.com
bWu Zhengzhi Academician Workstation, NingBo College of Health Sciences, Ningbo 315800, China
cShenzhen Institute of Geriatrics, Shenzhen 518035, China
dHunan University of Chinese Medicine, Changsha 410208, China
eGuangxi University of Chinese Medicine, Nanning 530200, China
First published on 17th July 2023
Abstract
Hyperuricemia (HUA) is the fourth most common basic metabolic disease that can cause damage to multiple organs throughout the body. In this study, a hybrid compound consisting of myricetin and nobiletin was synthesized and its biological activity was evaluated. We named the hybrid compound MNH, and its structure was confirmed by spectroscopy. This study used serum metabolomics profiling with LC/MS and 16S rRNA gene sequencing analysis to explore the anti-HUA efficacy of MNH on a yeast paste-induced mouse model. The results showed that serum uric acid (UA), creatinine (CRE) and urea nitrogen (BUN) levels were significantly decreased after the intervention of MNH. The efficacy of MNH in lowering UA was somewhat greater than that of myricetin and nobiletin. In addition, MNH could repair the renal histopathological damage. Moreover, serum metabolomics demonstrated that MNH regulated the metabolic pathways involved in glycerophospholipid metabolism, arachidonic acid metabolism and alanine etc. Furthermore, MNH supplementation restored the composition of gut microbiota with remarkable reductions in Lactobacillus and Limosilactobacillus and significant elevations in norank_f_Muribaculaceae and Bacteroides at the genus level. Taken together, these results indicated that MNH might represent a protective effect against HUA via modulating gut microbiota and metabolomics.
Introduction
HUA is a complex metabolic disease characterized by excessive uric acid secretion or renal excretion dysfunction, resulting in the accumulation of UA in the blood. Although HUA is closely associated with gout, 85 to 90% of patients show no gout symptoms.1 HUA is also an independent risk factor for the development of kidney disease, metabolic diseases such as diabetes, dyslipidemia, and cardiovascular diseases.2,3 A recent study found that the prevalence of HUA in most regions of China showed a significant trend of increase, with the overall prevalence increasing from 11.1% in 2015–2016 to 14% in 2018–2019.4 In the United States, the prevalence of HUA in adult males and females is 21.2% and 21.6%, respectively.5 It is reported that men since the age of 35 had a higher prevalence and incidence of gout compared to women.6,7 Therefore, it is crucial and urgent for us to find effective therapies to prevent and treat HUA.The use of metabolome and microbiome has significantly contributed to the advancement of medicine and biology in recent years.8,9 There are two analytical methods, non-targeted and targeted metabolomics, which can be based on nuclear magnetic resonance (NMR) spectroscopy or MS techniques. With its comprehensive and dynamic properties, metabolomics has exhibited significant advantages in the entire understanding of the efficacy mechanism of drug.10 The gut microbiota plays an important role in cultivating host immunity, digesting food, regulating intestinal endocrine function and nerve signals, altering drug action and metabolism, removing toxins, and producing a variety of compounds that affect the host.11 Furthermore, an increasing number of studies have combined 16S rRNA amplicon sequencing and metabolomic methods to investigate the relationship between gut microbiota and circulating metabolites.12,13
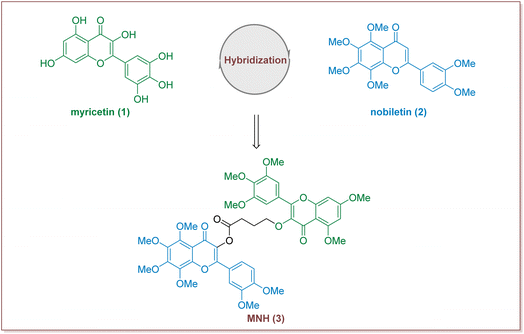
In recent years, many studies have demonstrated that Traditional Chinese medicine has obvious advantages in alleviating various clinical symptoms of HUA, preventing and treating various complications, and improving the quality of life of HUA patients.14,15 Myricetin is a common plant-derived flavonoid with a wide range of biological activities, including strong antioxidant, anticancer, anti-diabetic, anti-hyperuricemic and anti-inflammatory effects.16,17 Previous studies have also reported that myricetin supplementation decreases hepatic lipid synthesis and inflammation by modulating gut microbiota.18 Nobiletin, a natural polymethoxyfl flavonoid derived from citrus peels, has been widely reported for its beneficial effects including anti-hyperglycemia, anti-diabetic, anti-tumor, anti-inflammatory, hepatic-protective functions, as well as for its improvement of mitochondrial function and memory loss.19–22 Additional, in a rat model of hyperuricemia, orally dosed amorphous solid dispersion of nobiletin showed an improved hypouricemic effect by a 16% reduction in the plasma uric acid level compared with orally administered crystalline nobiletin.23 Although research into the synthesis and structural modification of myricetin and nobiletin has been extensively carried out, little information has been available on the synthesis of hybrid compounds consisting of myricetin and nobiletin. We have recently been interested in search for new drug candidates based on the total synthesis and modification of bioactive natural products.24–26 Herein we put forward our hypothesis that the development of new hybrid of myricetin and nobiletin to find a new compound with pharmacodynamic properties (Fig. 1).
In this study, the structure of the new compound was confirmed by spectroscopy (1H NMR, 13C NMR and HRMS spectra). We first assessed the effects of MNH, myricetin and nobiletin on HUA in yeast paste-fed mice. Subsequently, metabolomics and 16S rRNA sequencing analysis were further performed to decipher the underlying mechanisms of MNH.
Materials and methods
Reagents and chemicals
Myricetin and nobiletin (purity ≥98%) were purchased from Medbio and Lemeitian Pharmaceutical Technology Co., Ltd, respectively. UA and CRE kits were provided by Nanjing Jiancheng Institute of Biological Engineering. BUN kits were purchased from Beijing Solai Bao Technology Co., LTD. Isoflurane was purchased from Shenzhen Rayward Life Technology Co., LTD. All other chemicals and regents were of analytical grade and were purchased from Aldrich chemical Co., LTD.Synthesis of MNH
![[thin space (1/6-em)]](https://www.rsc.org/images/entities/char_2009.gif) :
:![[thin space (1/6-em)]](https://www.rsc.org/images/entities/char_2009.gif) 10
10![[thin space (1/6-em)]](https://www.rsc.org/images/entities/char_2009.gif) :
:![[thin space (1/6-em)]](https://www.rsc.org/images/entities/char_2009.gif) 1) to give the product 4 (476 mg, 45% yield) as a yellow solid. 1H NMR (400 MHz, CDCl3) δ 7.95–7.88 (m, 2H), 7.03 (d, J = 8.4 Hz, 1H), 4.12 (s, 3H), 4.04 (s, 3H), 4.00 (s, 6H), 3.97 (s, 3H), 3.96 (s, 3H). 13C NMR (101 MHz, CDCl3) δ 171.99, 151.78, 150.67, 149.02, 147.75, 147.00, 143.66, 143.12, 137.97, 137.53, 123.98, 121.17, 111.82, 111.19, 110.36, 62.46, 62.07, 61.97, 61.83, 56.11, 56.02. HRMS (m/z): calcd for C21H22NaO9+ [M + Na]+ 441.1156, found 441.1165.
1) to give the product 4 (476 mg, 45% yield) as a yellow solid. 1H NMR (400 MHz, CDCl3) δ 7.95–7.88 (m, 2H), 7.03 (d, J = 8.4 Hz, 1H), 4.12 (s, 3H), 4.04 (s, 3H), 4.00 (s, 6H), 3.97 (s, 3H), 3.96 (s, 3H). 13C NMR (101 MHz, CDCl3) δ 171.99, 151.78, 150.67, 149.02, 147.75, 147.00, 143.66, 143.12, 137.97, 137.53, 123.98, 121.17, 111.82, 111.19, 110.36, 62.46, 62.07, 61.97, 61.83, 56.11, 56.02. HRMS (m/z): calcd for C21H22NaO9+ [M + Na]+ 441.1156, found 441.1165.To the solution of the above crude product in DMF (20 mL) was added K2CO3 (1.33 g, 9.6 mmol) and Br(CH2)3CO2Et (920 μL, 6.4 mmol). The mixture was stirred at 60 °C for 12 h, then washed with H2O (50 mL) and extracted with EA (30 mL × 3). The combined organic phase was concentrated in vacuo to provide crude compound 6 which was slurried with MTBE (8 mL) to generate pure compound 6 as a white solid (769 mg, 89% yield). 1H NMR (400 MHz, CDCl3) δ 7.34 (s, 2H), 6.50 (d, J = 2.2 Hz, 1H), 6.36 (d, J = 2.2 Hz, 1H), 4.12–4.04 (m, 4H), 3.97 (s, 3H), 3.95 (s, 6H), 3.94 (s, 3H), 3.91 (s, 3H), 2.54–2.46 (m, 2H), 2.05 (dt, J = 8.2, 6.5 Hz, 2H), 1.22 (t, J = 7.1 Hz, 3H). 13C NMR (101 MHz, CDCl3) δ 174.07, 173.52, 164.13, 161.20, 158.95, 153.16, 152.77, 140.64, 140.14, 126.18, 109.59, 106.08, 95.96, 92.58, 71.51, 61.14, 60.42, 56.55, 56.50, 55.95, 31.00, 25.80, 14.34. HRMS (m/z): calcd for C26H30NaO10+ [M + Na]+ 525.1731, found 525.1745.
The intermediate 6 (394 mg, 0.75 mmol) was dissolved in THF (20 mL). To the solution was then added aq. NaOH. The mixture was stirred at room temperature for 6 h, then concentrated in vacuo to remove THF. The residue was acidified with 4 N HCl and extracted with DCM. The organic phase was dried over Na2SO4 and concentrated in vacuo to yield crude acid.
To the solution of the above acid and 4 (315 mg, 0.75 mmol) in DCM, was added EDCI (288 mg, 1.5 mmol) and DMAP (92 mg, 0.75 mmol). The solution was stirred at room temperature for 12 h. The contents were loaded directly on silica gel. The product was separated by column chromatography with EA to give the product MNH (598 mg, 91% yield) as a light yellow solid. MP 82–84 °C. 1H NMR (400 MHz, CDCl3) δ 7.57 (dd, J = 8.6, 2.1 Hz, 1H), 7.48 (d, J = 2.1 Hz, 1H), 7.36 (s, 2H), 6.98 (d, J = 8.5 Hz, 1H), 6.51 (d, J = 2.2 Hz, 1H), 6.37 (d, J = 2.3 Hz, 1H), 4.15–4.11 (m, 2H), 4.10 (s, 3H), 4.00–3.91 (m, 30H), 3.02–2.89 (m, 2H), 2.23 (p, J = 6.8 Hz, 2H). 13C NMR (101 MHz, CDCl3) δ 173.43, 170.15, 170.09, 163.53, 160.56, 158.33, 153.14, 152.58, 152.15, 151.16, 150.97, 148.44, 147.96,146.53, 143.65, 139.99, 137.37, 132.56, 125.49, 121.89, 121.62, 113.97, 110.67 (2C), 110.05, 108.95, 105.37 (3C), 95.35, 91.98, 70.61, 61.82, 61.46, 61.35, 61.21, 60.49, 55.93 (3C), 55.48 (2C), 55.34, 30.30, 25.18. HRMS (m/z): calcd for C45H46NaO18 [M + Na]+ 897.2576, found 897.2580.
Biological evaluation
![[thin space (1/6-em)]](https://www.rsc.org/images/entities/char_2009.gif) :
:![[thin space (1/6-em)]](https://www.rsc.org/images/entities/char_2009.gif) 1, v/v) containing 0.02 mg mL−1 internal standard (L-2-chlorophenylalanine) to extract metabolites. The samples were mixed by vortex for 30 s and low-temperature sonicated for 30 min (5 °C, 40 kHz) and then placed at −20 °C for 30 min to precipitate the proteins. Subsequently, the mixture was centrifuged at 13
1, v/v) containing 0.02 mg mL−1 internal standard (L-2-chlorophenylalanine) to extract metabolites. The samples were mixed by vortex for 30 s and low-temperature sonicated for 30 min (5 °C, 40 kHz) and then placed at −20 °C for 30 min to precipitate the proteins. Subsequently, the mixture was centrifuged at 13![[thin space (1/6-em)]](https://www.rsc.org/images/entities/char_2009.gif) 000g at 4 °C for 15 min, and the supernatant was collected for LC-MS/MS analysis at Majorbio Bio-Pharm Technology Co. Ltd (Shanghai, China). To ensure the entire analysis process instrument stability and reliability, a quality control (QC) sample was made by mixing and blending equal volumes of each sample from the different groups. The Thermo UHPLC-Q Exactive HF-X system equipped with an ACQUITY HSS T3 column (100 mm × 2.1 mm i.d., 1.8 μm; Waters, USA) was used to separate metabolites. The mobile phases consisted of 0.1% formic acid in water
000g at 4 °C for 15 min, and the supernatant was collected for LC-MS/MS analysis at Majorbio Bio-Pharm Technology Co. Ltd (Shanghai, China). To ensure the entire analysis process instrument stability and reliability, a quality control (QC) sample was made by mixing and blending equal volumes of each sample from the different groups. The Thermo UHPLC-Q Exactive HF-X system equipped with an ACQUITY HSS T3 column (100 mm × 2.1 mm i.d., 1.8 μm; Waters, USA) was used to separate metabolites. The mobile phases consisted of 0.1% formic acid in water![[thin space (1/6-em)]](https://www.rsc.org/images/entities/char_2009.gif) :
:![[thin space (1/6-em)]](https://www.rsc.org/images/entities/char_2009.gif) acetonitrile (95
acetonitrile (95![[thin space (1/6-em)]](https://www.rsc.org/images/entities/char_2009.gif) :
:![[thin space (1/6-em)]](https://www.rsc.org/images/entities/char_2009.gif) 5, v/v) (solvent A) and 0.1% formic acid in acetonitrile
5, v/v) (solvent A) and 0.1% formic acid in acetonitrile![[thin space (1/6-em)]](https://www.rsc.org/images/entities/char_2009.gif) :
:![[thin space (1/6-em)]](https://www.rsc.org/images/entities/char_2009.gif) isopropanol
isopropanol![[thin space (1/6-em)]](https://www.rsc.org/images/entities/char_2009.gif) :
:![[thin space (1/6-em)]](https://www.rsc.org/images/entities/char_2009.gif) water (47.5
water (47.5![[thin space (1/6-em)]](https://www.rsc.org/images/entities/char_2009.gif) :
:![[thin space (1/6-em)]](https://www.rsc.org/images/entities/char_2009.gif) 47.5
47.5![[thin space (1/6-em)]](https://www.rsc.org/images/entities/char_2009.gif) :
:![[thin space (1/6-em)]](https://www.rsc.org/images/entities/char_2009.gif) 5, v/v/v) (solvent B). The positive ion mode separation gradient was set as follows: 0–3 min, 0–20% B; 3–4.5 min, 20–35% B; 4.5–5 min, 35–100% B; 5–6.3 min, 100% B; 6.3–6.4 min, 100–0% B; 6.4–8 min, 0% B. Separation gradient in negative ion mode: 0–1.5 min, 0–5% B; 1.5–2 min, 5–10% B; 2–4.5 min, 10–30% B; 4.5–5 min, 30–100% B; 5–6.3 min, 100% B; 6.3–6.4 min, 100–0% B; 6.4–8 min, 0% B. The flow rate was 0.40 mL min−1 and the column temperature was 40 °C. The MS parameters were as follows: the electrospray ionization (ESI) source was operated in the positive and negative modes, with a scanning range of 70–1050 m/z; a source temperature of 425 °C; a sheath gas flow rate of 50 arb; an aux gas flow rate of 13 arb; an ion-spray voltage floating of −3500 V (negative) and 3500 V (positive); a normalized collision energy of 20–40–60 V for MS/MS. Full MS resolution was 60
5, v/v/v) (solvent B). The positive ion mode separation gradient was set as follows: 0–3 min, 0–20% B; 3–4.5 min, 20–35% B; 4.5–5 min, 35–100% B; 5–6.3 min, 100% B; 6.3–6.4 min, 100–0% B; 6.4–8 min, 0% B. Separation gradient in negative ion mode: 0–1.5 min, 0–5% B; 1.5–2 min, 5–10% B; 2–4.5 min, 10–30% B; 4.5–5 min, 30–100% B; 5–6.3 min, 100% B; 6.3–6.4 min, 100–0% B; 6.4–8 min, 0% B. The flow rate was 0.40 mL min−1 and the column temperature was 40 °C. The MS parameters were as follows: the electrospray ionization (ESI) source was operated in the positive and negative modes, with a scanning range of 70–1050 m/z; a source temperature of 425 °C; a sheath gas flow rate of 50 arb; an aux gas flow rate of 13 arb; an ion-spray voltage floating of −3500 V (negative) and 3500 V (positive); a normalized collision energy of 20–40–60 V for MS/MS. Full MS resolution was 60![[thin space (1/6-em)]](https://www.rsc.org/images/entities/char_2009.gif) 000, and MS/MS resolution was 7500. Data acquisition was performed with the Data Dependent Acquisition (DDA) mode. The pretreatment of LC/MS raw data was performed by Progenesis QI (Waters Corporation, Milford, USA) software. The orthogonal partial least squares discriminant analysis (OPLS-DA), heatmap analysis, and Kyoto Encyclopedia of Genes and Genomes database (KEGG) analysis were performed on a free online platform-Majorbio Cloud Platform (https://www.majorbio.com).
000, and MS/MS resolution was 7500. Data acquisition was performed with the Data Dependent Acquisition (DDA) mode. The pretreatment of LC/MS raw data was performed by Progenesis QI (Waters Corporation, Milford, USA) software. The orthogonal partial least squares discriminant analysis (OPLS-DA), heatmap analysis, and Kyoto Encyclopedia of Genes and Genomes database (KEGG) analysis were performed on a free online platform-Majorbio Cloud Platform (https://www.majorbio.com).In silico druglikeness/ADME/toxicity prediction
In silico druglikeness/ADME/toxicity studies of MNH were carried out using by preADMET online server (http://preadmet.bmdrc.org/).28,29Statistical analysis
All data were presented as mean ± SD. Statistical analysis was performed using GraphPad prism 7 software by means of one-way analysis of variance (ANOVA) followed by Dunnett's multiple comparison test. Differences were considered to be significant when P < 0.05.Results
Design of myricetin–nobiletin hybrid compound (MNH)
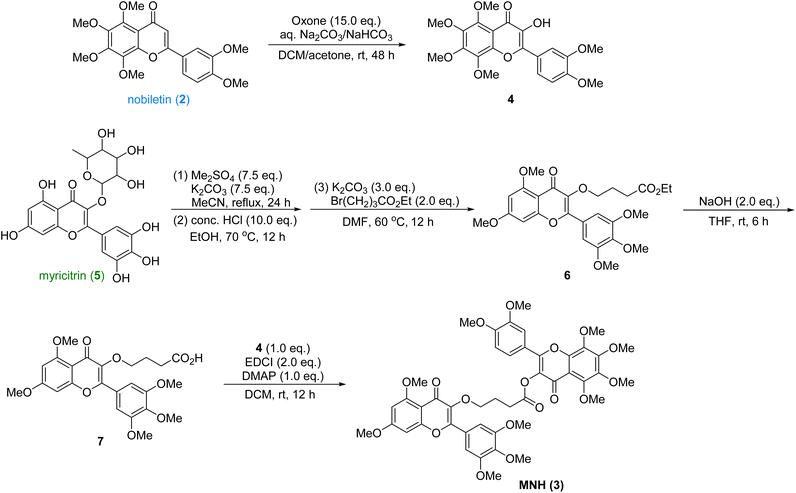
The synthetic route was shown in Scheme 1. The nobiletin (2) was introduced a hydroxyl group at the α-position of the ketone with excess oxone to provide the oxidized product 4, which was used in the final esterification step. Then the commercially available myricitrin (5) was firstly methylated with excess dimethyl sulfate and potassium carbonate. After being refluxed in MeCN for 24 h, the crude product was directly treated with HCl to afford the intermediate, which underwent a nucleophilic substitution with Br(CH2)3CO2Et to yield 6. Then the ester 6 was hydrolyzed with NaOH to yield acid, which underwent an esterification reaction with intermediate 4 to provide the new hybrid MNH (3). After crystallization and purification, the structural characterization of these products was performed by 1H NMR, 13C NMR and HRMS spectroscopy (ESI†). This synthetic route is very efficient with 5 longest linear steps and high overall yield.Effects of MNH on serum UA, CRE and BUN levels in HUA mice
The level of serum UA in different groups was measured. As displayed in Fig. 2A, compared with the Con group, there was a dramatic elevation in the serum UA level in the MD group (P < 0.001), suggesting that the yeast feed induced HUA model was successful. After treatment with MNH, myricetin and nobiletin, the UA levels were significantly decreased in contrast to the MD group (P < 0.01, P < 0.001). We also observed increased CRE and BUN in the MD group as compared with the Con group (P < 0.001) (Fig. 2B and C). MNH, myricetin and nobiletin-treated mice showed a decrease in CRE and BUN levels (P < 0.001). Surprisingly, it was found that MNH led to a greater reduction in UA and CRE levels than myricetin and nobiletin. Thus, we concluded that MNH to some extent displayed a good activity for the reduction of UA.Effects of MNH on kidney and liver index and morphological changes in HUA mice
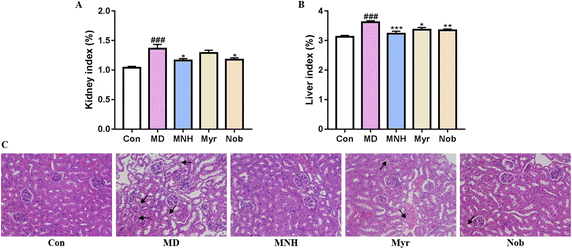
As shown in Fig. 3A and B, the yeast-induced HUA mice showed an increased kidney and liver index, which were significantly alleviated by MNH, myricetin and nobiletin (P < 0.05, P < 0.01, P < 0.001). Histological analysis showed that the glomeruli of Con group were evenly distributed and tubular epithelial cells were round and full, and there was no occlusion, expansion, atrophy, or necrosis (Fig. 3C). In the MD group, the epithelial cells of renal tubules showed edema degeneration, which was characterized by increased cell volume, loose and light staining of cytoplasm, and insufficient lumen margin. The MNH, Myr and Nob groups could improve renal injury in HUA mice to varying degrees. It can be seen that the improvement effect of MNH on renal pathological morphology is better than that of monomer drugs.MNH administration changed serum profiling in HUA mice
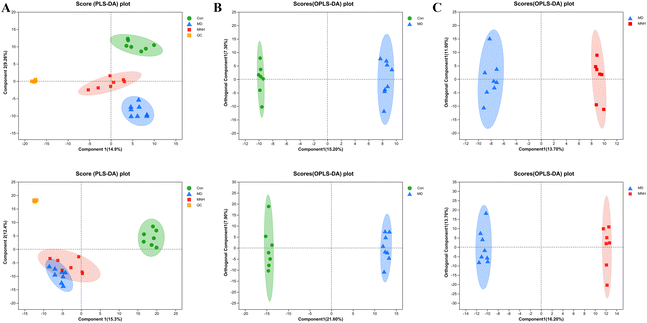
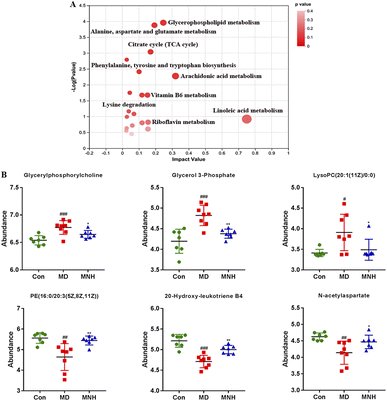
To investigate the impact of MNH on the altered metabolic pathways in HUA mice, we performed a UHPLC-MS/MS analysis of serum samples, with 7 biological repilcates in the Con and MNH group, and 8 biological repilcates in the MD group. After a series of processes, such as filtering out low-quality peaks, missing value recoding and normalization, QC verification, data conversion, a total of 7772 m/z peaks were detected in the serum metabolite data, including 3318 peaks detected by the positive ion mode and 4454 peaks detected by the negative ion mode. First of all, QC samples were closely clustered in the score plot both in the positive and negative ion models, indicating that the equipment was stable, and the method used and results obtained were reliable (Fig. 4A). The PLS-DA analysis results revealed a distinctive classification of the CON, MD and MNH groups on the positive ion mode. Moreover, a supervised OPLS-DA was applied to further distinguish the differences of the metabolite profiles between the two groups. As shown in Fig. 4B and C, the MD group could be separated from Con group apparently (ESI+: R2Y = 0.977, Q2 = 0.759; ESI−: R2Y = 0.99, Q2 = 0.884). Similarly, the MNH group could be obviously separated from the MD group (ESI+: R2Y = 0.97, Q2 = 0.704; ESI−: R2Y = 0.925, Q2 = 0.723). This showed that the OPLS-DA model was reliable, and also suggested that mouse serum metabolomics had obvious characteristics in the NC, MD and MNH groups.According to the above results, the selection of latent variables as biomarkers were based on the value of VIP greater than 1 in the OPLS-DA model, and the P value of Student's t-test was less than 0.05. Intersections of differential metabolites in the serum between MD and Con group (MD vs. Con) as well as between MNH-treated and MD group (MNH vs. MD) were shown in Fig. S1A and B (ESI†). Of the 167 up-regulated differential metabolites by treatment with MD, 65 were down-regulated by treatment with MNH compared to the MD group. Besides, of the 123 down-regulated differential metabolites by treatment with MD, 27 were up-regulated by treatment with MNH compared to the MD group. The identified data was subjected to clustering heatmap analysis in order to further understand the metabolic differences of mice in different treatment groups (Fig. S1C and D, ESI†). The heatmap directly reveals the changes of each biomarker, indicating the relative increase or decrease in value among the Con group, MD group and MNH groups. In order to probe further into the metabolic pathways responding to the administration of MNH in HUA mice, metabolic pathway enrichment analysis of the differentially expressed metabolites in serum was performed. The results showed that the interference of MNH treatment mainly included the following five metabolic pathways: linoleic acid metabolism, arachidonic acid metabolism, glycerophospholipid metabolism, alanine, aspartate and glutamate metabolism and citrate cycle (TCA cycle) (Fig. 5A). Studies have confirmed that glycerophospholipid metabolism, arachidonic acid metabolism and alanine, aspartate and glutamate metabolism may be related to the pathogenesis of hyperuricemia and gout.10 In the pathway of glycerophospholipid metabolism, the levels of glycerylphosphorylcholine, glycerol 3-phosphate and LysoPC(20:1(11Z)/0:0) in MD group were significantly increased, while the level of PE(16:0/20:3(5Z,8Z,11Z)) was decreased. After the treatment of MNH, the levels of glycerylphosphorylcholine, glycerol 3-phosphate, LysoPC(20:1(11Z)/0:0) and PE(16:0/20:3(5Z,8Z,11Z)) were significantly adjusted. Meanwhile, MNH supplementation significantly increased the levels of 20-hydroxy-leukotriene B4 and N-acetylaspartate (Fig. 5B).
MNH administration modulated gut microbiota dysbiosis in HUA mice
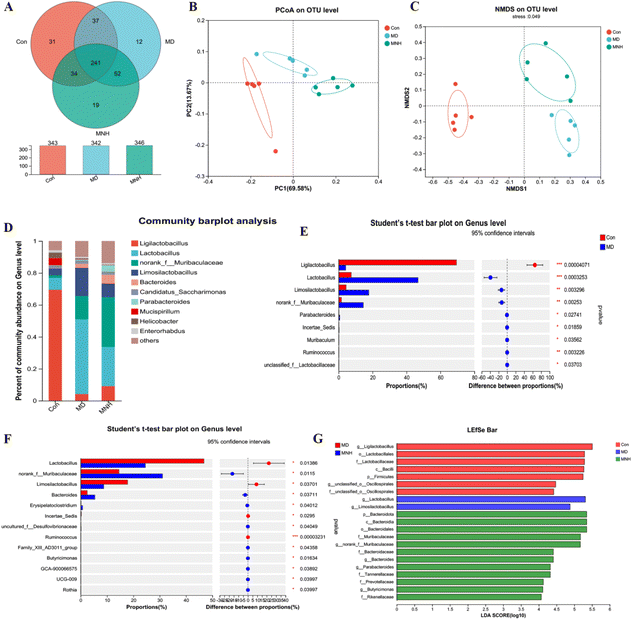
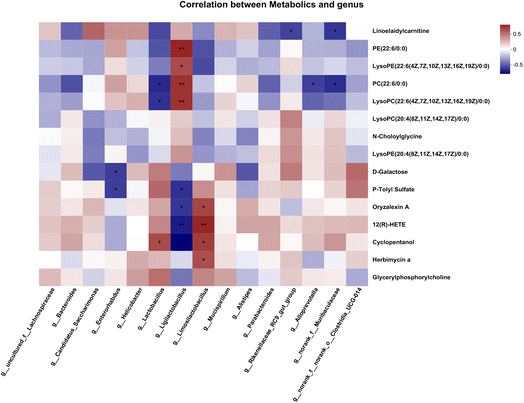
To estimate the gut microbiome in responding to MNH administration in HUA mice, the fecal microbiota was analyzed using high throughput sequencing analysis of 16S rDNA. The Venn chart shows the number of OTUs and the amount of overlap in each group, and 241 common core OTUs for three groups (Fig. 6A). PCoA and NMDS based on the beta diversity analysis showed a distinct separation among the three groups, indicating significant variability in the fecal microbiota composition and structure between these groups (Fig. 6B and C). The genus-level microbiota composition is shown in Fig. 6D. To the differences in species between groups, a t-test was performed to determine the species with significant differences (P < 0.05). As shown in Fig. 6E and F, the top 9 genera have changed significantly in the MD group compared with the Con group. After administration, the abundance of the two genera, Lactobacillus and Limosilactobacillus, may be significantly decreased. At the same time, norank_f_Muribaculaceae and Bacteroides were significantly increased by MNH treatment. Then the LefSe analyse (LDA > 4) was conducted to analyze the most differentially abundant taxa in intestinal microbiota ranging from phylum to genus as shown in Fig. 6G. The Con group was enriched with phylum Firmicutes, the family Lactobacillaceae and unclassified_o_Oscillospirales, the class Bacilli, the order Lactobacillales, as well as the genus Ligilactobacillus and unclassified_o_Oscillospirales, while the MD group was enriched with the genus Lactobacillus and Limosilactobacillus. The gut microbiota enriched in the MNH group were the phylum Bacteroidota, the class Bacteroidia, the order Bacteroidales, the family Muribaculaceae, Bacteroidaceae, Tannerellaceae, Prevotellaceae and Rikenellaceae, and the genus norank_f_Muribaculaceae, Bacteroides, Parabacteroides and Butyricimonas. The aforementioned results indicated that yeast paste feeding reduced the gut microbiota enriched in the Con group, and MNH administration increased the gut microbiota enriched in the MD group. Spearman correlation analysis was used to further analyze the association between these genera and the top 15 metabolic phenotypes. As shown in Fig. 7, Enterorhabdus was significantly negatively correlated with D-galactose and P-tolyl sulfate. Lactobacillus was significantly negatively correlated with PC(22:6/0:0) and LysoPC (22:6(4Z,7Z,10Z,13Z,16Z,19Z)/0:0), and significantly positively correlated with cyclopentanol. Ligilactobacillus was significantly positively correlated with PE(22:6/0:0), LysoPE(22:6(4Z,7Z,10Z,13Z,16Z,19Z)/0:0), PC(22:6/0:0) and LysoPC(22:6(4Z,7Z,10Z,13Z,16Z,19Z)/0:0), and significantly negatively correlated with P-tolyl sulfate, oryzalexin A, 12(R)-HETE and cyclopentanol. Limosilactobacillus was significantly positively correlated with oryzalexin A, 12(R)-HETE, cyclopentanol and herbimycin a. Alloprevotella was significantly positively correlated with PC(22:6/0:0). Norank_f_Muribaculaceae was significantly positively correlated with linoelaidylcarnitine and PC(22:6/0:0). It is suggested that the UA-lowering effects of MNH were related to these bacteria and metabolites.In silico druglikeness/ADME/toxicity studies
The MNH compound was further investigated by the PreADMET online tool, which provides information on drug-likeness, ADME and toxicity profile. As can be seen in Table 1, MNH did not follow of Lipinski “Rule of five”. And the values of MDDR like Rule and WDI like Rule were drug-like and out of 90% cut off, respectively. ADME prediction also showed that the permeability to blood–brain barrier (BBB) is in the normal range. Meanwhile, MNH has good permeability to Caco2 and high human intestinal absorption (HIA). In term of toxicity, PreADMET predicted that MNH is non-mutagen, and did not have carcinogenicity on mouse and rat.| Druglikeness/ADME/toxicitya | |
|---|---|
| ID | Value |
| a The recommended ranges for Caco2: <25 poor, >500 great, HIA: >80% is high <25% is poor, and BBB = −3.0–1.2. | |
| MDDR like rule | Drug-like |
| Rule of five | Violated |
| WDI like rule | Out of 90% cut off |
| BBB | 0.0933744 |
| Caco2 | 53.8927 |
| HIA | 99.343468 |
| Ames_test | Non-mutagen |
| Carcino_Mouse | Negative |
| Carcino_Rat | Negative |
Discussion
The formation and development of HUA are complex, which are associated with long-term purine metabolic disturbance, inflammation, oxidative stress, gut microbial imbalance, etc.3,30 Currently, there are many methods to obtain animal models of HUA, such as gene knockout (knockout of the ABCG2 gene), drug induction (potassium oxazine, hypoxanthine, adenine and other drugs) and diet induction (yeast paste diet).31,32 In the present study, we establish a yeast paste feeding induced-chronic HUA model, to carry out research on the pathogenesis and treatment target of hyperuricemia. The results indicated that yeast paste feeding for nine weeks induced formation of HUA in KM mice, which was characterized by increased UA, CRE and BUN levels, elevated kidney and liver index, pathologic lesion of kidney tissue, as well as serum metabolism and intestinal flora disorders. The results mentioned above were relieved by MNH treatment, implying the beneficial effects on the prevention of HUA. MNH decreased the levels of UA, CRE and BUN, alleviated the pathological manifestations of kidney in HUA mice. Studies have shown that high blood UA level increases the incidence of kidney disease and leads to renal dysfunction. Therefore, we examined the potential protective effect of MNH on renal injury in HUA mice.The results showed that MNH could reduce yeast paste-induced renal histopathological damage. Therefore, MNH not only effectively inhibits excessive UA accumulation, but also protects the kidneys from injury.Moreover, using an untargeted metabolomics approach on serum metabolites after nine weeks of oral MNH administration, we found that 92 differential metabolites in the intersection were significantly altered in the MNH treated mice. PLS-DA and OPLS-DA analyses also showed different serum metabolic phenotypes between MD/Con and MNH/MD. Then, differential metabolites between MNH and MD groups were clustered and annotated in KEGG pathways. Our results showed that linoleic acid metabolism, arachidonic acid metabolism, glycerophospholipid metabolism, alanine, aspartate and glutamate metabolism and citrate cycle (TCA cycle) were significantly enriched after MNH treatment. Accumulating evidence showed the complex interaction between HUA and lipid metabolism. Glycerophospholipid metabolic disorders can lead to endoplasmic reticulum stress, insulin resistance, abnormal uric acid metabolism, dyslipidemia and other metabolic abnormalities.33–35 In our study, we found that HUA significantly increased the metabolites in the glycerophospholipid metabolism, such as glycerylphosphorylcholine, glycerol 3-phosphate and LysoPC(20:1(11Z)/0:0). MNH markedly decreased aforementioned metabolites. The arachidonic acid metabolism pathway comprising 20-hydroxy-leukotriene B4 metabolites changed significantly in the three groups, which is an important regulatory step of the inflammatory response. N-Acetylaspartate (NAA), a marker of neuronal integrity that decreases in response to neuronal damage, has been shown to be lower in people with HIV compared with age-matched controls.36 Our results showed that MNH significantly increased the levels of 20-hydroxy-leukotriene B4 and N-acetylaspartate. Taken together, serum differential metabolites mentioned previously might be potential biomarkers of MNH treatment against HUA.
There is an increasing amount of evidence suggesting that the gut microbiome is a potential target for metabolic diseases, including NAFLD, HUA and obesity.37,38 In our study, PCoA and NMDS results indicated that MNH treatment can modulate the gut microbiota in HUA mice. Lactobacillus and Limosilactobacillus were screened out through 16S rRNA sequencing technology. The subsequent correlation analysis showed that differential metabolites and gut microbiota were closely related. However, previous studies have shown that some probiotic Lactobacillus strains can reduce serum uric acid levels and prevent renal changes and hypertension caused by hyperuricemia.39 In addition, Limosilactobacillus strains are a major factor in the formation of lactic acid/lactate.40 Although some inconsistency remains, a previous study has reported that patients with HUA have a microbiota distinct from that of healthy people.41 Meanwhile, previous studies also showed that the abundance of Lactobacillus was increased or reduced by a high fat diet.42–44 Some other intestinal floras including norank_f_Muribaculaceae and Bacteroides were increased by MNH treatment in our study. Therefore, these bacteria genus may play a key role in alleviating HUA and would be worth further study.
Conclusions
In the present study, based on the association principle, we designed and synthesized a hybrid compound of myricetin and nobiletin as a combined drug, which possessed potential biological activities. The method of linking the two molecules together was carried out to obtain the target product based on chemical bonding. Our results indicate that MNH can decrease UA, CRE and BUN levels in HUA mice, which may be mediated by modulating serum metabolites and the structure of the gut microbiota. Glycerophospholipid metabolism and Lactobacillus, Limosilactobacillus played an important role in MNH treatment of HUA, which indicates that MNH may become a potential agent to prevent and treat HUA.Author contributions
Yan Li: conceptualization, methodology, formal analysis, visualization, supervision and writing-original draft. Liu-Yang Pu: methodology, visualization, supervision and writing-original draft. Yayun Li: methodology and investigation, formal analysis and data curation. Guanbao Zhu: resources and investigation. Zhengzhi Wu: conceptualization, validation, writing-review & editing and funding acquisition.Conflicts of interest
The authors declare that they have no conflicts of interest.Acknowledgements
This study was financially supported by the Basic Research Project of Shenzhen Science and Technology Innovation Commission (JCYJ20220530150408018), the special key project of science and technology of Guangdong Province with strong traditional Chinese medicine (No. 20215002), Shenzhen Basic Discipline Layout Project (JCYJ20220818101806014), National Natural Science Foundation of China (No. 81803867) and Natural Science Foundation of Guangdong Province of China (2018A0303130078), Clinical research project of Shenzhen Second People's Hospital (20203357002, 2023xgyj3357005).References
- M. Dehlin, L. Jacobsson and E. Roddy, Nat. Rev. Rheumatol., 2020, 16, 380–390 CrossRef PubMed.
- H. Yin, N. Liu and J. Chen, Front. Immunol., 2022, 13, 845684 CrossRef CAS PubMed.
- H. Yanai, H. Adachi, M. Hakoshima and H. Katsuyama, Int. J. Mol. Sci., 2021, 22, 9221 CrossRef CAS PubMed.
- M. Zhang, X. Zhu, J. Wu, Z. Huang, Z. Zhao, X. Zhang, Y. Xue, W. Wan, C. Li, W. Zhang, L. Wang, M. Zhou, H. Zou and L. Wang, Front. Immunol., 2021, 12, 791983 CrossRef CAS PubMed.
- Y. Zhu, B. J. Pandya and H. K. Choi, Arthritis Rheum, 2011, 63, 3136–3141 CrossRef PubMed.
- P. Cox, S. Gupta, S. S. Zhao and D. M. Hughes, Rheumatol. Int., 2021, 41, 1209–1219 CrossRef PubMed.
- Y. M. Tang, L. Zhang, S. Z. Zhu, J. J. Pan, S. H. Zhou, T. J. He and Q. Li, Public Health, 2021, 191, 33–38 CrossRef CAS PubMed.
- L. Chen, D. V. Zhernakova, A. Kurilshikov, S. Andreu-Sanchez, D. Wang, H. E. Augustijn, A. Vich Vila, S. Lifelines Cohort, R. K. Weersma, M. H. Medema, M. G. Netea, F. Kuipers, C. Wijmenga, A. Zhernakova and J. Fu, Nat. Med., 2022, 28, 2333–2343 CrossRef CAS PubMed.
- Y. Yang, B. B. Misra, L. Liang, D. Bi, W. Weng, W. Wu, S. Cai, H. Qin, A. Goel, X. Li and Y. Ma, Theranostics, 2019, 9, 4101–4114 CrossRef CAS PubMed.
- X. Wu and C. You, PeerJ, 2023, 11, e14554 CrossRef PubMed.
- Z. Wang, Y. Li, W. Liao, J. Huang, Y. Liu, Z. Li and J. Tang, Front. Cell. Infect. Microbiol., 2022, 12, 935723 CrossRef CAS PubMed.
- R. Gao, C. Wu, Y. Zhu, C. Kong, Y. Zhu, Y. Gao, X. Zhang, R. Yang, H. Zhong, X. Xiong, C. Chen, Q. Xu and H. Qin, Gastroenterology, 2022, 163, 1024–1037 CrossRef CAS.
- Q. Qi, J. Li, B. Yu, J. Y. Moon, J. C. Chai, J. Merino, J. Hu, M. Ruiz-Canela, C. Rebholz, Z. Wang, M. Usyk, G. C. Chen, B. C. Porneala, W. Wang, N. Q. Nguyen, E. V. Feofanova, M. L. Grove, T. J. Wang, R. E. Gerszten, J. Dupuis, J. Salas-Salvado, W. Bao, D. L. Perkins, M. L. Daviglus, B. Thyagarajan, J. Cai, T. Wang, J. E. Manson, M. A. Martinez-Gonzalez, E. Selvin, K. M. Rexrode, C. B. Clish, F. B. Hu, J. B. Meigs, R. Knight, R. D. Burk, E. Boerwinkle and R. C. Kaplan, Gut, 2022, 71, 1095–1105 CrossRef CAS.
- L. Yang, B. Wang, L. Ma and P. Fu, Front. Pharmacol., 2022, 13, 971032 CrossRef CAS PubMed.
- L. Xu, L. L. Lu and J. D. Gao, J. Evidence-Based Complementary Altern. Med., 2021, 2021, 4618352 Search PubMed.
- X. Song, L. Tan, M. Wang, C. Ren, C. Guo, B. Yang, Y. Ren, Z. Cao, Y. Li and J. Pei, Biomed. Pharmacother., 2021, 134, 111017 CrossRef CAS PubMed.
- E. P. Rahmi, E. Kumolosasi, J. Jalil, K. Husain, F. Buang, A. F. Abd Razak and J. A. Jamal, Front. Pharmacol., 2020, 11, 289 CrossRef CAS.
- W. L. Sun, X. Y. Li, H. Y. Dou, X. D. Wang, J. D. Li, L. Shen and H. F. Ji, Cell Rep., 2021, 36, 109641 CrossRef CAS PubMed.
- Y. S. Lee, B. Y. Cha, S. S. Choi, B. K. Choi, T. Yonezawa, T. Teruya, K. Nagai and J. T. Woo, J. Nutr. Biochem., 2013, 24, 156–162 CrossRef CAS PubMed.
- K. Nohara, V. Mallampalli, T. Nemkov, M. Wirianto, J. Yang, Y. Ye, Y. Sun, L. Han, K. A. Esser, E. Mileykovskaya, A. D'Alessandro, C. B. Green, J. S. Takahashi, W. Dowhan, S. H. Yoo and Z. Chen, Nat. Commun., 2019, 10, 3923 CrossRef PubMed.
- H. Wang, Y. Guo, Y. Qiao, J. Zhang and P. Jiang, Mol. Neurobiol., 2020, 57, 5056–5068 CrossRef CAS.
- S. Z. Li, N. N. Zhang, X. Yang, T. Q. Huang, Y. Lin, Z. M. Jiang, Y. Yi and E. H. Liu, J. Agric. Food Chem., 2023, 71, 7312–7323 CrossRef CAS.
- T. Nihei, E. Ushiro, H. Sato and S. Onoue, Molecules, 2021, 26, 4447 CrossRef CAS PubMed.
- L. Y. Pu, Z. Li, L. Li, Y. Ma, S. Hu and Z. Wu, J. Org. Chem., 2023, 88, 4317–4324 CrossRef CAS PubMed.
- L. Y. Pu, Z. Li, F. Huang, L. Li, Y. Ma, M. Ma, S. Hu and Z. Wu, Nat. Prod. Res., 2022, 1–10 CrossRef.
- Y. Li, X. Yuan, X. Rong, Y. Gao, Z. Qiu, Z. Zhang, D. Zhou and W. Li, RSC Adv., 2016, 6, 81924–81931 RSC.
- Y. Li, S. Cai, K. He and Q. Wang, J. Chem. Res., 2014, 38, 287–290 CrossRef CAS.
- M. S. Asgari, M. Mohammadi-Khanaposhtani, M. Kiani, P. R. Ranjbar, E. Zabihi, R. Pourbagher, R. Rahimi, M. A. Faramarzi, M. Biglar, B. Larijani, M. Mahdavi, H. Hamedifar and M. H. Hajimiri, Bioorg. Chem., 2019, 92, 103206 CrossRef CAS PubMed.
- M. Askarzadeh, H. Azizian, M. Adib, M. Mohammadi-Khanaposhtani, S. Mojtabavi, M. A. Faramarzi, S. M. Sajjadi-Jazi, B. Larijani, H. Hamedifar and M. Mahdavi, Sci. Rep., 2022, 12, 10569 CrossRef CAS PubMed.
- C. Yue, C. Ying and X. Li, J. Clin. Endocrinol. Metab., 2023, 108, e480–e486 CrossRef PubMed.
- J. Lu, N. Dalbeth, H. Yin, C. Li, T. R. Merriman and W. H. Wei, Nat. Rev. Rheumatol., 2019, 15, 413–426 CrossRef.
- B. Daignan-Fornier and B. Pinson, Cells, 2019, 8, 67 CrossRef CAS PubMed.
- P. Zheng, J. Wu, H. Zhang, S. W. Perry, B. Yin, X. Tan, T. Chai, W. Liang, Y. Huang, Y. Li, J. Duan, M. L. Wong, J. Licinio and P. Xie, Mol. Psychiatry, 2021, 26, 2380–2392 CrossRef CAS PubMed.
- S. Chen, Q. Wu, L. Zhu, G. Zong, H. Li, H. Zheng, R. Zeng, X. Lin and L. Sun, Am. J. Clin. Nutr., 2021, 114, 143–153 CrossRef.
- L. You, F. Zheng, C. Su, L. Wang, X. Li, Q. Chen, J. Kou, X. Wang, Y. Wang, Y. Wang, S. Mei, B. Zhang, X. Liu and G. Xu, Environ. Int., 2022, 158, 106919 CrossRef CAS PubMed.
- T. Babikian, J. R. Alger, M. U. Ellis-Blied, C. C. Giza, E. Dennis, A. Olsen, R. Mink, C. Babbitt, J. Johnson, P. M. Thompson and R. F. Asarnow, J. Neurotrauma, 2018, 35, 1637–1645 CrossRef.
- J. Wu, K. Wang, X. Wang, Y. Pang and C. Jiang, Protein Cell, 2021, 12, 360–373 CrossRef PubMed.
- J. Wang, Y. Chen, H. Zhong, F. Chen, J. Regenstein, X. Hu, L. Cai and F. Feng, Crit. Rev. Food Sci. Nutr., 2022, 62, 3979–3989 CrossRef CAS PubMed.
- H. W. Kim, E. J. Yoon, S. H. Jeong and M. C. Park, Yonsei Med. J., 2022, 63, 241–251 CrossRef CAS PubMed.
- P. Smythe and G. Efthimiou, Microorganisms, 2022, 10, 1341 CrossRef CAS PubMed.
- J. Wei, Y. Zhang, N. Dalbeth, R. Terkeltaub, T. Yang, Y. Wang, Z. Yang, J. Li, Z. Wu, C. Zeng and G. Lei, Arthritis Rheumatol., 2022, 74, 682–691 CrossRef CAS PubMed.
- W. Song, C. Song, L. Li, T. Wang, J. Hu, L. Zhu and T. Yue, J. Food Sci., 2021, 86, 5439–5451 CrossRef CAS PubMed.
- G. Chen, D. Chen, W. Zhou, Y. Peng, C. Chen, W. Shen, X. Zeng and Q. Yuan, J. Agric. Food Chem., 2021, 69, 7581–7592 CrossRef CAS.
- F. Huang, X. Zheng, X. Ma, R. Jiang, W. Zhou, S. Zhou, Y. Zhang, S. Lei, S. Wang, J. Kuang, X. Han, M. Wei, Y. You, M. Li, Y. Li, D. Liang, J. Liu, T. Chen, C. Yan, R. Wei, C. Rajani, C. Shen, G. Xie, Z. Bian, H. Li, A. Zhao and W. Jia, Nat. Commun., 2019, 10, 4971 CrossRef PubMed.
Footnotes |
| † Electronic supplementary information (ESI) available. See DOI: https://doi.org/10.1039/d3ra03188h |
| ‡ These authors contributed equally to this work. |
| This journal is © The Royal Society of Chemistry 2023 |

