 Open Access Article
Enhanced thermoelectric performance in Bi0.5Sb1.5Te3/SiC composites prepared by low-temperature liquid phase sintering†
Bo
Zhu
abe,
Yi
Luo
a,
Haiyi
Wu
a,
Du
Sun
a,
Luo
Liu
a,
Shengcheng
Shu
c,
Zhong-Zhen
Luo
d,
Qiang
Zhang
 *b,
Ady
Suwardi
 *fg and
Yun
Zheng
 *a
*a
aKey Laboratory of Optoelectronic Chemical Materials and Devices, Ministry of Education, Jianghan University, Wuhan 430056, China. E-mail: zhengyun@jhun.edu.cn
bKey Laboratory of Interface Science and Engineering in Advanced Materials, Ministry of Education, Taiyuan University of Technology, Taiyuan 030024, China. E-mail: zhangqiang@tyut.edu.cn
cZhejiang Key Laboratory of Marine Materials and Protective Technologies, Ningbo Institute of Materials Technology and Engineering (NIMTE), Chinese Academy of Sciences, Ningbo 315201, China
dKey Laboratory of Eco-Materials Advanced Technology, College of Materials Science and Engineering, Fuzhou University, Fuzhou, 350108, China
eThe Institute of Technological Sciences, Wuhan University, Wuhan 430072, China
fInstitute of Materials Research and Engineering, Agency for Science, Technology and Research (A*STAR), Singapore 138634, Singapore. E-mail: ady_suwardi@imre.a-star.edu.sg
gDepartment of Materials Science and Engineering, National University of Singapore, Singapore 117575, Singapore
First published on 20th March 2023
Abstract
Amongst thermoelectrics, Bi2Te3 is special owing to its peak performance near room temperature, which enables it to be used for both energy harvesting and cooling. Despite extensive studies on this compound, Bi2Te3-based bulk materials are usually prepared by field-assisted sintering and hot pressing. This necessitates sophisticated equipment and tedious compositional control, both of which are undesirable for large scale applications. In this work, a low-temperature liquid phase sintering (LPS) method was employed to prepare p-type Bi0.5Sb1.5Te3/SiC composites with enhanced thermoelectric properties. In addition, a nearly two-fold increase in the power factor was observed post heat treatment at 350 °C. This can be ascribed to carrier concentration modulation due to porosity induced by heat treatment. Further addition of 0.6 vol% SiC results in a low lattice thermal conductivity of 0.33 W m−1 K−1, which can be ascribed to phonon scattering due to various defects induced by the SiC inclusion. Ultimately, a figure of merit ZT of 1.05 at 340 K was achieved for Bi0.5Sb1.5Te3/0.6 vol% SiC, 20% higher than that of the pristine sample. Moreover, an average ZT of 0.87 at 300–500 K was attained, comparable to state-of-the-art values via high-temperature processing. This work showcases the promising application of the low-temperature LPS technique for energy-efficient processing of thermoelectrics.
1. Introduction
As a type of energy material that can convert thermal energy into electricity (and vice versa), thermoelectric materials have been used in space power generation, waste heat recycling, and thermoelectric refrigeration. They can also provide a fast time response for precise temperature control. In addition, they can realize frequent thermal cycling for polymerase chain reaction (PCR)-based testing, which is especially useful for diagnosing COVID-19.1–6 Thermoelectric performance of materials can be characterized by the dimensionless figure of merit ZT, expressed as ZT = α2σΤ/(κL + κc), where α, σ, κc, κL, and Τ represent the Seebeck coefficient, electrical conductivity, carrier thermal conductivity, lattice thermal conductivity, and absolute temperature, respectively.7,8 The research of various thermoelectric materials has developed rapidly in the past century. Many state-of-the-art materials have emerged, including SnSe,9,10 PbTe,11,12 SiGe,13,14 half-Heusler alloy,15,16 skutterudite,17,18 oxides19 (such as NaCo2O4,20,21 CaMnO3,22,23 ZnO,24,25 and SrTiO3,26,27), and Zintl.28,29 Most of these materials are studied only in the laboratory and have a long way to go in terms of industrial production.30Bismuth telluride-based materials have been commercialized for a wide range of applications. To date, it is the only mature material that has reasonably good performance for both cooling and low-grade heat harvesting. At present, high-temperature melting or zone melting is usually used to synthesize (Bi,Sb)2(Te,Se)3 thermoelectric materials.31 The ZT value of either p-type or n-type is close to 1.0 at room temperature. However, traditional preparation methods take a long time, consume a lot of energy, and are not economical. Therefore, developing low temperature, low cost, high efficiency thermoelectric materials preparation methods has become a key challenge in thermoelectrics. So far, researchers have found many low-cost preparation methods on thermoelectric materials, such as the microwave method,32,33 combustion synthesis reaction combined with the plasma activated sintering process,34 and low-temperature liquid phase sintering (LPS) method.35 Our earlier work using low-temperature LPS to prepare Bi2Te3-based materials has proven successful. But the obtained ZT values remain inferior compared to those obtained for existing materials used for commercial application.35
In this work, we present a strategy to drastically improve the thermoelectric performance of LPS-synthesized Bi2Te3-based materials. By low temperature heat treatment of LPS-synthesized Bi2Te3 samples combined with SiC nanoparticle (20 nm) inclusion, a high peak ZT of 1.05 at 340 K was achieved. This value is almost two times higher compared to the ZT of 0.56 at 450 K of LPS-synthesized Bi2Te3 reported previously. Such drastic improvements in the performance can partially be ascribed to the subsequent heat treatment, which is an efficient way to control lattice defects and carrier mobility.36,37 Besides heat treatment, the inclusion of SiC nanoparticles further reduces the lattice thermal conductivity while retaining the electronic properties, further improving the ZT.38–43 Furthermore, it was also evident from this work that small SiC nanoparticle dispersion in (Bi,Sb)2Te3 materials is more effective than large nanoparticles in improving its thermoelectric performance. Overall, the two key insights derived from this work can be widely applied to other materials systems. Firstly, LPS reported in this work represents both an energetically and commercially attractive alternative to high temperature processes in thermoelectric synthesis. Secondly, unlike chemical doping, nanocomposites using small nanoparticle inclusion (i.e. SiC) can be introduced to other materials systems without severely affecting their existing chemical configuration, which subsequently affects their band structures and transport properties.
2. Experimental section
2.1 Sample preparation
In this experiment, Bi shots (99.9%, Sichuan High Purity Material Technology Co., Ltd), Sb granules (99.8%, Sichuan High Purity Material Technology Co., Ltd) and Te chunks (99.9%, Sichuan High Purity Material Technology Co., Ltd) were used as raw materials. They were weighed according to the stoichiometry of Bi0.5Sb1.5Te3 and loaded into a quartz tube. The quartz tube was then sealed under vacuum using vacuum sealing equipment (MRVS-2002, Partulab Technology Co. Ltd). The tube was then placed in a muffle furnace (VBF-1200X, Hefei Kejing Material Technology Co., Ltd) and heated to 800 °C (heating rate: 5 °C min−1) for six hours and slowly cooled to room temperature. The ingots were crushed into powders using a high-energy mixer (8000M, SPEX SamplePrep, America). The ground powders were sieved using a 500-mesh stainless steel sieve. Then Bi0.5Sb1.5Te3 powders and SiC nanoparticles with 20 nm in size were mixed by ball milling according to x vol% SiC/Bi0.5Sb1.5Te3 (x = 0, 0.1, 0.3, 0.6, 0.8, 1.0). The milling process was carried out in an argon atmosphere for 30 min. Seven-gram composite powders were weighed and blended with 1 mL deionized water to form a slurry. The slurry was consolidated into bulk materials using low temperature LPS as described in our previous work.35 The specific sintering conditions are listed below: the sintering temperature is 150 °C, the applied pressure is 240 MPa, and the holding time is 20 min. The sintered cylinder samples were then loaded into a tube furnace (VBF-1200X, Hefei Kejing Material Technology Co., Ltd) for heat treatment under continuous argon purging. The heat treatment temperature was set at 200–400 °C in order to remove the residual water and promote crystallization. The schematic diagram of the synthesis flow is shown in Fig. S1.† The densities of all bulk materials were tested by the Archimedes method, and the samples were cut into rectangular strips (12 × 4 × 2 mm3) and square pieces (6 × 6 × 2 mm3) using a diamond saw (SYJ-400 Shenyang Kejing Auto-instrument Co., Ltd).2.2 Testing and characterization
The crystal structure, grain orientation and phase composition of the bulk material were analyzed by X-ray diffraction (XRD, PANalytical X'Pert Power, Netherlands). Field emission scanning electron microscopy (FESEM, Hitachi SU8010, Japan) was used to characterize the grain microstructure and fracture morphology of the samples and was equipped with an energy dispersive spectrometer (EDS) to detect the composition. Samples were sectioned using a focused ion beam (FIB, TESCAN AMBER GMH Czech) and characterized by transmission electron microscopy (TEM, JEOL JEM ARM200F Nippon Electronics Co.). The fast Fourier transform (FFT) analysis of TEM images was performed using Gatan Digital Micrograph software. The Seebeck coefficient α and conductivity σ were simultaneously measured using commercial equipment (MRS-3 Jouleyacht, China) in a temperature range of 300–500 K. α was measured by the dynamic method and σ was measured by four-wire resistance measurement. The thermal diffusivity D was measured by laser flash analysis (LFA, Netzsch LFA-457, Germany). The thermal conductivity κ is calculated according to the formula, κ = DdCP where the sample density d is determined by the Archimedes method and the specific heat CP is measured using a differential scanning calorimeter and the three-line method (DSC, Netzsch DSC 200F3, Germany). The room temperature Hall coefficient of the sample was measured by van der Pauw's method (Jouleyacht HET, China), and the carrier concentration (p) and mobility (μH) of the material were calculated accordingly.3. Experimental results and discussion
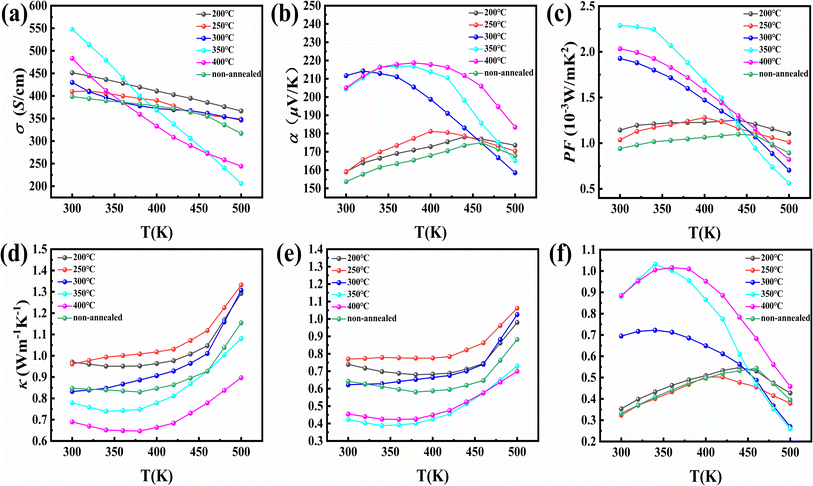
The Bi0.5Sb1.5Te3 samples heat-treated at 200–400 °C show consistent XRD patterns with that before heat treatment (Fig. S2†), well matching the reference pattern (JCPDS#49-1713). This reinforces the fact that there is no structural/phase change due to heat treatment. Fracture morphologies of Bi0.5Sb1.5Te3 materials under different heat treatment conditions are shown in Fig. S3 and S4.† It is obvious that the pores on the material surface can be clearly seen and the porosity of the sample is getting higher and higher when the heat treatment temperature is 300–400 °C at the same magnification. This is mainly because swelling or volumetric expansion has appeared on the surface of the block sample after heat treatment at 350 °C and 400 °C (as shown in Fig. S5a†), which caused a reduction in the density of the bulk sample (as shown in Table 1 and Fig. S5b and c†) and an increase in porosity. In addition, this bright field TEM image reveals that small intergranular pores are present in the heat-treated samples (as shown in Fig. S5d and e†).44–47 Meanwhile, abnormal grain growth occurs in the 250 °C treated sample compared to other samples. This indicates that the material is thermally activated (Ostwald ripening48–52) at this heat treatment temperature. Porosity and thermal activation between grains determine carrier mobility. These two factors play a competitive role in affecting carrier mobility. On the one hand, thermal activation (the grains are activated by heat treatment) reduces the interface area between the grains, which is conducive to the carrier transport process and increases the carrier mobility. Therefore, the carrier mobility begins to increase (in Table 1) when the heat treatment temperature is 250–300 °C. On the other hand, the porosity intensifies the scattering effect on the carriers, which reduces the carrier mobility. Therefore, carrier mobility shows a downward trend (Table 1). The effects of different heat treatment temperatures on the thermoelectric transport properties are shown in Fig. 1. Fig. 1a shows the variation in the temperature dependent electrical conductivity of materials with different heat treatment temperatures. The room-temperature conductivity of the sample heat-treated at 350 °C is 547.73 S cm−1, which is significantly higher than that of both the sample (398.55 S cm−1) without heat treatment and the 200 °C heat-treated sample (451.29 S cm−1). This is mainly due to its more than three times higher room temperature carrier mobility compared to that of the sample without heat treatment (as shown in Table 1). As shown in Fig. 1b, the samples heat-treated at 350 °C and 400 °C show much higher Seebeck coefficients than that before heat treatment. This is mainly because the carrier concentration is greatly reduced by heat treatment at 350 °C and 400 °C (as shown in Table 1). The decreased carrier concentration could be ascribed to strengthened carrier scattering at the pores induced by heat treatment.44,46,53,54 Moreover, the intrinsic excitation temperature of samples heat-treated at 350 °C and 400 °C is shifted to around 360 K. The power factor of the samples heat-treated at 350 °C and 400 °C is much higher than that of the sample without heat treatment and 200 °C samples prior to the intrinsic excitation (as shown in Fig. 1c). Fig. 1d shows the temperature dependent thermal conductivities of heat-treated materials. Obviously, the thermal conductivity of samples heat-treated at 350 °C and 400 °C is significantly lower than that of the sample without heat treatment and the heat-treated samples at 200 °C with regard to 350 °C. Fig. 1e shows the variation of the combined lattice and bipolar thermal conductivity κ − κe (which can be calculated by a subtraction of the electronic contribution according to the formula κL + κb = κ − κe and κe = LσT)with different heat treatment temperatures as a function of temperature. It is significantly lower than that of the sample without heat treatment and heat-treated samples at 200 °C. The minimum combined lattice and bipolar thermal conductivity of the samples heat-treated at 350 °C reaches 0.38 W m−1 K−1 at 340 K (lower than the reference value55). Fig. 1f shows the temperature dependent ZT of samples heat-treated at different temperatures. Obviously, the samples heat-treated at 350 °C or 400 °C have higher ZT values, reaching a peak value of ∼1.0 near 350 K. The average ZT values are around 0.75–0.85 for samples heat-treated at 350 and 400 °C (Fig. S6†). In summary, the optimal heat treatment temperature of low-temperature liquid phase sintered samples is within the range of 350–400 °C. It should be noted that samples heat-treated at 400 °C have poor machinability, leading to sample fracture during the cutting process and difficulty in the thermoelectric performance test. Therefore, the samples were heat-treated at 350 °C in the subsequent experiments.| Heat treatment temperature (°C) | d (g cm−3) | σ (S cm−1) | α (μV K−1) | L (10−8 W Ω K−2) | m*/m0 | p (1019 cm−3) | μ H (cm2 V−1 s−1) |
|---|---|---|---|---|---|---|---|
| Without heat treatment | 6.62 | 398.6 | 153.6 | 1.72 | 1.13 | 4.38 | 80 |
| 200 | 6.55 | 451.3 | 146.1 | 1.70 | 1.01 | 4.11 | 69 |
| 250 | 6.55 | 409.6 | 159.0 | 1.68 | 1.01 | 3.88 | 65 |
| 300 | 5.92 | 430.1 | 211.7 | 1.67 | 0.92 | 1.52 | 176 |
| 350 | 5.58 | 547.7 | 204.4 | 1.62 | 0.84 | 1.53 | 282 |
| 400 | 5.30 | 483.4 | 205.1 | 1.61 | 0.98 | 1.92 | 192 |
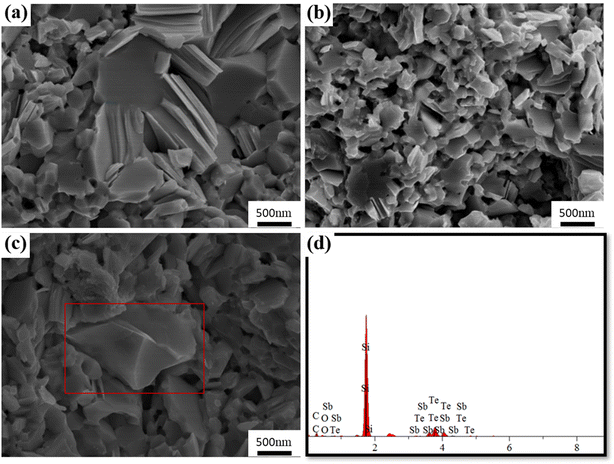
Fig. 2 shows the phase composition of Bi0.5Sb1.5Te3/SiC composite samples. All the XRD peaks of the samples correspond to the reference Bi0.5Sb1.5Te3 (JCPDS#49–1713). No additional peaks related to SiC and impurities were observed within the XRD detection limit, consistent with the minute amount of SiC. Fig. 3 presents the fracture morphology and composition of Bi0.5Sb1.5Te3/x vol% SiC (x = 0, 0.6) samples. Many lamellar crystals were observed in the cross section (Fig. 3a and b), which are expected in the layered structure of Bi2Te3-based compounds. Compared with the pristine sample, the 0.6 vol% SiC incorporated composite sample has smaller grains. This indicates that introducing SiC nanoparticles can effectively inhibit grain growth, consistent with previous reports.57Fig. 3d shows the EDS composition map of the red rectangular region in Fig. 3c where obvious Si signals were detected, indicative of the SiC existence as a separate phase. Meanwhile, EDS mapping and quantitative results of Bi0.5Sb1.5Te3/x vol% SiC (x = 0.6) sample at low magnitude (as shown in Fig. S7 and S8†). It is obvious that silicon carbide has good dispersion in the bismuth telluride matrix and the atomic ratio is also within the normal error range.
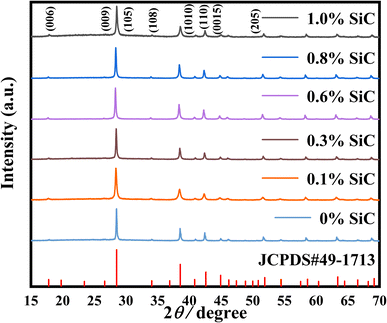 | ||
| Fig. 2 XRD patterns of Bi0.5Sb1.5Te3/x vol% SiC (x = 0, 0.1, 0.3, 0.6, 0.8, 1.0) pellet samples after heat treatment. | ||
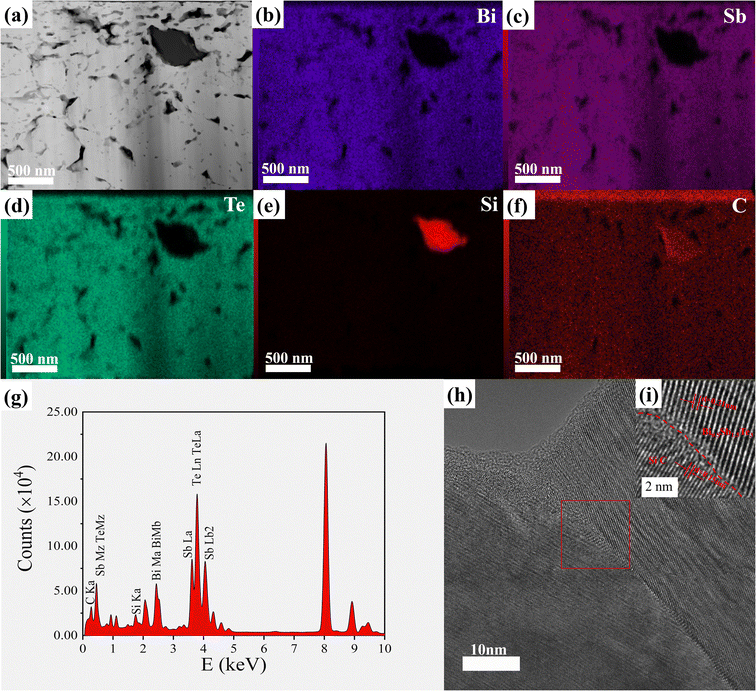
To further characterize the microstructure, transmission electron microscopy (TEM) was used to detect the defects in the crystal, such as dislocations and lattice distortion. Fig. S9a and c† show high-resolution TEM images of x = 0 and x = 0.6 samples, respectively. Evidently, Fig. S9a† shows atomic-scale dislocations and lattice distortions. Meanwhile, the inverse FFT images in Fig. S9b and d† show the dislocations and lattice distortions in the (018) for x = 0 and the (015) for x = 0.6 crystal planes, respectively. In addition, similar defects are observed in other regions of Fig. S9a and c.† These specific microstructures and defects, including high concentrations of grain boundaries, dislocations and lattice distortions, have a significant impact on electrical and thermal transport properties. These defects play an important role in inducing phonon scattering and designing low lattice thermal conductivity. Fig. 4a presents the low-magnification TEM image together with the mapping and EDS results (Fig. 4b–g) showing the SiC particles distributed in the (Bi,Sb)2Te3 matrix. The results in Fig. 4b–g show that silicon carbide has good dispersion in the BST matrix and also indicate that the Bi0.5Sb1.5Te3/xvol% SiC composite has been successfully prepared Meanwhile, clear interfaces are formed between p-type (Bi,Sb)2Te3 (as shown in Fig. 4h and i) and SiC due to their similar lattice constants which is the prerequisite for generating the energy-filtering effect.58,59
Fig. 5 shows the temperature dependent electrical and thermal transport properties of Bi0.5Sb1.5Te3/x vol% SiC (x = 0, 0.1, 0.3, 0.6, 0.8, and 1.0). The SiC incorporation decreases the carrier mobility of Bi0.5Sb1.5Te3-based materials. For example, the carrier mobilities of the x = 0 and 0.6 samples are 224 cm2 V−1s−1 and 199 cm2 V−1s−1, respectively (Table 2). When the content of silicon carbide (x < 0.6%) gradually increases, the mutual scattering between carriers caused by an increase in the carrier concentration will greatly reduce the carrier mobility. When the silicon carbide content (x ≥ 0.6%) continues to increase, the second phase scattering strengthens, which decreases the carrier concentration and increases carrier mobility. In addition, for x = 0 and 0.6 samples, their electrical conductivities reach above 500 S cm−1 at 300 K as shown in Fig. 5a, higher than those of the other composite samples. Fig. 5b shows the Seebeck coefficients of all samples as a function of temperature. The Seebeck coefficients of all samples increased with the increasing temperature, peaking at around 350 K and decreasing gradually. This is attributed to the intrinsic excitation occurring at above 350 K. The x = 0.6 sample exhibits a higher Seebeck coefficient (218.6 μV K−1) than that without SiC (204.6 μV K−1) despite their similar carrier concentrations, indicating the possible energy filtering effect induced by a small amount of SiC nanoparticles.40 The energy barriers can filter low-energy carriers, which could increase Seebeck coefficients of the samples.43 The enhanced Seebeck coefficient compensates for decreased electrical conductivity, resulting in a large power factor of 2.25 × 10⁻³ W mK−1 (ref. 2) at 300 K for the x = 0.6 sample. This is the highest value among all samples, nearly unchanged compared to pristine Bi0.5Sb1.5Te3 (Fig. 5c) despite the lower thermal conductivity. The temperature dependent thermal conductivities of samples with different SiC contents are shown in Fig. 5d. Compared to the pristine sample, all SiC-containing samples show much smaller thermal conductivities in the entire temperature range. The thermal conductivities decrease slowly, reach the minimum value at around 350 K and increase with increasing temperature. This manifests the effective role of SiC inclusion in reducing the total thermal conductivity of Bi0.5Sb1.5Te3.
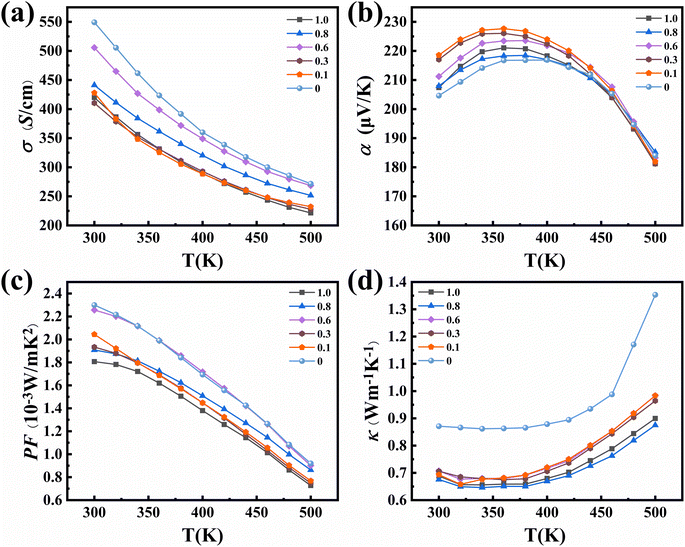 | ||
| Fig. 5 (a) Electrical conductivity, (b) Seebeck coefficient, (c) power factor, and (d) thermal conductivity of Bi0.5Sb1.5Te3/x vol% SiC (x = 0, 0.1, 0.3, 0.6, 0.8, 1.0) as a function of temperature. | ||
| xvol% SiC | d(g cm−3) | σ (S cm−1) | α (μV K−1) | L (10−8 W Ω K−2) | m*/m0 | p (1019 cm−3) | μ H (cm2 V−1 s−1) |
|---|---|---|---|---|---|---|---|
| 0 | 5.58 | 547.7 | 204.6 | 1.62 | 0.87 | 1.53 | 224 |
| 0.1 | 5.73 | 427.9 | 218.6 | 1.60 | 0.98 | 1.55 | 173 |
| 0.3 | 5.75 | 410.4 | 217.0 | 1.60 | 1.01 | 1.65 | 155 |
| 0.6 | 5.80 | 505.7 | 211.2 | 1.61 | 0.95 | 1.60 | 199 |
| 0.8 | 5.66 | 441.2 | 207.9 | 1.61 | 0.85 | 1.42 | 199 |
| 1.0 | 5.43 | 420.0 | 207.4 | 1.61 | 0.90 | 1.56 | 168 |
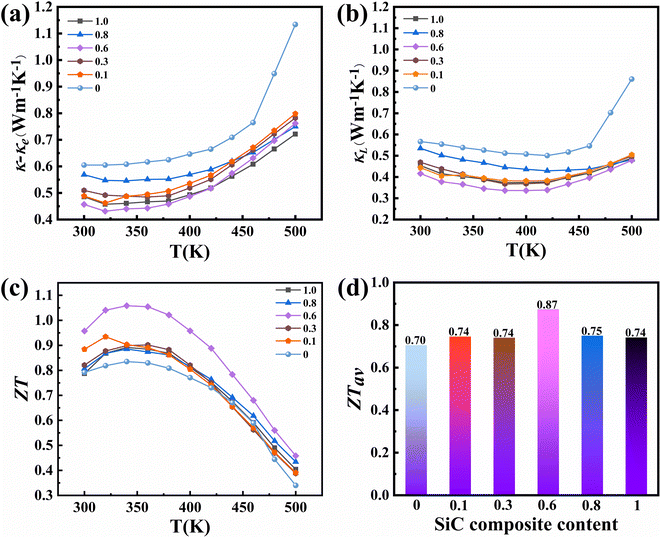
Fig. 6a shows the combined lattice and bipolar thermal conductivity (as shown in Fig. S10,† it was calculated according to the formula given in the literature60) κ − κe (which can be calculated by a subtraction of the electronic contribution according to the formula κ − κe = κL + κb and κe = LσT) of samples with different SiC contents as a function of temperature. As the temperature increases, the combined lattice and bipolar thermal conductivity gradually increases (due to bipolar diffusion). The lattice conductivities of all SiC-incorporated samples maintain the same trend (as shown in Fig. 6b), which presents a steady decrease followed by a gradual increase with increasing temperature. Compared to the other samples, the x = 0.6 sample has the lowest room-temperature lattice conductivity of 0.33 W m−1 K−1, much lower than that of the pristine sample. This is mainly ascribed to the enhanced phonon scattering by multiple scattering centers, including pores, grain boundaries, phase boundaries, dislocations and lattice distortions (as described above).44,61–64 Specifically, the low-temperature LPS method can inhibit grain growth to obtain ultra-fine grains.35 And after heat treatment at 350 °C, all samples demonstrate decreased density and improved porosity, leading to additional phonon scattering at the pores. A simplified Debye-Callaway model accounting for contributions from the grain boundaries, point defects, and SiC nanoparticles is shown in Fig. S11.† The fitting parameters were taken from ref. 65. From the modelled lattice thermal conductivity, it is evident that when 0.6% SiC is added to the matrix, further reduction in lattice thermal conductivity can be observed. At higher temperatures (above 400 K), the upturn in experimental lattice thermal conductivity can be ascribed to deviation in the bipolar and electronic thermal conductivity estimation. This supports the premise that lattice thermal conductivities are reduced in SiC-incorporated samples. Fig. 6c shows the temperature dependent ZT values of the composite samples. The x = 0.6 sample exhibits the highest ZT value over the whole temperature range among all samples, achieving a peak value of 1.05 near 340 K. This is comparable to other samples prepared by field-assisted sintering or hot pressing.5,66–68 In addition, the average ZT value of the x = 0.6 sample at 300–500 K is 0.87 (Fig. 6d), which is the highest among all samples and close to the literature value.69
In addition, in order to further reveal the advantages of low-temperature LPS, we compared the thermoelectric properties of Bi0.5Sb1.5Te3/x vol% SiC composite specimens prepared by mechanical alloying (ball milling) and spark plasma sintering (MA-SPS or BM-SPS) (Fig. 7).39,57,70 Despite having a lower peak ZT value compared to SPS samples (Fig. 7a), the LPS samples show a higher average ZT value (Fig. 7b). Compared to consolidation methods, such as SPS and hot pressing, the low-temperature LPS method is low-temperature and is cost-efficient, making it conducive to large-scale industrial production. Furthermore, this study offers follow-up optimization possibilities. (1) It is important to control the Bi/Sb ratio to achieve the optimum hole concentration, thereby enhancing ZT values in (Bi,Sb)2Te3-based materials.40,70–73 (2) Excess Te could be involved in (Bi,Sb)2Te3+x, which can reduce lattice thermal conductivity and improve carrier mobility.44,74,75 (3) Other alternative secondary inorganic phases (such as carbon nanotubes,76 FeTe2 (ref. 77) and Al2O3 (ref. 68) and conducting polymers can be considered.
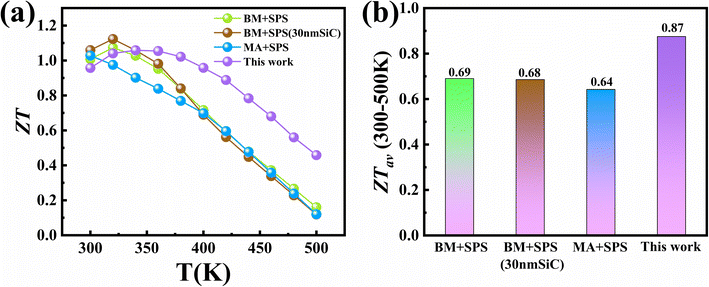 | ||
| Fig. 7 Comparison of (a) temperature dependent ZT values and (b) ZTav for Bi0.5Sb1.5Te3/SiC composites prepared by different methods. | ||
4. Conclusions and outlook
This work adopted a novel low-temperature LPS and a subsequent heat treatment process to prepare Bi0.5Sb1.5Te3/SiC composite specimens with enhanced thermoelectric properties. The results show that the additional heat treatment process at 350–400 °C is essential to boost the power factor of the as-sintered samples. Further improvements in the thermoelectric properties can be achieved by introducing a small amount of SiC nanoparticles in Bi0.5Sb1.5Te3. The SiC addition combined with suppressed grain growth and other crystal defects results in enhanced phonon scattering. The lattice thermal conductivity of the 0.6 vol% SiC composite sample is as low as 0.33 W m−1 K−1 near 340 K, contributing to a maximum ZT value of 1.05 at 340 K, comparable to the literature reports. Meanwhile, the average ZT value of this sample reached 0.87, 24% higher than that of the pristine sample. This study proves the promising role of the low-temperature LPS method in preparing (Bi,Sb)2(Te,Se)3 bulk materials with drastically enhanced thermoelectric performance.Conflicts of interest
The authors declare no competing financial interest.Acknowledgements
Y. Z. would like to acknowledge financial support from the National Natural Science Foundation of China (Grant No. 52102257) and Knowledge Innovation Program of the Wuhan-Shuguang Project (Grant No. 2022010801020375). A.S. acknowledges funding from A*STAR (Agency of Science, Technology and Research) Career Development Fund (CDF) no. C210112022.References
- J. Ding, W. Zhao, W. Jin, C.-A. Di and D. Zhu, Adv. Funct. Mater., 2021, 31, 2010695 CrossRef CAS.
- Z. Soleimani, S. Zoras, B. Ceranic, Y. Cui and S. Shahzad, Nano Energy, 2021, 89, 106325 CrossRef CAS.
- B. Qin, D. Wang, X. Liu, Y. Qin, J.-F. Dong, J. Luo, J.-W. Li, W. Liu, G. Tan, X. Tang, J.-F. Li, J. He and L.-D. Zhao, Science, 2021, 373, 556–561 CrossRef CAS PubMed.
- J. Recatala-Gomez, A. Suwardi, I. Nandhakumar, A. Abutaha and K. Hippalgaonkar, ACS Appl. Energy Mater., 2020, 3, 2240–2257 CrossRef CAS.
- J. Wei, L. Yang, Z. Ma, P. Song, M. Zhang, J. Ma, F. Yang and X. Wang, J. Mater. Sci., 2020, 55, 12642–12704 CrossRef CAS.
- H. Alam and S. Ramakrishna, Nano Energy, 2013, 2, 190–212 CrossRef CAS.
- Y. Zheng, T. J. Slade, L. Hu, X. Y. Tan, Y. Luo, Z.-Z. Luo, J. Xu, Q. Yan and M. G. Kanatzidis, Chem. Soc. Rev., 2021, 50, 9022–9054 RSC.
- X. Yang, C. Wang, R. Lu, Y. Shen, H. Zhao, J. Li, R. Li, L. Zhang, H. Chen, T. Zhang and X. Zheng, Nano Energy, 2022, 101, 107553 CrossRef CAS.
- A. Banik and K. Biswas, Joule, 2019, 3, 636–638 CrossRef CAS.
- Z.-G. Chen, X. Shi, L.-D. Zhao and J. Zou, Prog. Mater. Sci., 2018, 97, 283–346 CrossRef CAS.
- C. Wang, X. Zhao, S. Ning, Q. Tao, Y. Tang, Z. Chen, J. Wu, X. Su and X. Tang, Mater. Today Energy, 2022, 25, 100962 CrossRef CAS.
- B. Jia, Y. Huang, Y. Wang, Y. Zhou, X. Zhao, S. Ning, X. Xu, P. Lin, Z. Chen, B. Jiang and J. He, Energy Environ. Sci., 2022, 15, 1920–1929 RSC.
- I. Donmez Noyan, G. Gadea, M. Salleras, M. Pacios, C. Calaza, A. Stranz, M. Dolcet, A. Morata, A. Tarancon and L. Fonseca, Nano Energy, 2019, 57, 492–499 CrossRef.
- K. Xie and M. C. Gupta, J. Alloys Compd., 2020, 820, 153182 CrossRef CAS.
- M. Mitra, A. Benton, M. S. Akhanda, J. Qi, M. Zebarjadi, D. J. Singh and S. J. Poon, Mater. Today Phys., 2022, 28, 100900 CrossRef CAS.
- M. M. Mallick and S. Vitta, J. Mater. Chem. A, 2018, 6, 14709–14716 RSC.
- Z.-Y. Liu, J.-L. Zhu, X. Tong, S. Niu and W.-Y. Zhao, J. Adv. Ceram., 2020, 9, 647–673 CrossRef CAS.
- S. El Oualid, I. Kogut, M. Benyahia, E. Geczi, U. Kruck, F. Kosior, P. Masschelein, C. Candolfi, A. Dauscher, J. D. Koenig, A. Jacquot, T. Caillat, E. Alleno and B. Lenoir, Adv. Energy Mater., 2021, 11, 2100580 CrossRef CAS.
- Y. Yin, B. Tudu and A. Tiwari, Vacuum, 2017, 146, 356–374 CrossRef CAS.
- Y. A. Shah, M. J. Iqbal, K. Rasool, A.-u.-R. Makhdoom, Y. Iqbal, A. Ullah and M. Habib, Appl. Phys. A: Solids Surf., 2020, 126, 376 CrossRef CAS.
- E. M. Jakubczyk, A. Mapp, C. C. Chung, C. L. Sansom, J. L. Jones and R. A. Dorey, J. Alloys Compd., 2019, 788, 91–101 CrossRef CAS.
- T. Chen, J. Wang, X. Wang, H. Wang, W. Su, J. Zhai, F. Mehmood, M. Khan and C. Wang, Appl. Mater. Today, 2022, 29, 101557 CrossRef.
- Z. Shi, S. Tong, J. Wei, Y. Guo, Y. Zhang, L. Wang and J. Zhang, ACS Appl. Mater. Interfaces, 2022, 14, 32166–32175 CrossRef CAS PubMed.
- S. Sulaiman, S. Izman, M. B. Uday and M. F. Omar, RSC Adv., 2022, 12, 5428–5438 RSC.
- W. Lee, S. Lee, H. Kim and Y. Kim, Chem. Eng. J., 2021, 415, 128935 CrossRef CAS.
- X.-L. Shi, H. Wu, Q. Liu, W. Zhou, S. Lu, Z. Shao, M. Dargusch and Z.-G. Chen, Nano Energy, 2020, 78, 105195 CrossRef CAS.
- Q.-Q. Fu, H. Gu, J.-J. Xing, Z. Cao and J. Wang, Acta Mater., 2022, 229, 117785 CrossRef CAS.
- N. Tomitaka, Y. Goto, K. Morino, K. Hoshi, Y. Nakahira, H. Ito, A. Miura, H. Usui and Y. Mizuguchi, J. Mater. Chem. A, 2021, 9, 26362–26370 RSC.
- L. Borgsmiller and G. J. Snyder, J. Mater. Chem. A, 2022, 10, 15127–15135 RSC.
- Z.-Z. Luo, S. Cai, S. Hao, T. P. Bailey, H. Xie, T. J. Slade, Y. Liu, Y. Luo, Z. Chen, J. Xu, W. Luo, Y. Yu, C. Uher, C. Wolverton, V. P. Dravid, Z. Zou, Q. Yan and M. G. Kanatzidis, J. Am. Chem. Soc., 2022, 144, 7402–7413 CrossRef CAS PubMed.
- Y. Zheng, X. Y. Tan, X. Wan, X. Cheng, Z. Liu and Q. Yan, ACS Applied Energy Materials, 2020, 3, 2078–2089 CrossRef CAS.
- C. S. Birkel, W. G. Zeier, J. E. Douglas, B. R. Lettiere, C. E. Mills, G. Seward, A. Birkel, M. L. Snedaker, Y. Zhang, G. J. Snyder, T. M. Pollock, R. Seshadri and G. D. Stucky, Chem. Mater., 2012, 24, 2558–2565 CrossRef CAS.
- L. Wang, R. Zhang, L. Bo, F. Li, Y. Hou, M. Zuo and D. Zhao, JOM, 2022, 74, 4250–4257 CrossRef CAS.
- G. Zheng, X. Su, T. Liang, Q. Lu, Y. Yan, C. Uher and X. Tang, J. Mater. Chem. A, 2015, 3, 6603–6613 RSC.
- B. Zhu, X. Su, S. Shu, Y. Luo, X. Y. Tan, J. Sun, D. Sun, H. Zhang, Q. Zhang, A. Suwardi and Y. Zheng, ACS Applied Energy Materials, 2022, 5, 2002–2010 CrossRef CAS.
- Z.-L. Wang, T. Araki, T. Onda and Z.-C. Chen, J. Mater. Sci., 2018, 53, 9117–9130 CrossRef CAS.
- J. Li, C. Zhang, Y. Feng, C. Zhang, Y. Li, L. Hu, W. Ao and F. Liu, J. Alloys Compd., 2019, 808, 151747 CrossRef CAS.
- H. Liu, Z. Guo, X. Duan, X. Yuan and Q. Gao, J. Electron. Mater., 2022, 51, 516–521 CrossRef CAS.
- B. Cai, J. Pei, J. Dong, H.-L. Zhuang, J. Gu, Q. Cao, H. Hu, Z. Lin and J.-F. Li, Sci. China Mater., 2021, 64, 2551–2562 CrossRef CAS.
- D. Zhang, J. Lei, W. Guan, Z. Ma, C. Wang, L. Zhang, Z. Cheng and Y. Wang, J. Alloys Compd., 2019, 784, 1276–1283 CrossRef CAS.
- Y. Pan, U. Aydemir, F.-H. Sun, C.-F. Wu, T. C. Chasapis, G. J. Snyder and J.-F. Li, Adv. Sci., 2017, 4, 1700259 CrossRef PubMed.
- M. G. Kanatzidis, Chem. Mater., 2010, 22, 648–659 CrossRef CAS.
- M. S. Dresselhaus, G. Chen, M. Y. Tang, R. G. Yang, H. Lee, D. Z. Wang, Z. F. Ren, J. P. Fleurial and P. Gogna, Adv. Mater., 2007, 19, 1043–1053 CrossRef CAS.
- I. T. Witting, J. A. Grovogui, V. P. Dravid and G. J. Snyder, J. Materiomics, 2020, 6, 532–544 CrossRef.
- T. Hamachiyo, M. Ashida and K. Hasezaki, J. Electron. Mater., 2009, 38, 1048–1051 CrossRef CAS.
- C. C. Zhang, X. A. Fan, J. Hu, C. P. Jiang, B. Feng, Q. S. Xiang, G. Q. Li and Y. W. Li, Adv. Eng. Mater., 2016, 18, 1777–1784 CrossRef CAS.
- K. Zhao, H. Duan, N. Raghavendra, P. Qiu, Y. Zeng, W. Zhang, J. Yang, X. Shi and L. Chen, Adv. Mater., 2017, 29, 1701148 CrossRef PubMed.
- Q. Liu, Q. Liu, Y. Wu, R. Zeng, F. Xing, C. Cheng, H. Qiu and C. Huang, Nano Res., 2022, 15, 6695–6704 CrossRef CAS.
- Y. Dong, D. Zhang, D. Li, H. Jia and W. Qin, Sci. China Mater., 2023, 66, 1249–1255 CrossRef.
- D. An, J. Wang, J. Zhang, X. Zhai, Z. Kang, W. Fan, J. Yan, Y. Liu, L. Lu, C.-L. Jia, M. Wuttig, O. Cojocaru-Mirédin, S. Chen, W. Wang, G. J. Snyder and Y. Yu, Energy Environ. Sci., 2021, 14, 5469–5479 RSC.
- Y.-J. Kim, L.-D. Zhao, M. G. Kanatzidis and D. N. Seidman, ACS Appl. Mater. Interfaces, 2017, 9, 21791–21797 CrossRef CAS PubMed.
- M. Li, Y. Liu, Y. Zhang, C. Chang, T. Zhang, D. Yang, K. Xiao, J. Arbiol, M. Ibáñez and A. Cabot, Chem. Eng. J., 2022, 433, 133837 CrossRef CAS.
- Y. Gu, X. Liu, S. Huang, J. Guo, P. Bi, J. Shi, W. Zheng, Z. Wang and R. Xiong, Ceram. Int., 2018, 44, 21421–21427 CrossRef CAS.
- C. Nagarjuna, P. Dharmaiah, J.-H. Lee, K. B. Kim, G. Song, J. K. Lee and S.-J. Hong, J. Alloys Compd., 2021, 881, 160499 CrossRef CAS.
- Y. Zheng, Q. Zhang, X. Su, H. Xie, S. Shu, T. Chen, G. Tan, Y. Yan, X. Tang, C. Uher and G. J. Snyder, Adv. Energy Mater., 2015, 5, 1401391 CrossRef.
- K. H. Lee, S.-i. Kim, J.-C. Lim, J. Y. Cho, H. Yang and H.-S. Kim, Adv. Funct. Mater., 2022, 32, 2203852 CrossRef CAS.
- D.-W. Liu, J.-F. Li, C. Chen and B.-P. Zhang, J. Electron. Mater., 2011, 40, 992–998 CrossRef CAS.
- S. Jo, S. H. Park, H. W. Ban, D. H. Gu, B.-S. Kim, J. H. Son, H.-K. Hong, Z. Lee, H.-S. Han, W. Jo, J. E. Lee and J. S. Son, J. Alloys Compd., 2016, 689, 899–907 CrossRef CAS.
- J. Yang, L. Xi, W. Qiu, L. Wu, X. Shi, L. Chen, J. Yang, W. Zhang, C. Uher and D. J. Singh, npj Comput. Mater., 2016, 2, 15015 CrossRef CAS.
- H.-s. Kim, K. H. Lee, J. Yoo, J. Youn, J. W. Roh, S.-i. Kim and S. W. Kim, Materials, 2017, 10, 763 CrossRef PubMed.
- C. Hu, K. Xia, C. Fu, X. Zhao and T. Zhu, Energy Environ. Sci., 2022, 15, 1406–1422 RSC.
- J. He, S. N. Girard, J.-C. Zheng, L. Zhao, M. G. Kanatzidis and V. P. Dravid, Adv. Mater., 2012, 24, 4440–4444 CrossRef CAS PubMed.
- Z. Chen, X. Zhang and Y. Pei, Adv. Mater., 2018, 30, 1705617 CrossRef PubMed.
- Z. Chen, Z. Jian, W. Li, Y. Chang, B. Ge, R. Hanus, J. Yang, Y. Chen, M. Huang, G. J. Snyder and Y. Pei, Adv. Mater., 2017, 29, 1606768 CrossRef PubMed.
- H. S. Kim, S. I. Kim, K. H. Lee, S. W. Kim and G. J. Snyder, Phys. Status Solidi B, 2017, 254, 1600103 CrossRef.
- M. Gao and D. M. Rowe, Meas. Sci. Technol., 2001, 12, 1261 CrossRef.
- J. Mao, Z. Liu, J. Zhou, H. Zhu, Q. Zhang, G. Chen and Z. Ren, Adv. Phys., 2018, 67, 69–147 CrossRef.
- Q. Shi, J. Li, X. Zhao, Y. Chen, F. Zhang, Y. Zhong and R. Ang, ACS Appl. Mater. Interfaces, 2022, 14, 49425–49445 CAS.
- M. Maksymuk, B. Dzundza, O. Matkivsky, I. Horichok, R. Shneck and Z. Dashevsky, J. Power Sources, 2022, 530, 231301 CrossRef CAS.
- B. Cai, H.-L. Zhuang, Q. Cao, H. Hu, J. Dong, Asfandiyar and J.-F. Li, ACS Appl. Mater. Interfaces, 2020, 12, 16426–16435 CrossRef CAS PubMed.
- J. Li, Q. Tan, J.-F. Li, D.-W. Liu, F. Li, Z.-Y. Li, M. Zou and K. Wang, Adv. Funct. Mater., 2013, 23, 4317–4323 CrossRef CAS.
- Z. Guo, K. Song, Z. Yan, P. Sun, X. Tan, G. Wu, Q. Zhang, G.-Q. Liu, B. Yu and J. Jiang, Chem. Eng. J., 2021, 426, 131853 CrossRef CAS.
- C. Zhang, H. Ng, Z. Li, K. A. Khor and Q. Xiong, ACS Appl. Mater. Interfaces, 2017, 9, 12501–12510 CrossRef CAS PubMed.
- Y. Pan, Y. Qiu, I. Witting, L. Zhang, C. Fu, J.-W. Li, Y. Huang, F.-H. Sun, J. He, G. J. Snyder, C. Felser and J.-F. Li, Energy Environ. Sci., 2019, 12, 624–630 RSC.
- R. Deng, X. Su, Z. Zheng, W. Liu, Y. Yan, Q. Zhang, V. P. Dravid, C. Uher, M. G. Kanatzidis and X. Tang, Sci. Adv., 2018, 4, eaar5606 CrossRef PubMed.
- Y. Zhang, X. Jia, H. Sun, B. Sun, B. Liu, H. Liu, L. Kong and H. Ma, J Materiomics, 2016, 2, 316–323 CrossRef.
- W. H. Shin, J. W. Roh, B. Ryu, H. J. Chang, H. S. Kim, S. Lee, W. S. Seo and K. Ahn, ACS Appl. Mater. Interfaces, 2018, 10, 3689–3698 CrossRef CAS PubMed.
Footnote |
| † Electronic supplementary information (ESI) available: See DOI: https://doi.org/10.1039/d2ta09850d |
| This journal is © The Royal Society of Chemistry 2023 |

