DOI:
10.1039/D4TA05985A
(Paper)
J. Mater. Chem. A, 2024,
12, 30810-30820
Tracking the active phase and reaction pathway of the OER mediated by an MnMoO4 microrod electro(pre)-catalyst†
Received
24th August 2024
, Accepted 11th October 2024
First published on 14th October 2024
Abstract
MnMoO4 is a barely explored material for the electrocatalytic oxygen evolution reaction (OER) and in situ tracking of the reactive intermediates and final active species during the OER in an alkaline pH lacks a sequential study. Herein, in situ spectroscopic and ex situ microscopic studies unravel a pH-dependent [MoO4]2− dissolution from MnMoO4 with a kobs of 4.5 s−1 to form α-MnO2 followed by a subsequent potential-driven anodic transformation into δ-MnO2. The electrochemically derived δ-MnO2 delivers a fairly stable current density (15 mA cm−2) at 1.55 V (vs. RHE) for over 24 h. However, a thermally stable mixed-phase α/δ-MnO2 species evolved during the OER with dominant MnIII content and remains highly reactive towards OER with an overpotetial (η10) at 333 K of 239 mV. Temperature-dependent OER study provides a unimolecular reaction order for [OH]− and an anodic transfer coefficient (αa) of 0.7. A low activation barrier of 9.77 kJ mol−1 and a high exchange current density (j0) of 0.095 mA cm−2 prove that the improved OER activity on α/δ-MnO2 is due to fast electro-kinetics. DFT study on the (2![[1 with combining macron]](https://www.rsc.org/images/entities/char_0031_0304.gif) 6) surface of the δ-MnO2 concluded that the dissociation of the *O–H bond to form the *O is the rate-limiting step for the OER and the *O intermediate is stabilized by a weak O–O interaction (1.4 Å) with lattice-oxygen before forming a hydroperoxide intermediate. Herein, in situ tracking of the reactive phases generated from the MnMoO4 pre-catalyst, detailed electro-kinetics, and the theoretical study help to unravel the OER mechanism.
6) surface of the δ-MnO2 concluded that the dissociation of the *O–H bond to form the *O is the rate-limiting step for the OER and the *O intermediate is stabilized by a weak O–O interaction (1.4 Å) with lattice-oxygen before forming a hydroperoxide intermediate. Herein, in situ tracking of the reactive phases generated from the MnMoO4 pre-catalyst, detailed electro-kinetics, and the theoretical study help to unravel the OER mechanism.
Introduction
The surface reconstruction of metal chalcogenides, pnictides, perovskites, spinels, multimetallic hydroxides, etc., under alkaline and oxidative conditions is inevitable,1–4 and these electro(pre)catalysts undergo potential-driven hydrolytic anion leaching to evolve the reactive metal oxide phase.5 The negative enthalpy of formation of the metal oxide makes the in situ electro-modification of the pre-catalysts thermodynamically achievable.6 However, the chemical composition, electronic or lattice structure, nature of the electrolyte, amplitude and polarity of the applied bias are the determining factors regulating the extent of structure dissolution.1,7 Under OER conditions, ionic lattices are expected to readily decompose, and bulk alteration is often observed.8,9 Despite metal-sulfides possessing some degree of covalency, surface structure and atomic arrangements in the lattice play an intriguing role in the surface or bulk reconstruction during the OER.10 However, the in situ formed amorphous or polycrystalline metal-oxide/metal-(oxy)hydroxide overlayer on the pristine material leads to a reactive hetero-structure, which shows more reactivity as compared to the ex situ prepared oxidic phase.7 Establishing a connection between the chemical composition and structural factors responsible for the reconstruction of pre-catalysts during electrocatalysis is challenging. In this context, to identify the reconstruction mechanism and interpret the intrinsic electrocatalytic performance, in situ tracking of the surface reconstruction of the electro(pre)catalyst is of utmost importance. In the quest to identify the reactive phase, in situ or time-resolved spectroscopic and microscopic techniques have recently been utilized.11
Manganese-based electrocatalysts have gained considerable attention since an Mn4CaO5 cubane cluster behaves as the reactive site for the OER in Photosystem II (PSII).12 Mn being non-precious, redox-active, and stable in a wide range of pH,13,14 numerous Mn-based electrocatalysts have been developed over the past years for the OER in acidic, neutral, or basic media.15–18 Simultaneously, significant experimental and theoretical studies have been performed to decipher the active sites of MnOx catalysts.19,20 Menezes et al.14,21–24 reported several Mn-based electrocatalysts like MnS, LiMn borophosphate (LiMnBPO), MnGa4, and Mn3N2 that undergo in situ transformation into catalytically active MnOx phases under alkaline oxidative conditions (Table S1†). Recently, Liu and coworkers reported the phase transition of Mn3O4 to delta MnO2 during water oxidation in aqueous electrolyte.25 The in situ derived δ-MnO2 has a similar geometrical and electronic structure to the PSII system and has been shown to exceed the activity in comparison to the synthetic MnO2 polymorphs (α (tetragonal), β (tetragonal), δ-MnO2 (triclinic)), which show poor activity during alkaline OER (overpotential > 0.6 V@pH < 7).25–27 The OER study on Mn(Ca) oxide by Zaharieva et al. revealed that at OER potentials, some fraction of MnIII is still present along with the catalytically dormant MnIV state. These MnIII sites behave as the actual active sites during the OER.28 In alkaline pH, MnII and MnIV comproportionate to form MnIII, which is likely to be stabilized by metal oxo bonds.29 Rao and coworkers highlighted that the t2g3 eg1 electronic configuration in an octahedral MnIII results in the elongation of the Mn–O axial bond due to the Jahn–Teller distortion.30 Since the eg orbital of transition metal (TM) ions participates in σ-bonding with anionic intermediates during the OER/ORR, the electron distribution in the eg orbital significantly affects the catalytic activity of the active centre.31,32 Mn-based heterometallic catalysts outperform the MnOx phases since the proximity of two metal centres lowers the energy barrier for redox changes and hence, the catalytic reaction. In this context, Mo is an electron-rich and redox-active metal which can provide better conductivity to the catalyst and can be suitably doped in the lattice due to comparable ionic radius (Mn2+ (0.82 Å) and Mo6+ (0.7 Å)).33 Moreover, at neutral pH, Mo6+ exists as the molybdate anion ([MoO4]2−), which upon combining with the 3d-TM, forms the stable MMoO4 inorganic lattice.34
MnMoO4 has been considered herein as an anode material to study the electrochemical OER and to understand the underlying reaction mechanism. The alkaline surface/bulk reconstruction of MnMoO4 is inevitable,8 and the identification of the true catalytic phase evolved from the MnMoO4 pre-catalyst is a subject of investigation that has not been pondered upon in the literature (Table S1†). In this study, the sequential transformation of MnMoO4 was studied using quasi-in situ Raman analysis, and the formed intermediates were microscopically/spectroscopically validated. Furthermore, the effect of potential bias and the duration of electrolysis has been analysed during the in situ transformation of MnMoO4 into the catalytically active MnO2 phase. A detailed electro-kinetic and DFT study has been done to obtain the intrinsic parameters, which eventually helped unravel the OER mechanism.
Results and discussion
Synthesis and characterization of MnMoO4 nanorods
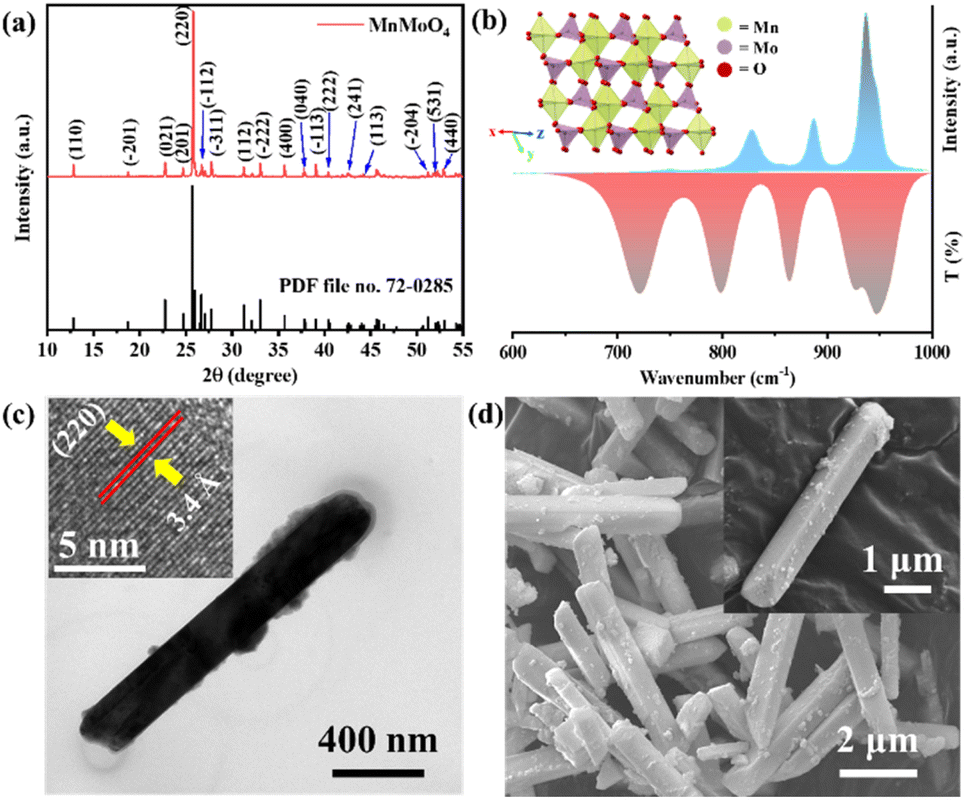
MnMoO4 nanorods were prepared via co-precipitation followed by solvothermal heating of a 1![[thin space (1/6-em)]](https://www.rsc.org/images/entities/char_2009.gif) :1 mixture of MnCl2·4H2O and Na2MoO4·2H2O in ethylene glycol (EG) and water. EG solvent acted as a surfactant and controlled the growth of the MnMoO4 nanoparticles.8 The sharp peaks of the PXRD diffractogram verified the crystallinity of MnMoO4, which can be well indexed according to JCPDS file no. 72-0285. The PXRD also indicated the formation of the stable monoclinic α-MnMoO4 phase with a space group of C2/m (Fig. 1a). A single unit cell of MnMoO4 is composed of four crystallographically independent Mn atoms surrounded by six oxygen atoms adopting distorted octahedral geometry, and six crystallographically independent Mo atoms surrounded by four oxygen atoms adopting a partially distorted tetrahedral geometry (Fig. 1b, inset and S1†).35
:1 mixture of MnCl2·4H2O and Na2MoO4·2H2O in ethylene glycol (EG) and water. EG solvent acted as a surfactant and controlled the growth of the MnMoO4 nanoparticles.8 The sharp peaks of the PXRD diffractogram verified the crystallinity of MnMoO4, which can be well indexed according to JCPDS file no. 72-0285. The PXRD also indicated the formation of the stable monoclinic α-MnMoO4 phase with a space group of C2/m (Fig. 1a). A single unit cell of MnMoO4 is composed of four crystallographically independent Mn atoms surrounded by six oxygen atoms adopting distorted octahedral geometry, and six crystallographically independent Mo atoms surrounded by four oxygen atoms adopting a partially distorted tetrahedral geometry (Fig. 1b, inset and S1†).35
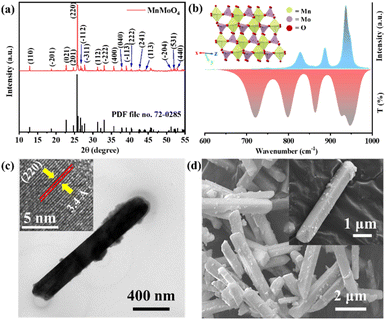 |
| | Fig. 1 (a) Powder X-ray diffractogram and (b) Raman and FTIR spectra of the as-synthesized MnMoO4 powder. (c) High-resolution TEM image of a single MnMoO4 nanorod (inset: HRTEM image and atomic fringes for (220) planes), (d) FESEM image of MnMoO4 nanorods (inset: single nanorod). | |
Along the X–Z plane, the individual atomic layers are composed of [MnIIO6]oh and [MoVIO4]Td units, alternatively interconnected through ([MnO5]-μ2-O-[MoO3]) linkages (Fig. S1†). In the 3-D lattice, each [MnIIO6]oh unit shares its corners with six [MoVIO4]Td units through ([MnO5]-μ2-O-[MoO3]) linkages while two edges are adjoined to a surrounding [MnIIO6]oh unit. This unique lattice arrangement of MnMoO4 gives rise to the major Raman active vibrations at 930 and 949 cm−1, corresponding to the Ag mode of the symmetric stretching of Mo–O bond in [MoVIO4]Td units. Other prominent bands at 878 and 818 cm−1 are associated with the Ag and Bg modes of Mo–O vibration, respectively (Fig. 1b).36 α-MnMoO4 exhibits IR-active Au/Bu active vibrations at 715, 790, 863, and 936 cm−1 (Fig. 1b).37 The 936 cm−1 band corresponds to the stretching vibration of the Mo–O bond. The 868 cm−1 band is attributed to the bending vibration of the Mo–O–Mo group. The peaks at 724 and 799 cm−1 are characteristic bands of the Mo–O stretching vibration of [MoVIO4]Td units. Transmission electron microscopic (TEM) images showed MnMoO4 nanorods with an average length of 4.5 μm and width of ca. 1 μm (Fig. 1c and S2a†). The high-resolution TEM (HRTEM) images of a single nanoparticle provided an inter-planar distance of 3.4 Å that corresponds to the d-spacing of the (220) planes of the MnMoO4 nanocrystal (Fig. 1c inset and S2b†). The selected area electron diffraction (SAED) pattern also displayed well-resolved diffraction rings for the (110), (−311), (−133), and (440) planes, proving the crystallinity of the synthesized material (Fig. S2c†). The bulk morphology of the nanoparticles from the field emission scanning electron microscopic (FESEM) image also appeared to be rod-like, having a homogeneous distribution of Mo, Mn, and O over the surface of the material, as seen in the elemental mapping from FESEM-energy dispersive X-ray (EDX) (Fig. 1d and S3†) analysis. The SEM-EDX elemental ratio analysis also confirmed the presence of Mn and Mo in an atomic ratio of 1:1 (Fig. S3†). Additionally, ICP-MS also confirmed the Mo:Mn to be 1.01 in the bulk sample (Table S2†).
Electrocatalytic transformation of MnMoO4 on Ni foam
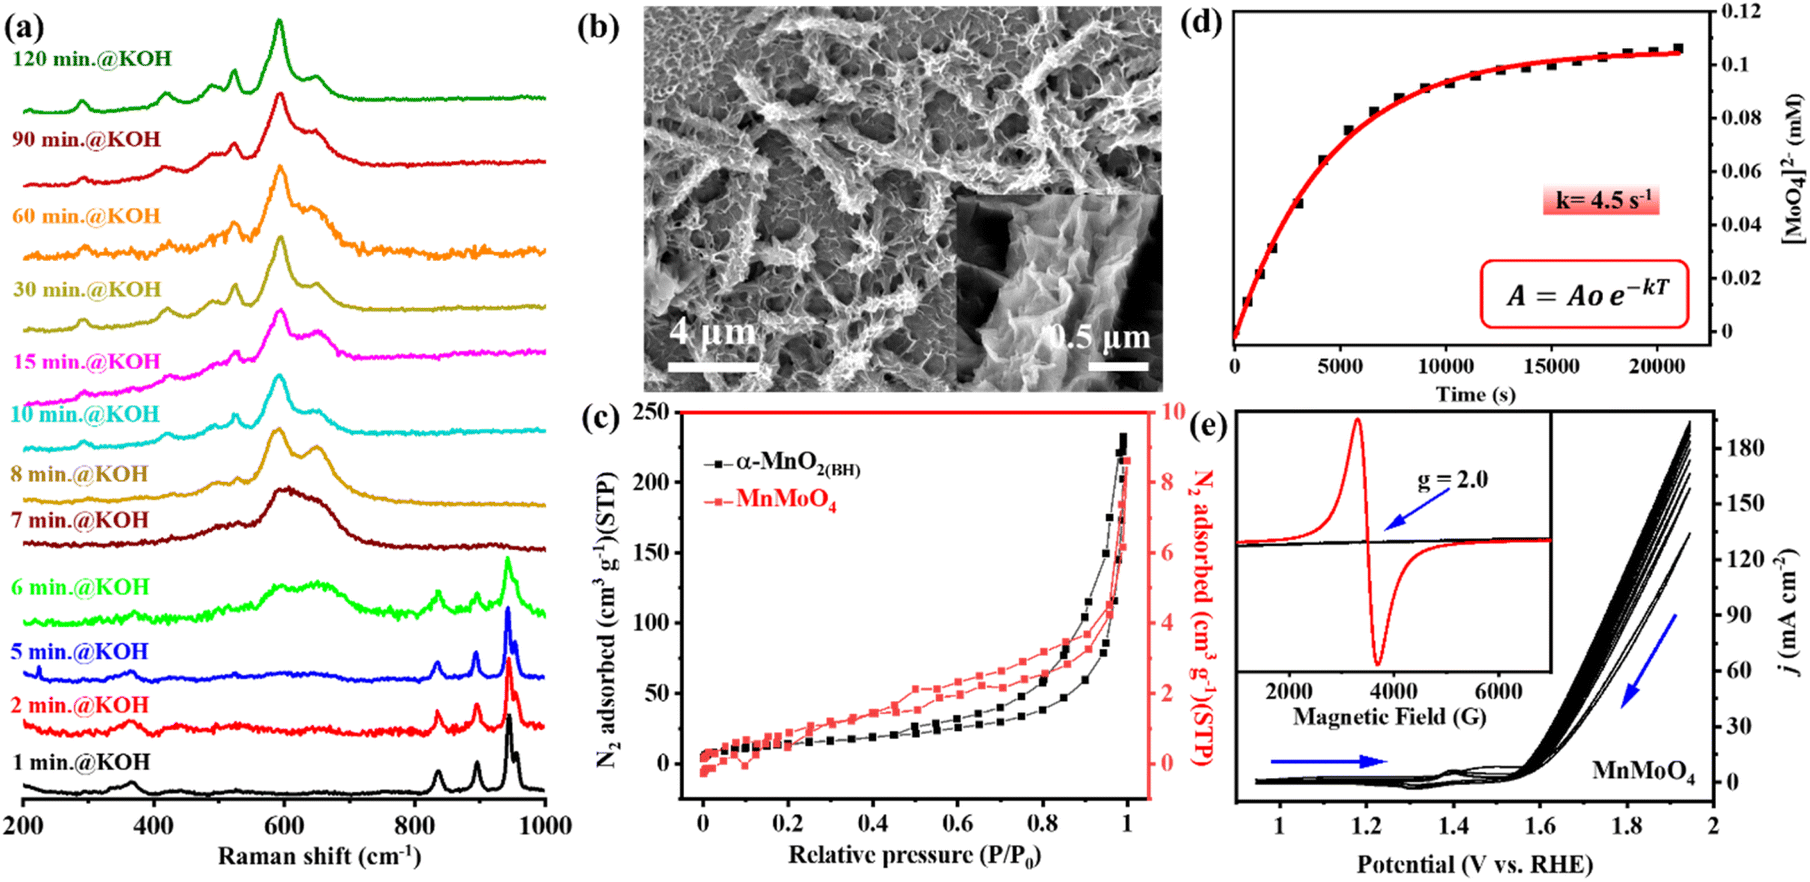
In alkaline pH, the in situ catalytic reconstruction of 3d metal molybdates have been reported earlier.8,38 Herein, the structural transformation of MnMoO4 during electrochemical OER was studied through quasi-in situ Raman spectroscopy and other micro/spectroscopic techniques. The as-synthesized MnMoO4 was deposited on nickel foam (MnMoO4/NF) to study the catalyst transformation and the electrochemical OER performance. Upon exposing the MnMoO4/NF to alkaline (1 M KOH) conditions without potential bias, the catalyst commences to reconstruct after ∼6 min of stirring, changing completely to α-MnO2(BH) (BH = base hydrolysis) after 8 min. This α-MnO2(BH) phase remained stable in the basic solution for up to 2 h (120 min) (Fig. 2a). The FE-SEM image after 2 h clearly showed the ruptured and chipped surface of the nanorod, accompanied by the decrement in the surface concentration of Mo by 91.6% (Fig. 2b, S4, and S5†). Due to the surface roughening of nanoparticles, the anticipated increase in the surface area was validated by the N2 adsorption–desorption isotherms at 77 K. The BET surface area of α-MnO2(BH) was found to be 67.94 m2 g−1, which is much higher than that of the as-synthesized MnMoO4 (4.1 m2 g−1) (Fig. 2c). The corresponding pore size distribution of the α-MnO2(BH) and MnMoO4 from Barrett–Joyner–Halenda (BJH) analysis shows the existence of mesopores (Fig. S6†). Notably, the pore volume of the α-MnO2(BH) (0.32 cm3 g−1) is larger than that of as-synthesized MnMoO4 (0.012 cm3 g−1). Furthermore, the X-band EPR data of α-MnO2(BH) and as-synthesized MnMoO4 were examined at room temperature. The MnMoO4 material revealed the g values of 2.0, typical of high-spin Mn2+ complexes, while for α-MnO2(BH) (Mn4+), no EPR band could be observed (Fig. 2e inset). The surface dissolution of [MoO4]2− was further validated by studying the in situ UV-vis spectra of the electrolyte at different times of alkaline hydrolysis of MnMoO4. The results were compared with a calibration curve made from the standard [MoO4]2− solution, hence, the amount of Mo leaching from the catalyst was determined with time (Fig. S7a and b†). The increasing magnitude of the absorption peak (∼230 nm) represents the increasing concentration of [MoO4]2− species in the electrolyte, and the [MoO4]2− dissolution follows a pseudo-first-order kinetics (Fig. 2d). A saturation in the [MoO4]2− was attained after approx. 120 min, with a rate constant (kobs) of 4.5 s−1, signifying a base-induced loss of molybdate from the MnMoO4 surface (Fig. 2d and S7c†).34 After 350 min of KOH exposure, ca. 57% of Mo leached from the catalyst surface. Hitherto, the major catalyst transformation happens in the alkaline electrolyte.
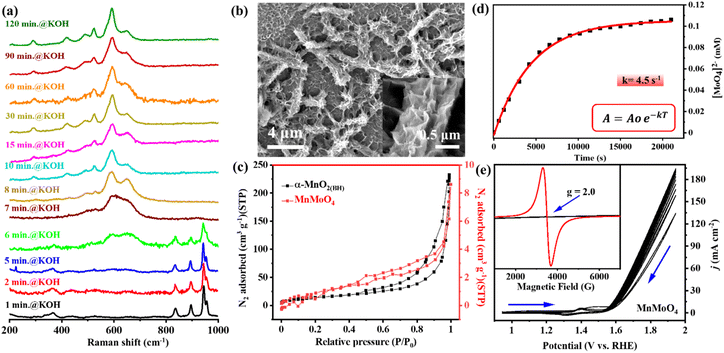 |
| | Fig. 2 (a) Time-resolved quasi-in situ Raman spectra of MnMoO4/NF in an alkaline electrolyte. (b) FESEM images of α-MnO2(BH)/NF after 2 h stirring in 1 M KOH. (c) N2 adsorption/desorption isotherm of α-MnO2(BH)/NF after 2 h stirring in 1 M KOH. (d) Change in [MoO4]2− concentration in the electrolyte with time on exposing MnMoO4/NF to 1 M KOH, monitored via UV-vis spectroscopy. (e) Cyclic voltammograms (non-iR corrected, scan rate: 5 mV s−1) recorded with MnMoO4/NF. Inset: EPR spectra of as-prepared MnMoO4 and α-MnO2(BH)/NF after 2 h stirring in 1 M KOH. | |
The cyclic voltammetry (CV) scans were recorded in a potential window of 0.89–1.95 V (vs. RHE) at a scan rate of 5 mV s−1 in a three-electrode setup (MnMoO4/NF as the working electrode, graphite rod (GR) as the counter electrode, and Hg/HgO/(1 M NaOH) as the reference electrode) (Fig. 2e). In the CV cycles of MnMoO4/NF, the prominent redox peaks appear due to the NF, while those corresponding to the MnII/MnIV transition remain concealed due to their lower intensity. The Raman spectrum of α-MnO2(BH)/NF after 10 CV cycles showed a further change in the structure, and the additional Raman bands corresponding to δ-MnO2 can be seen in coexistence with the bands for α-MnO2. Hence, a mixed α/δ-MnO2(EE) (EE = electrochemically evolved) intermediate phase is formed under the influence of potential (Fig. 3a). After a 12 h chronoamperometric (CA) analysis at a constant potential of 1.54 V (vs. RHE), the α/δ-MnO2(EE) completely transformed into δ-MnO2(EE), as evident from the Raman analysis (Fig. 3a). In situ generation of δ-MnO2 from spinel Mn3O4 has been previously observed by Liu and coworkers.25 The FTIR spectra of MnMoO4 after different activations also showed the gradual transformation into MnO2 (Fig. S8†). Likewise, the PXRD of the catalyst after 60 min, 120 min, and 10 CV cycles also shows the initial formation of α-MnO2(BH) and its gradual transformation into α/δ-MnO2(EE), finally converting to δ-MnO2(EE) after 12 h OER-CA at a fixed potential of 1.54 V (vs. RHE) which corresponds to a catalytic current of 10 mA (Fig. 3b and c) (Fig. S9†). The FE-SEM image of a nanorod after 12 h CA@1.54 V (vs. RHE) shows an even more prominent degradation of particles with a decrement in Mo concentration by 97.3% (Fig. 3c inset, S10 and S11†). The catalyst's transformation was further inferred from the HRTEM image of the nanoparticles, which showed a ruptured surface, while the SAED pattern indicated the amorphous nature of the in stiu formed δ-MnO2(EE) (Fig. 3d and S12†). Consistent with the ICP-MS analyses of the electrolyte before and after potential-driven transformation, it is evident that corrosion of the catalyst starts at the surface, forming the amorphous MnO2 upon close contact with KOH and proceeds to the bulk during electrolysis (Table S2†). Nevertheless, major catalyst transformation is complete during the treatment with 1 M KOH without potential bias, while the phase change of the active catalyst to δ-MnO2(EE) occurs only after applying the potential. The change in the valence state of the Mn during transformation was further validated through the XPS study (Fig. S13†). The binding energy values obtained in the core-level Mn 2p XP spectrum of as-synthesized MnMoO4 indicate the presence of a divalent MnII state.39 For the catalyst powder isolated from δ-MnO2(EE)/NF after 12 h OER-CA, the XP spectrum could be resolved into three components, which shows some residual MnII along with the increased concentration of MnIV (δ-MnO2(EE)) (Fig. 3e). The existence of intermediate MnIII could also be seen along with the MnIV state. The deconvoluted core-level Mo 3d XP spectrum of MnMoO4 also revealed distinct spin–orbit components Mo 3d5/2 and Mo 3d3/2, which correspond to MoVI in MnMoO4 (Fig. 3f),40 whereas the post-catalytic sample isolated from NF after 12 h OER-CA showed the significant loss of Mo from the catalyst surface (Fig. 3f). The deconvolution of the core level O 1s spectra in both samples can be well attributed to O2− of the lattice oxygen of MnMoO4 in addition to some chemisorbed water and non-equivalent hydroxyl groups at the surface of the catalyst (Fig. S14†).41
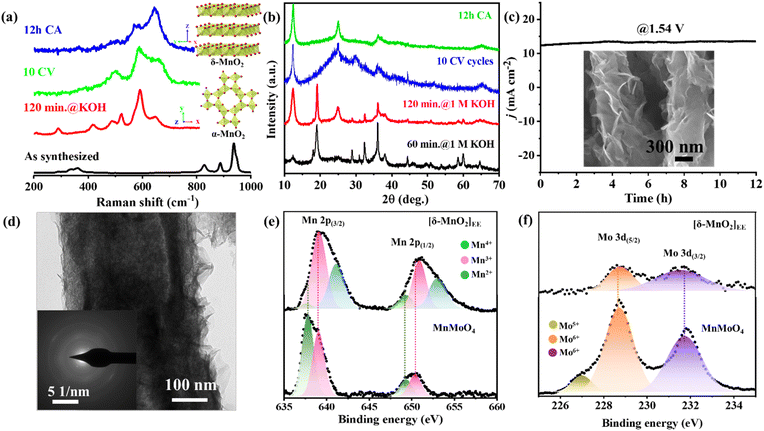 |
| | Fig. 3 (a) Raman spectra of the MnMoO4/NF electrode under different potential biases (inset: the lattice structure of anticipated in situ derived species). (b) PXRD of the catalyst sample isolated from MnMoO4/NF during different activations. (c) Long-term constant potential electrolysis of MnMoO4/NF (inset: FESEM images of the catalyst isolated from MnMoO4/NF after 12 h OER-CA). (d) HRTEM image of the catalyst isolated from MnMoO4/NF after 12 h OER-CA (inset: SAED pattern with apparently no diffractions). The core-level (e) Mn 2p and (f) Mo 3d XP spectra before and after 12 h OER-CA showing the change in oxidation state and concentration of the metal ions. | |
Temperature-dependent OER and electrokinetic study
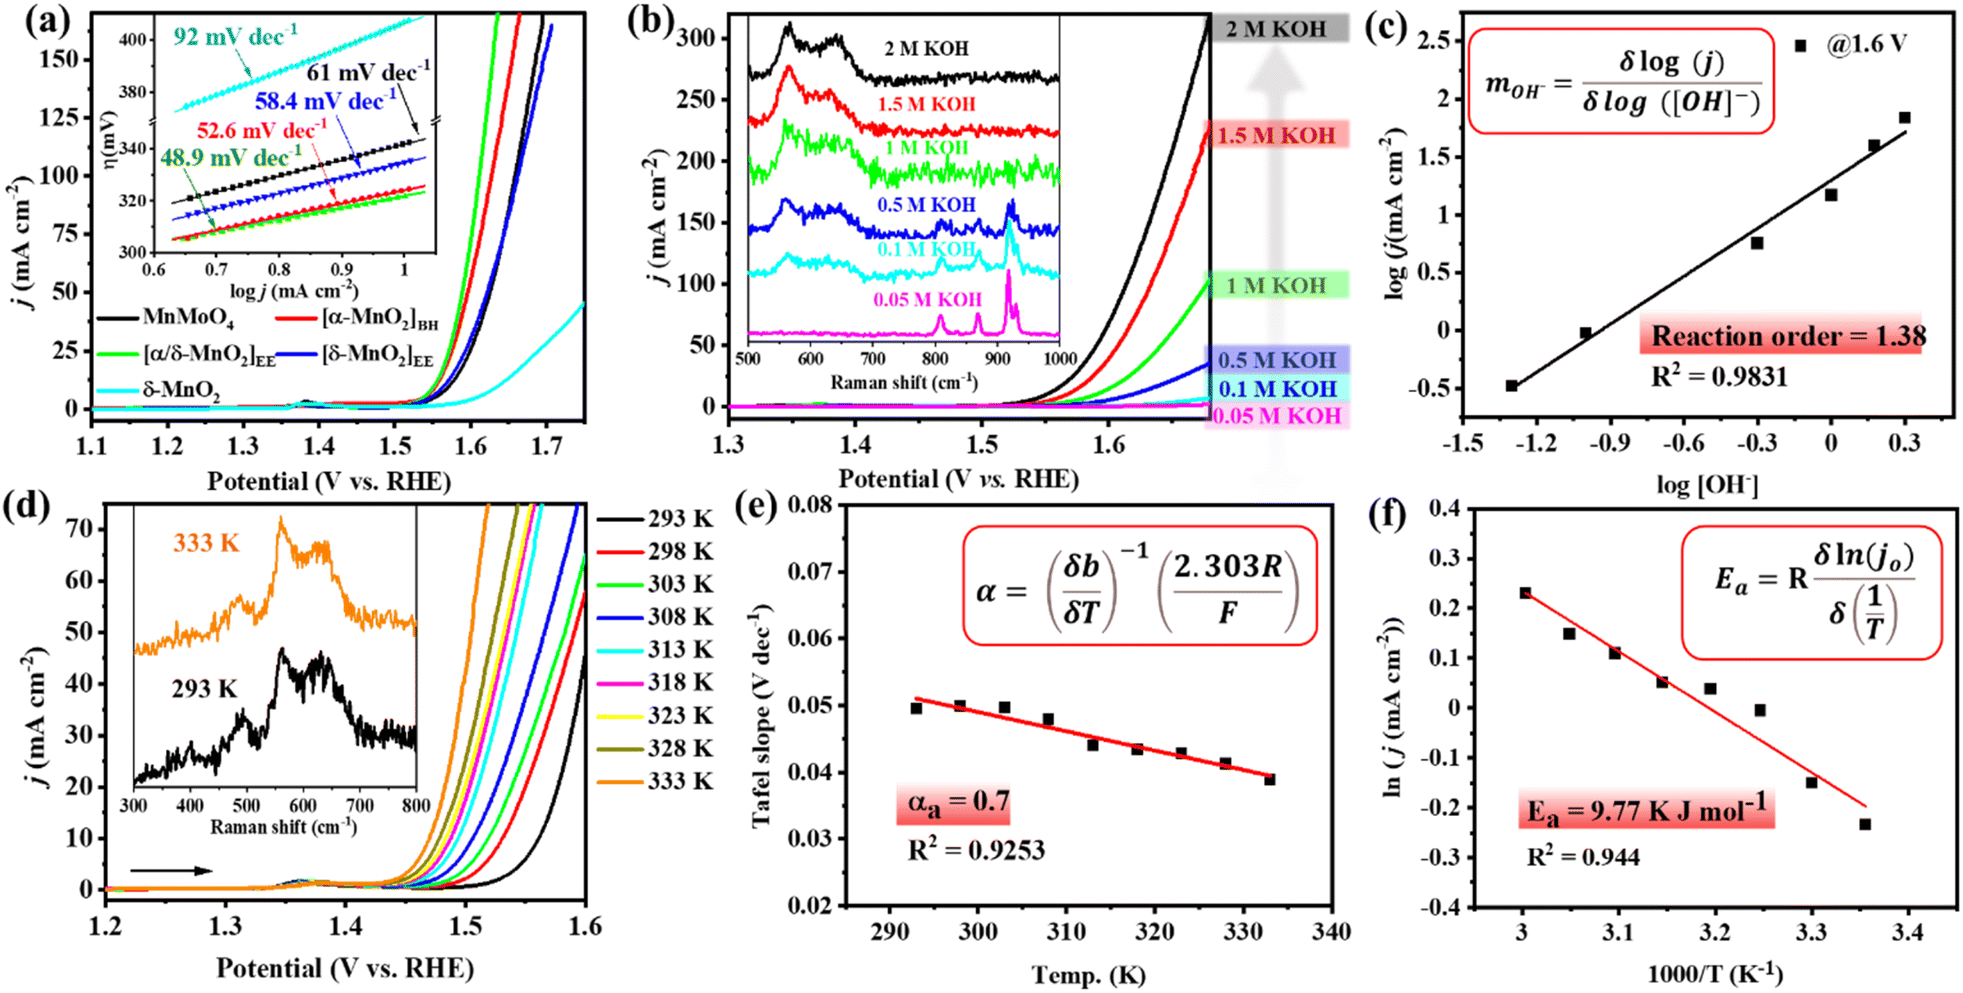
To see the effect of in situ formed catalytic phases of MnO2, i.e., α-MnO2(BH) (after 2 h alkaline stirring), α/δ-MnO2(EE) (after 10 CV cycles), and δ-MnO2(EE) (after 12 h anodic bulk electrolysis), on the electrochemical performance of the material, the OER activity of the formed phases was compared with that of the as-prepared MnMoO4, ex situ prepared δ-MnO2, and bare NF (Fig. 4a, S15 and S16a†). The LSV polarization curve of the anodic scan with α/δ-MnO2(EE)/NF (as the working electrode (WE)) displayed the best activity with a catalytic current density (j) between 1.52 and 1.64 V (vs. RHE) (eqn (S1)†), reaching a maximum of 194 mA cm−2 at 1.64 V (vs. RHE) indicating an electrocatalytic OER. The α/δ-MnO2(EE)/NF phase showed a fair OER activity with an overpotential (η) of 321 mV@10 mA cm−2 current density and surpassed the activity of the reference materials tested herein under the same testing conditions (Fig. 4a). The turnover frequencies (TOFs) of the different in situ formed phases were further evaluated at a fixed overpotential considering the mole number of Mn present per cm2 NF surface (eqn (S4)†). The TOFs at 350 mV overpotential for MnMoO4, α-MnO2(BH), α/δ-MnO2(EE), δ-MnO2(EE), and δ-MnO2 were found to be 0.538 s−1, 1.21 s−1, 1.43 s−1, 0.67 s−1 and 0.094 s−1, respectively (Fig. S16b†). A low Tafel slope close to 40 mV dec−1 for α/δ-MnO2(EE)/NF further determines the faster electron transfer and mass transfer kinetics at the electrode–electrolyte junction (eqn (S2)† and Fig. 4a inset).42 The Tafel slope or the kinetics of the reaction is comparable to the bulk Ru-based catalysts.43 The electrochemical impedance spectroscopy (EIS) study was done to see the charge transfer resistance (Rct) of different in situ formed catalytic phases of MnO2. The corresponding Nyquist plots show the comparable Rct for α-MnO2(BH) and α/δ-MnO2(EE) with a resistance of 1.92 and 1.84 Ω, respectively (Fig. S16c†). The reaction order of the OER is experimentally verified by analyzing the change in the reaction rate at a fixed potential by altering the concentration of the reactant, i.e., the [OH−] in the electrolyte (Fig. 4b). The linear relationship between the resultant logarithmic current density and logarithmic [OH−] gave the reaction order 1.38 at a constant cell voltage, temperature, and pressure.44 The order determined from the slope of logj vs. log[OH−] plot showed the first-order dependence with respect to [OH−] at 1.6 V (vs. RHE) (Fig. 4c). For the heterogeneous catalyst system, first-order dependence on the OER is most often reported.45–47 Additionally, the effect of [OH−] concentration on the catalyst reconstruction is evident from the Raman study of the catalyst material after 10 CV cycles at different concentrations of KOH. In the least concentrated 0.05 M KOH, the catalyst barely underwent transformation (Fig. 4b, inset), while, as the [OH−] was increased, the in situ catalyst transformation hastened due to the increased hydrolysis. The calculated exchange current density (j0; j at zero overpotential) value for the OER was 0.095 mA cm−2, which is significantly higher than that reported with IrO2.44 Moreover, the effect of temperature on the OER activity, anodic transfer coefficient, and activation energy associated with the catalyst was determined. On increasing the cell temperature from 293 K to 333 K, the η10 dropped from 330 (±3) mV to 239 (±5) mV, respectively (Fig. 4d, S17a and Table S3†). The Electrochemical Impedance Spectroscopy (EIS) measurement showed that the charge transfer resistance (Rct) of the catalyst also showed an inverse relationship with the temperature (Fig. S17b†). A large drop of the η10 by ca. 100 mV upon a temperature rise by 43 K depicts the dependence of the OER on the cell temperature, which is in accordance with the Tafel relationship.48
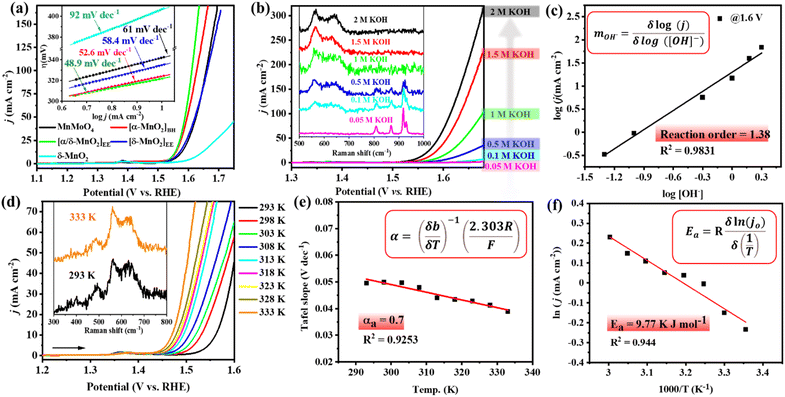 |
| | Fig. 4 (a) LSV polarization curves for the OER with MnMoO4/NF and the MnOx materials derived from it at different activations and independently prepared reference δ-MnO2 (85% iR corr., scan rate 1 mV s−1). Inset: corresponding Tafel slope at different activations. (b) LSV curves recorded for the OER with MnMoO4/NF with different KOH concentrations (inset: Raman spectra of MnMoO4/NF exposed to different KOH concentrations followed by 10 CV cycles). (c) Plot of log[j] versus log[OH−] at a constant voltage of 1.60 V (vs. RHE), the slope of the linear fit is the reaction order (m). (d) The LSV curves recorded at different cell temperatures (85% iR corr., scan rate 1 mV s−1) (inset: Raman spectra after the OER at different temperatures). (e) The variation of Tafel slope against the temperature. (f) Plot of ln [j0] versus 1000/T to determine the activation energy. | |
With the increasing temperature, the Tafel slope decreased from 50 mV dec−1 to 39 mV dec−1 (Fig. S17c and Table S3†). The dependence of Tafel slope (b) on temperature can be used to determine the anodic transfer coefficient (αa), which is the part of electrostatic potential energy that affects the rate of water oxidation during the OER.49 The linear relationship between the Tafel slope and corresponding temperature gave an αa of 0.7 (Fig. 4e). Within a temperature range, the variation of Tafel slope between 50 and 39 mV dec−1 indicates that the rate-limiting step is independent of the cell temperature up to 298 K for α/δ-MnO2(EE). Furthermore, the activation energy (Ea) was determined by j0 variation with temperature according to the Arrhenius relationship (Fig. 4f).44 The corresponding slope yielded a small Ea of 9.77 kJ mol−1. The Raman analysis post the temperature dependence study indicates the thermal stability of the in situ formed α/δ-MnO2(EE) active phase (Fig. 4d inset). The extent of bulk catalyst transformation after prolonged 12 h electrolysis was examined through ICP-MS analyses of the electrolyte, which shows ∼83 ± 4% Mo loss from the catalyst (Table S2†). The favourable OER performance of α/δ-MnO2(EE) is again evident from the high Cdl value (3.63 mF) (Fig. 8a and S18†). To estimate the potential application of the catalyst at the industrial level, the durability was tested at high potentials and prolonged time (Fig. S19†). The catalyst was subjected to a stepwise stability test, moving from 10 mA current density to 100 mA cm−2 and reverting back to 10 mA −2; the catalyst showed a stable current at each step tested for 3600 s (Fig. S19a†). A 24 h bulk electrolysis was performed at 1.55 mA, delivering a fairly stable current ∼14 mA (Fig. S19b†).
Electrocatalytic study of MnMoO4 on carbon cloth
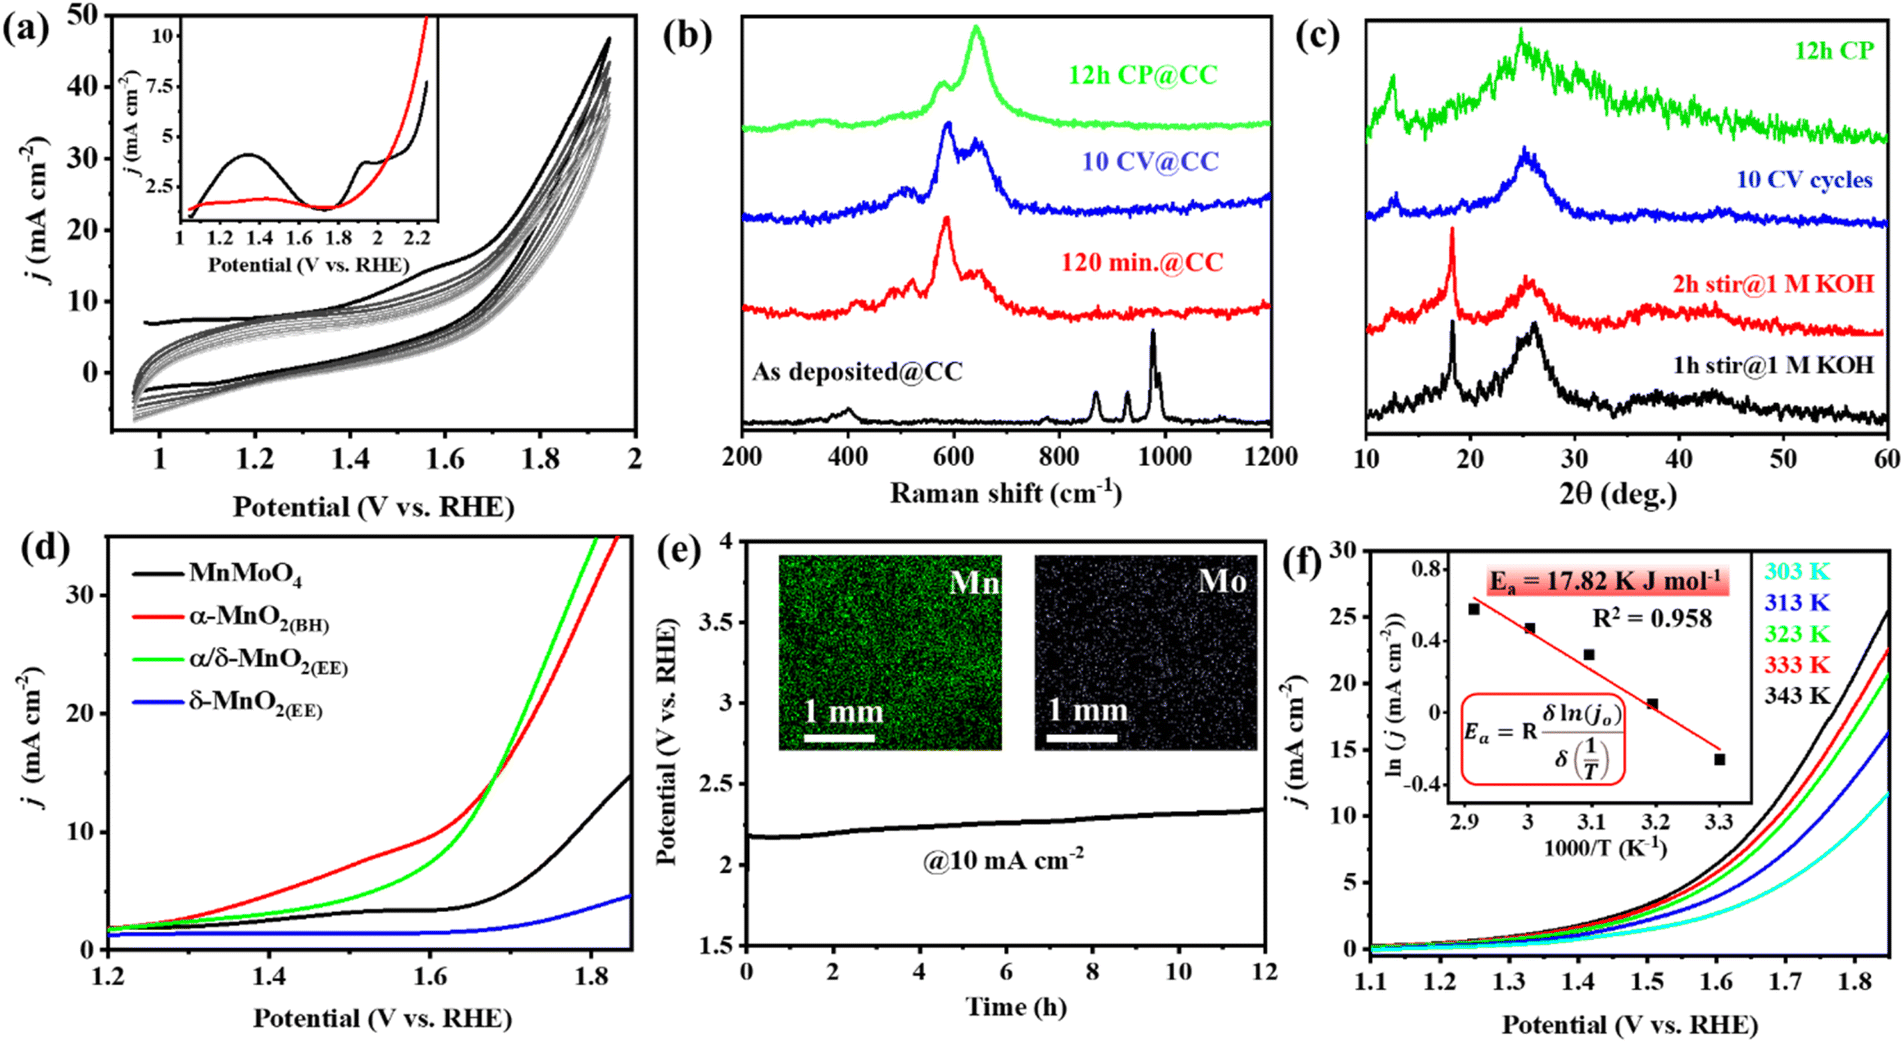
Several Mn-based electro(pre)catalysts reported in the literature show excellent OER performance on a nickel foam support, and the majority of them undergo potential-driven hydrolytic transformation into MnOx or MnO(OH) reactive species. A recent report by Fermin et al. showed that doping of NiII into α-MnO2 greatly changes the electronic configuration of the material and, consequently, the electrocatalytic activity of the doped α-MnO2.50 However, the post-OER and in situ characterization studies of the evolved reactive oxide phases from the previously reported Mn-based electro(pre)catalysts serve as a precedent for no contamination/inclusion of Ni from the foam electrode support into the MnOx structure.14,21–24 The notable activity on nickel foam was due to better electro-conductivity of the metal support, and the OER activity is solely from the catalyst itself. To prove the inherent lability of MnMoO4 under alkaline OER conditions and to emphasize the intrinsic OER activity of the in situ formed MnO2 catalyst, the electrocatalytic OER of MnMoO4 was further tested on the carbon cloth (CC) electrode, keeping electrochemical conditions same as mentioned above. In a similar three-electrode setup (MnMoO4/CC as the working electrode, graphite rod (GR) as the counter electrode, and Hg/HgO (1 M NaOH) as the reference electrode), the cyclic voltammetric (CV) scans were recorded at a scan rate of 10 mV s−1 (Fig. 5a). In the CV cycles of MnMoO4/CC, a broad redox current appeared in between 1.0 and 1.6 V (vs. RHE). DPV study with a freshly prepared MnMoO4/CC can identify two distinct redox peaks which rapidly decline with the progress of the CV cycles and become less intense (Fig. 5a inset and S20†). The redox features can presumably be due to the irreversible transformation of the catalyst.50 It could be noted that after 2 h of stirring in 1 M KOH, MnMoO4 transformed into α-MnO2(BH) phase as shown by the Raman analysis, same as that on NF. Upon applying potential, i.e., 10 CV cycles within 1.0 and 1.6 V, the α-MnO2(BH) gradually transforms into α/δ-MnO2(EE). The redox and catalytic current for the MnMoO4/CC towards the electrocatalytic OER was lower on CC due to the less conductive nature of carbon-based supports. The electrochemical transformation on MnMoO4/CC was studied at different stages of activation using Raman, PXRD, and FESEM-EDX. It was evident that the catalyst transformation from 2 h stirring to 12 h CP (@10 mA) on CC was similar to that of NF (Fig. 5b and S25a†). Upon PXRD analysis of the powder isolated from the CC electrode after different activations of MnMoO4/CC, the diffractions corresponding to α-MnO2 could be observed after 1–2 h stirring in 1 M KOH. These diffractions for α-MnO2 were lost with the potential-driven transformation from the 10 CV cycles to 12 h chronopotentiometry (CP), with simultaneous intensification in the diffractions corresponding to δ-MnO2 (Fig. 5c and S22†). The LSV polarization curves were recorded with MnMoO4/CC (as a working electrode) under similar electrochemical conditions at a scan rate of 5 mV s−1. α/δ-MnO2(EE)/CC showed the best activity on CC with an overpotential of 400 mV@10 mA cm−2 and the maximum catalytic current density (j) of ∼40 mA cm−2 at 1.8 V (vs. RHE) (Fig. 5d). Since carbon-based materials are seen to be poor supports with less conductivity, the activity is lost over time during the electrocatalytic OER.51 Furthermore, the SEM-EDX spectra of the electrode were recorded on the CC after 10 CV cycles and 12 h of CP study (Fig. 5a, e, S23 and S22†). As anticipated, a drastic decrease in the surface Mo concentration was observed after 10 CV cycles with a Mn to Mo ratio of 11:1 (Fig. S23†). This ratio further decreases to 26.7:1 after 12 h of CP (Fig. 5e inset and S24†). Hence, it was concluded that the in situ transformation of MnMoO4 was regardless of the electrode support in an alkaline medium. Moreover, the effect of temperature on the OER activity on the CC support was tested, and some intrinsic parameters were determined. Interestingly, there was a drop in the overpotential value and an increase in the catalytic current with the increment in cell temperature (Fig. 5f), but an increase in the activation energy by 8 kJ mol−1 was calculated on CC as compared to NF, possibly due to the less conductive nature of carbon-based supports (Fig. 5f inset). The temperature-dependent EIS on MnMoO4/CC also showed a decrease in Rct with an increase in temperature (Fig. S25b†). The appreciable decrement in the activity of the catalyst after 12 h CP was also evident from the drastic decrease in the Cdl value after 12 h CP, which can directly be correlated with the ECSA (Fig. S26†).
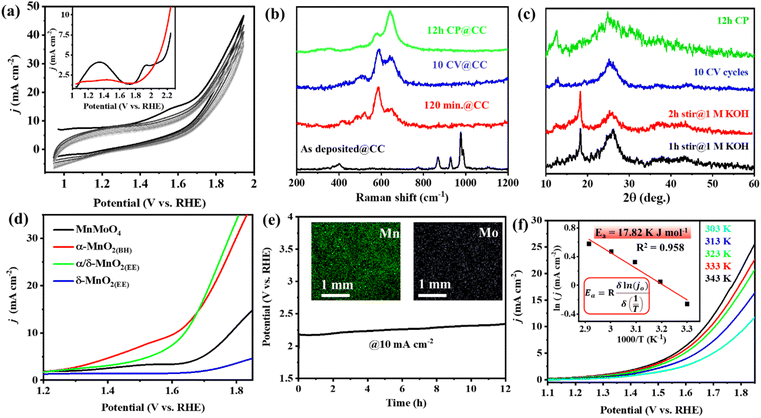 |
| | Fig. 5 (a) Cyclic voltammograms (non-iR corrected, scan rate: 10 mV s−1) recorded with MnMoO4/CC. Inset: the DPV study highlighting the redox features in the first scan (black curve) and 10th scan (red curve). (b) Raman spectra of the MnMoO4/CC electrode under different conditions of activation. (c) PXRD of the powder catalyst isolated from the MnMoO4/CC electrode during different electrochemical activations. (d) LSV polarograms for the OER with MnMoO4/CC at different activations (85% iR corr., scan rate 5 mV s−1). (e) The stability study of α/δ-MnO2(EE)/CC in a three-electrode setup at a constant current of 10 mA. Inset: the SEM-EDX mapping of the catalyst surface after 12 h electrolysis showing the scanty presence of Mo. (f) The LSV curves recorded with α/δ-MnO2(EE)/CC at different cell temperatures. Inset: the plot of ln[j0] versus 1000/T to determine the activation energy. | |
Computational study
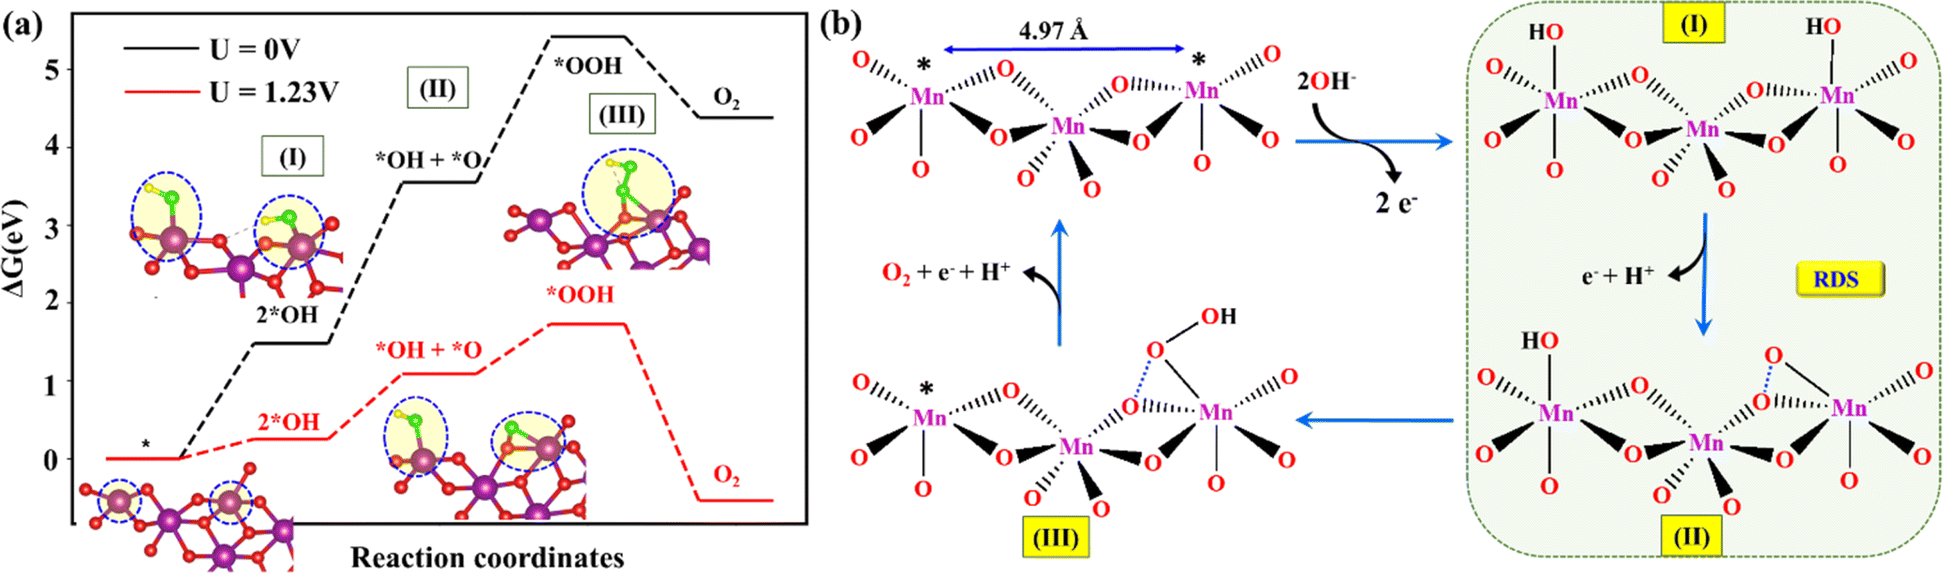
Density functional theory (DFT) based computational simulations are performed to understand the detailed mechanism of the OER on δ-MnO2 surface. Nocera and co-workers proposed that the band-edge sites of active MnOx (MnO1.7–2.0) consist of some MnIII along with MnIV sites as the potent catalytic sites.52 Previously, Li et al. studied the acidic (pH = 0) OER pathway on the electrochemically induced layered δ-MnO2 from Mn3O4.25 In the acidic medium, the (26) surface of δ-MnO2 follows H2O → OH → O → O2 as the lowest energy pathway with the adsorption of a second water molecule and subsequent release of the proton as the rate-determining step (RDS).25
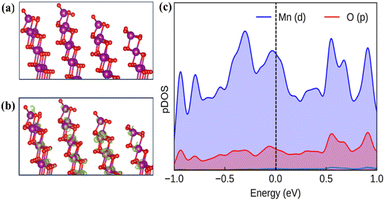
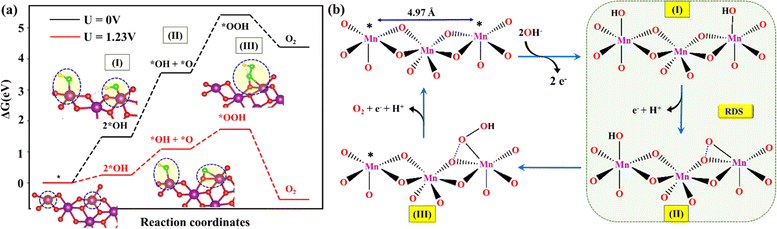
The current study constructs a slab of δ-MnO2 with the (26) plane to computationally model the active surface for the OER. The modeled surface contains unsaturated five-coordinated Mn atoms (Mn5c) as the active site for the OER (Fig. 6a). The optimized slab geometry with the (26)δ plane does not exhibit significant surface reconstruction, indicating its overall structural stability (Fig. 6a and b). In the alkaline medium, the MnO2 surface has a negative charge with the prevalence of hydroxo/oxo terminals.53 The partial density of states (pDOS) depicts that the oxygen 2p and manganese 3d orbitals dominantly contribute at the band edge states (Fig. 6c). The following mechanism for the OER has been considered for the calculation of Gibb's free energy (ΔG) associated with each step at the equilibrium potential (U = 1.23 V):
| * + 2OH− → 2*OH + 2e− (step I; ΔG = 0.25 eV) |
| 2*OH → *OH + *O + H+ + e− (step II; ΔG = 0.84 eV) |
| *OH + *O → *OOH (step III; ΔG = 0.65 eV) |
| *OOH → O2 (g) + H+ + e− (step IV; ΔG = −2.26 eV) |
 |
| | Fig. 6 (a) Optimized surface structure of (26)δ. (b) The charge density at the Fermi levels. (c) The electronic density of states for the (26)δ plane of MnO2, plotted with contributions only from the surface atoms. Colour code: violet (Mn), and red (O). | |
In the first step, two hydroxides were adsorbed on the surface of the catalytically active edge Mn5c sites (*; 4.97 Å apart) on layered MnO2, resulting in the formation of *2OH (step I) (Fig. 7a and b). Both the Mn–OH* sites may act synergistically or can behave as independent OER reactive sites to form the *O species. In the next step, one proton and an electron were released from one of the two *OH, resulting in the formation of *O + *OH (step II). The *O intermediate is, however, found to have a strong interaction with the lattice oxygen (O–O = 1.4 Å) to stabilize the metal oxo species (Fig. 7a, step II). It appears that deprotonation of *OH is a proton-coupled concerted step where O–O bond formation occurs between one of the neighbouring lattice oxygens of the (26)δ plane of the MnO2 and the adsorbed oxygen (*O) from the electrolyte. In step III, a hydroxide attached to the neighbouring Mn site further migrated to *O to form the *OOH, while *O was still attached to lattice oxygen, with a slightly longer bond (O–O = 1.52 Å). In a parallel pathway, a hydroxide ion from the electrolyte may also participate in the formation of *OOH. In step IV, with the subsequent release of a proton and electron, an O2 molecule is released from the *OOH (Fig. 7a and b). At the equilibrium potential, step II possessed the ΔG of 0.84 eV, which is the highest among all the steps. The ΔG value of step III, i.e., the peroxide formation step, was 0.65 eV, approx. 0.2 eV less than that of step II. Under the equilibrium potential of 1.23 V, the second step can be considered as the RDS of the alkaline OER on the surface of δ-MnO2(EE). The formation of *OH + *O species has also been established by Li et al. as the RDS during the acidic (pH = 0) OER pathway on the electrochemically induced layered δ-MnO2.25 However, the latter observation by Li et al. was made by considering the reaction mechanism where *OH + *O species spontaneously liberated O2, skipping the peroxo formation step. However, the mechanism involving the peroxo formation (step III) for the OER is feasible on the MnO2 surface (Fig. 7a). Although step II is found to be the RDS, the participation of step III in limiting the rate of the reaction can't be ruled out entirely, and the co-existence of the corresponding intermediates of steps II and III on the catalyst surface can be anticipated. A lattice oxygen mechanism (LOM) is also feasible under different reaction conditions, as a strong interaction of the *O with the neighboring lattice oxygen was observed in step II.
 |
| | Fig. 7 (a) The energy profile of the steps involved during the OER on the (26)δ surface of MnO2. The inset represents the top view of the (26)δ surface with attached reaction intermediates for the OER. (b) Schematic representation of the OER mechanism under alkaline conditions facilitated by the active edge Mn5c sites on the δ-MnO2(EE). The asterisk (*) represents the catalytically active edge Mn5c sites on layered MnO2. Colour code: violet (Mn), red (O), green (O*), and yellow (H). | |
Overall water splitting
A two-electrode cell setup, α/δ-MnO2(EE)/NF(−)/(+)GR, was constructed as an overall water-splitting electrolyzer. The polarization curves recorded with the cell in 1 M KOH delivered 10 mA cm−2 current density at a cell potential of 1.69 V (Fig. 8b). To check the stability of the material under overall water splitting conditions, electrolysis was carried out at the cell potential of 1.7 V, and a fairly stable constant current of 10 mA cm−2 was achieved throughout 12 h (Fig. 8b inset). To calculate the Faradaic efficiency (F. E.) of the catalyst, the 2 h CP study was done at a constant current of 15 mA and the evolved O2 in the anodic chamber was quantified (Fig. S27 and eqn (S5)†). The α/δ-MnO2(EE) gave a F. E. of 82 ± 2%.
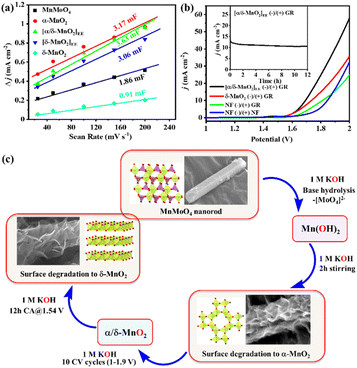 |
| | Fig. 8 (a) Cdl values of MnMoO4/NF and the MnOx materials derived from it at different activations and independently prepared reference δ-MnO2. (b) Polarization curves for the overall water splitting study with an electrolyzer α/δ-MnO2(EE)/NF(−)/(+)GR and other reference electrolyzers (inset: stability study of α/δ-MnO2(EE)/NF(−)/(+)GR at a cell potential of 1.7 V). (c) Steps involved in the electro-modification of MnMoO4 during alkaline OER. | |
As proven by various analyses, the [MoO4]2− species readily leach out of the MnMoO4 catalyst under alkaline conditions. Due to the significant ionic nature, the Mn–O–Mo bond gets readily hydrolyzed in the basic (OH−) environment, thereby forming Mn(OH)2 on the surface of the catalyst.8 Continuous stirring results in further oxidation and the formation of α-MnO2, which remains stable in the alkaline environment. The CV oxidation peak also indicates the conversion of MnII to a higher oxidation state. The sequential in situ Raman spectra reveal the chemical transformation of MnMoO4 into α-MnO2(BH)via base hydrolysis, while the phase transformation of α-MnO2(BH) into δ-MnO2(EE) occurs via the α/δ-MnO2(EE) intermediate only under the potential bias (Fig. 8c). SEM-EDX elemental mapping, BET analysis, etc., unveiled the accompanying changes in the structure and morphology of MnMoO4 upon in situ chemical transformation. The in situ formed catalytically active phase was amorphous with increased active sites. XPS, however, proclaimed the simultaneous existence of MnIII/MnIV after electrolysis. The existence of MnIII within MnOx layers has previously been established by extensive study, and this has been considered crucial for the electrochemical OER.28,54 Several reported (pre)catalysts have been shown to undergo catalyst reconstruction, and the extent of transformation depends on the initial catalyst structure (Table S1†), while the in situ formation of the final active phase is often shown to be accompanied by the formation of some intermediate phase.24 The in situ formed active MnOx is rich in surface roughness and defects, facilitating the free movement of electrolytes and stabilizing the reaction intermediates on the catalyst's surface. This extensive transformation of the MnMoO4 pre-catalyst under basic conditions is also found to be independent of the electrode support used during the electrocatalytic OER study.
Conclusion
In summary, monoclinic phase MnMoO4 nanorods were synthesized, and their in situ transformation into the catalytically active phase during electrochemical OER was studied. Detailed ex situ and in situ analyses established that the hydrolytic surface corrosion of MnMoO4 nanorods started in 1 M KOH electrolyte to generate α-MnO2 which resulted in the breakdown of the nanorod morphology, identified from the SEM imaging and time-resolved Raman study. The structural and chemical alteration of MnMoO4 is associated with hydrolytic molybdate dissolution from the nanorods with an experimentally estimated rate of kobs of 4.5 s−1. However, under OER conditions, the in situ formed α-MnO2 was slowly transformed to the mixed-phase α/δ-MnO2 which was the most active for the OER as compared to the pristine MnMoO4, in situ formed α-MnO2, δ-MnO2 and even the independently prepared δ-MnO2. The alkaline and potential-driven chemical and phase transformations are independent of electrode substrates (Ni foam and carbon cloth) chosen for the electrocatalytic study. Detailed post-OER microscopic and spectroscopic analyses validated the presence of some MnIII species in δ-MnO2. The in situ formed, catalytically active α/δ-MnO2(EE) is thermally stable and undergoes phase transformation solely under the influence of applied potential. Increment in cell temperature resulted in a significant improvement in the OER activity of the catalyst. Furthermore, the temperature-dependent Tafel slope analyses provided an exceptionally low activation energy of 9.77 kJ mol−1. An increment in the surface roughness and exposure of the catalytically active sites generated in the in situ formed α/δ-MnO2 enhanced the reaction kinetics of the OER. From the DFT study performed on the (26)δ surface of δ-MnO2, it was concluded that the dissociation of the O–H bond of the *OH to form *O intermediate requires a ΔG of 0.84 eV at the equilibrium potential of 1.23 V and is the RDS of the alkaline OER on the surface of δ-MnO2(EE). However, the peroxide formation (step III) also involves comparable energy and can compete with step II in limiting the rate of the reaction. Little has been explored on the electrochemical OER performance of MnMoO4, and no account of the study of the real active catalyst derived from MnMoO4 during electrochemical OER has been found. In the present study, the electrocatalytic transformation of MnMoO4 electro(pre)catalyst was traced in situ, a detailed electro-kinetic study helped to understand the OER mechanism of the evolved reactive phase, and the DFT study established the OER mechanism and the RDS associated with it.
Data availability
Characterization of the catalysts by spectroscopic, microscopic, PXRD, and analytical techniques, along with the details of the experimental, electrochemical methods, and theoretical calculation details are included in the ESI.†
Conflicts of interest
The authors declare no competing financial interests.
Acknowledgements
AR (ID: 1401195) and HKB (ID; 1403207) sincerely thank PMRF Gov. of India for their fellowships. AK acknowledges IIT Delhi for a JRF. BC acknowledges IIT Delhi Seed grant PLN12/04CY and PLN12/04MS, respectively. DG thanks the Science and Engineering Research Board (SERB), India for the Start-up Research Grant SRG/2022/00l234. The authors thank the IIT Delhi HPC facility for computational resources. Computational work was partly performed at the Center for Integrated Nanotechnologies, an Office of Science User Facility operated for the U.S. Department of Energy (DOE) Office of Science by Los Alamos National Laboratory (Contract 89233218CNA000001) and Sandia National Laboratories (Contract DE-NA-0003525). The authors acknowledge CRF IIT Delhi for the microscopic and XPS facilities.
Notes and references
- L. Gao, X. Cui, C. D. Sewell, J. Li and Z. Lin, Chem. Soc. Rev., 2021, 50, 8428–8469 RSC.
- T. T. T. Toan, D. M. Nguyen, A. Q. Dao, V. T. Le and Y. Vasseghian, Mol. Catal., 2023, 538, 113001 CrossRef CAS.
- Y. Zhu, T.-R. Kuo, Y.-H. Li, M.-Y. Qi, G. Chen, J. Wang, Y.-J. Xu and H. M. Chen, Energy Environ. Sci., 2021, 14, 1928–1958 RSC.
- N.-T. Suen, S.-F. Hung, Q. Quan, N. Zhang, Y.-J. Xu and H. M. Chen, Chem. Soc. Rev., 2017, 46, 337–365 RSC.
- X. Liu, J. Meng, J. Zhu, M. Huang, B. Wen, R. Guo and L. Mai, Adv. Mater., 2021, 33, 2007344 CrossRef CAS PubMed.
- H. Zhong, Q. Zhang, J. Yu, X. Zhang, C. Wu, Y. Ma, H. An, H. Wang, J. Zhang, X. Wang and J. Xue, Adv. Energy Mater., 2023, 13, 2301391 CrossRef CAS.
- B. R. Wygant, K. Kawashima and C. B. Mullins, ACS Energy Lett., 2018, 3, 2956–2966 CrossRef CAS.
- A. Rajput, M. K. Adak and B. Chakraborty, Inorg. Chem., 2022, 61, 11189–11206 CrossRef CAS PubMed.
- M. K. Adak, A. Rajput, D. Ghosh and B. Chakraborty, ACS Appl. Energy Mater., 2022, 5, 13645–13660 CrossRef CAS.
- A. Kundu and B. Chakraborty, JACS Au, 2024, 4, 642–656 CrossRef CAS PubMed.
- T. Li, O. Kasian, S. Cherevko, S. Zhang, S. Geiger, C. Scheu, P. Felfer, D. Raabe, B. Gault and K. J. J. Mayrhofer, Nat. Catal., 2018, 1, 300–305 CrossRef.
- Y. Umena, K. Kawakami, J.-R. Shen and N. Kamiya, Nature, 2011, 473, 55–60 CrossRef CAS PubMed.
- C. Cheng, Z. Yang and J. Wei, Cryst. Growth Des., 2021, 21, 4564–4570 CrossRef CAS.
- C. Walter, P. W. Menezes, S. Loos, H. Dau and M. Driess, ChemSusChem, 2018, 11, 2554–2561 CrossRef CAS PubMed.
- H. Kakizaki, H. Ooka, T. Hayashi, A. Yamaguchi, N. Bonnet-Mercier, K. Hashimoto and R. Nakamura, Adv. Funct. Mater., 2018, 28, 1706319 CrossRef.
- L. C. Seitz, T. J. P. Hersbach, D. Nordlund and T. F. Jaramillo, J. Phys. Chem. Lett., 2015, 6, 4178–4183 CrossRef CAS PubMed.
- K. H. Cho, S. Park, H. Seo, S. Choi, M. Y. Lee, C. Ko and K. T. Nam, Angew. Chem., Int. Ed., 2021, 60, 4673–4681 CrossRef CAS PubMed.
- J. Guan, Z. Duan, F. Zhang, S. D. Kelly, R. Si, M. Dupuis, Q. Huang, J. Q. Chen, C. Tang and C. Li, Nat. Catal., 2018, 1, 870–877 CrossRef CAS.
- M. F. Tesch, S. A. Bonke, T. E. Jones, M. N. Shaker, J. Xiao, K. Skorupska, R. Mom, J. Melder, P. Kurz, A. Knop-Gericke, R. Schlögl, R. K. Hocking and A. N. Simonov, Angew. Chem., Int. Ed., 2019, 58, 3426–3432 CrossRef CAS PubMed.
- L. Tian, X. Zhai, X. Wang, J. Li and Z. Li, J. Mater. Chem. A, 2020, 8, 14400–14414 RSC.
- I. Mondal, P. V. Menezes, K. Laun, T. Diemant, M. Al-Shakran, I. Zebger, T. Jacob, M. Driess and P. W. Menezes, ACS Nano, 2023, 17, 14043–14052 CrossRef CAS PubMed.
- C. Walter, S. Kalra, R. Beltrán-Suito, M. Schwarze, P. W. Menezes and M. Driess, Mater. Today Chem., 2022, 24, 100905 CrossRef CAS.
- P. W. Menezes, C. Walter, B. Chakraborty, J. N. Hausmann, I. Zaharieva, A. Frick, E. von Hauff, H. Dau and M. Driess, Adv. Mater., 2021, 33, 2004098 CrossRef CAS PubMed.
- P. W. Menezes, C. Walter, J. N. Hausmann, R. Beltrán-Suito, C. Schlesiger, S. Praetz, V. Yu. Verchenko, A. V. Shevelkov and M. Driess, Angew. Chem., Int. Ed., 2019, 58, 16569–16574 CrossRef CAS PubMed.
- Y.-F. Li and Z.-P. Liu, J. Am. Chem. Soc., 2018, 140, 1783–1792 CrossRef CAS PubMed.
- Y. Meng, W. Song, H. Huang, Z. Ren, S.-Y. Chen and S. L. Suib, J. Am. Chem. Soc., 2014, 136, 11452–11464 CrossRef CAS PubMed.
- D. M. Robinson, Y. B. Go, M. Mui, G. Gardner, Z. Zhang, D. Mastrogiovanni, E. Garfunkel, J. Li, M. Greenblatt and G. C. Dismukes, J. Am. Chem. Soc., 2013, 135, 3494–3501 CrossRef CAS PubMed.
- I. Zaharieva, D. González-Flores, B. Asfari, C. Pasquini, M. R. Mohammadi, K. Klingan, I. Zizak, S. Loos, P. Chernev and H. Dau, Energy Environ. Sci., 2016, 9, 2433–2443 RSC.
- T. Takashima, K. Hashimoto and R. Nakamura, J. Am. Chem. Soc., 2011, 134, 1519–1527 CrossRef PubMed.
- U. Maitra, B. S. Naidu, A. Govindaraj and C. N. R. Rao, Proc. Natl. Acad. Sci. U.S.A., 2013, 110, 11704–11707 CrossRef CAS PubMed.
- J. Suntivich, H. A. Gasteiger, N. Yabuuchi, H. Nakanishi, J. B. Goodenough and Y. Shao-Horn, Nat. Chem., 2011, 3, 546–550 CrossRef CAS PubMed.
- J. Suntivich, K. J. May, H. A. Gasteiger, J. B. Goodenough and Y. Shao-Horn, Science, 2011, 334, 1383–1385 CrossRef CAS PubMed.
- G. Corbel, Y. Laligant, F. Goutenoire, E. Suard and P. Lacorre, Chem. Mater., 2005, 17, 5390 CrossRef CAS.
- T. Ozeki, H. Kihara and S. Ikeda, Anal. Chem., 1988, 60, 2055–2059 CrossRef CAS.
- L. H. d. S. Lacerda and M. A. San-Miguel, J. Mater. Sci., 2022, 57, 10179–10196 CrossRef CAS PubMed.
- G. D. Saraiva, J. G. da Silva Filho, A. J. R. de Castro, V. O. S. Neto, C. B. Silva, J. A. Lima, A. M. R. Teixeira, P. T. C. Freire, W. Paraguassu and F. F. de Sousa, J. Solid
State Chem., 2022, 311, 123105 CrossRef CAS.
- S. Jayasubramaniyan, S. Balasundari, P. A. Rayjada, N. Satyanarayana and P. Muralidharan, RSC Adv., 2018, 8, 22559–22568 RSC.
- M. K. Adak, A. Rajput, L. Mallick and B. Chakraborty, ACS Appl. Energy Mater., 2022, 5, 5652–5665 CrossRef CAS.
- M. C. Biesinger, B. P. Payne, A. P. Grosvenor, L. W. M. Lau, A. R. Gerson and R. S. C. Smart, Appl. Surf. Sci., 2011, 257, 2717–2730 CrossRef CAS.
- G. Solomon, A. Landström, R. Mazzaro, M. Jugovac, P. Moras, E. Cattaruzza, V. Morandi, I. Concina and A. Vomiero, Adv. Energy Mater., 2021, 11, 2101324 CrossRef CAS.
- H. Ali-Löytty, M. W. Louie, M. R. Singh, L. Li, H. G. Sanchez Casalongue, H. Ogasawara, E. J. Crumlin, Z. Liu, A. T. Bell, A. Nilsson and D. Friebel, J. Phys. Chem. C, 2016, 120, 2247–2253 CrossRef.
- M. H. Miles, E. A. Klaus, B. P. Gunn, J. R. Locker, W. E. Serafin and S. Srinivasan, Electrochim. Acta, 1978, 23, 521–526 CrossRef CAS.
- T. Reier, M. Oezaslan and P. Strasser, ACS Catal., 2012, 2, 1765–1772 CrossRef CAS.
- T. Schuler, T. Kimura, T. J. Schmidt and F. N. Büchi, Energy Environ. Sci., 2020, 13, 2153–2166 RSC.
- J. E. Thorne, J.-W. Jang, E. Y. Liu and D. Wang, Chem. Sci., 2016, 7, 3347–3354 RSC.
- A. Kundu, B. Kumar and B. Chakraborty, J. Phys. Chem. C, 2022, 126, 16172–16186 CrossRef CAS.
- M. K. Adak, L. Mallick, K. Samanta and B. Chakraborty, J. Phys. Chem. C, 2023, 127, 154–168 CrossRef CAS.
- E. Kirowa-Eisner, M. Schwarz and E. Gileadi, Electrochim. Acta, 1989, 34, 1103–1111 CrossRef.
- R. Guidelli, R. Compton, J. M. Feliu, E. Gileadi, J. Lipkowski, W. Schmickler and S. Trasatti, Pure Appl. Chem., 2014, 86, 245–258 CrossRef CAS.
- S. M. Alharbi, M. A. Alkhalifah, B. Howchen, A. N. A. Rahmah, V. Celorrio and D. J. Fermin, ACS Mater. Au, 2024, 4, 74–81 CrossRef CAS PubMed.
- M. P. Browne and A. Mills, J. Mater. Chem. A, 2018, 6, 14162–14169 RSC.
- M. Huynh, D. K. Bediako, Y. Liu and D. G. Nocera, J. Phys. Chem. C, 2014, 118, 17142–17152 CrossRef CAS.
- M. Huynh, D. K. Bediako and D. G. Nocera, J. Am. Chem. Soc., 2014, 136, 6002–6010 CrossRef CAS PubMed.
- Y. Gorlin, B. Lassalle-Kaiser, J. D. Benck, S. Gul, S. M. Webb, V. K. Yachandra, J. Yano and T. F. Jaramillo, J. Am. Chem. Soc., 2013, 135, 8525–8534 CrossRef CAS PubMed.
Footnote |
| † Electronic supplementary information (ESI) available: Characterization of the catalysts by spectroscopic, microscopic, PXRD and analytical techniques, along with the details of the experimental and electrochemical methods. See DOI: https://doi.org/10.1039/d4ta05985a |
|
| This journal is © The Royal Society of Chemistry 2024 |
Click here to see how this site uses Cookies. View our privacy policy here. 
 *a
*a