
Morphological impact of 1-dimensional to 3-dimensional manganese dioxides on catalytic ozone decomposition correlated with crystal facets and lattice oxygen mobilities†
Haotian
Wu
,
Runduo
Zhang
 *,
Bin
Kang
,
Xiaonan
Guo
,
Zhaoying
Di
,
Kun
Wang
,
Jingbo
Jia
,
Ying
Wei
and
Zhou-jun
Wang
*,
Bin
Kang
,
Xiaonan
Guo
,
Zhaoying
Di
,
Kun
Wang
,
Jingbo
Jia
,
Ying
Wei
and
Zhou-jun
Wang
State Key Laboratory of Chemical Resource Engineering, Beijing Key Laboratory of Energy Environmental Catalysis, Beijing University of Chemical Technology, Beijing 100029, China. E-mail: zhangrd@mail.buct.edu.cn
First published on 5th November 2024
Abstract
Ozone is a pollutant that has received widespread attention in recent years, and manganese dioxide (MnO2) has been widely used for catalytic ozone decomposition. However, few studies have described the structure–activity correlation of different morphological types of MnO2. In this study, a series of MnO2 crystals (α-, β-, γ-, δ-, ε- and λ-MnO2) were synthesized, and their catalytic activities on ozone decomposition (25 °C, dry air) were comparatively studied, which exhibited the order ε-MnO2 > α-MnO2 > γ-MnO2 > β-MnO2 ≈ δ-MnO2 > λ-MnO2. XRD and HRTEM results confirmed their diversities on the exposed crystal planes. It was confirmed that ε-MnO2 with the (1 0 2) plane had the largest number of oxygen vacancies and the best oxygen mobility. These findings elucidated the favorable performance of ε-MnO2 in the aforementioned tests. DFT calculations revealed the reaction mechanism, showing that ε-MnO2 has the lowest energy barrier for the rate-determining O22− desorption step (2.04 eV). This work illustrated the crucial role of oxygen vacancies and the mobility of lattice oxygen, shedding light on the strategies for rational design and control synthesis of effective catalysts for ozone elimination.
Environmental significanceAs the level of indoor pollution continues to increase, ozone existing in the enclosed environment has received considerable attention and its effective control has become an unavoidable objective. Catalytic oxidation at ambient temperature is considered one of the most promising routes for ozone removal because of its high efficiency, easy operation, and environmental friendliness. In this study, different types of MnO2 were prepared and used for catalytic ozone removal, and the differences among them were investigated with regard to the exposure facet, content of oxygen vacancies, and mobility of oxygen species. The mechanism of catalytic ozone decomposition by MnO2 was further studied by means of DFT calculations. This work could provide a guidance for the reasonable design of highly efficient catalysts for ozone elimination. |
1. Introduction
In recent years, ozone pollution is attracting more and more attention from the government and academic community due to its hazardous characteristics towards the biological environment and human beings. On Oct 1, 2015, the U.S. Environmental Protection Agency (EPA) updated the National Ambient Air Quality Standards (NAAQS) for ground-level ozone from 75 parts per billion (ppb) to 70 ppb with an aim to protect the public health by reducing premature deaths and morbidity of lung diseases, such as asthma or chronic obstructive pulmonary disease.1 In China, the Ministry of Ecology and Environment of the People's Republic of China also proposed to take actions to build a precise ozone prevention and control system in 2022.Ozone in the troposphere is formed through the reactions among volatile organic compounds (VOCs), carbon monoxide (CO), methane (CH4), and nitrogen oxides (NOx) in the presence of sunlight. In addition, the rate of ozone formation can be significantly accelerated by fine particulate matter with an aerodynamic diameter of 2.5 mm or less (PM2.5).2,3 Moreover, outdoor ozone might readily transfer indoors, which can cause direct harm to health. Furthermore, higher-than-normal levels of ozone can be generated in enclosed spaces, such as airplane cabin3 and room where laser printer4 and electrostatic precipitator5 are used.
For ozone removal, physisorption and catalytic post-treatment are mainly applied.6–11 Physisorption involves just a physical capture, where ozone is never decomposed. In contrast, direct catalytic decomposition of O3 into O2 at room temperature is promising due to its high efficiency, ease of operation, and eco-friendliness. The key to the excellent performance of O3 depletion at room-temperature is the catalyst design from an atomic or molecular aspect. Among all the latest catalysts reported in the literature, manganese oxides have exhibited diverse morphologies and promising applications for O3 purification. Tang et al.12 reported that α-MnO2 with (0 0 1) facets had outstanding activity for ozone decomposition due to their abundant active sites and down-shifted lowest unoccupied Mn 3d orbitals. Usually, the use of β-MnO2 alone does not work well in the decomposition of ozone13 due to its (1 × 1) tunnels, high Mn average oxidation state (AOS), low specific surface area (SBET) and few surface adsorbed oxygen species resulting from the oxygen vacancy sites. By doping the transition metal Co on β-MnO2, Zhang et al.14 increased its specific surface area, decreased the crystallinity and introduced more oxygen vacancies, obtaining a high-performing catalyst for the room-temperature catalytic decomposition of ozone. Li et al.15 doped transition metals of Ce and Co into γ-MnO2 and concluded that the decrease in the content of oxygen vacancies was the main reason for the deactivation. Similarly, Xu et al.16 confirmed that the oxygen vacancy content of γ-MnO2 is a determinant of the ozone decomposition rate in their study. The above three types of MnO2 are reported as the mostly used catalysts in ozone elimination as they all belong to one-dimensional crystal forms. Moreover, the two- and three-dimensional configurations of MnO2 have been recently studied and used as catalysts for a series of redox processes. Wang et al.17 obtained a series of different δ-MnO2 by modulating the ratio of Mn2+ to Mn7+ during the preparation process, showing that δ-MnO2 with the most oxygen vacancy content and excellent oxygen mobility has superior activity. Gopi et al.18 prepared H+-containing δ-MnO2 using the proton exchange method, which enhanced the SBET, reduced AOS and introduced more oxygen vacancies. Hong et al.19 prepared a series of catalysts using acid treatment to introduce lattice defects, which also demonstrated effective catalytic ozone decomposition. It was reported20 that a kind of λ-MnO2 was synthesized via a hydrothermal tandem synthesis approach. However, the low specific surface area and oxygen vacancy content of the resulting material displayed a relatively weak catalytic oxidation activity towards toluene. Porous λ-MnO2 with a spinel structure was successfully synthesized from the ZnMn2O4via the acid-etching route by Li et al.,21 which was applied for benzene oxidation. The acid-etching method increases the specific surface area of λ-MnO2, enhances its low-temperature reducibility, and increases the oxygen vacancy content, which enables λ-MnO2 to perform well in benzene oxidation.
Oxygen vacancies have been recognized as the core sites for the catalytic decomposition of ozone.15,22–29 However, the oxygen vacancy content is directly affected by the distinct facets exposed by different types of MnO2 crystals. Yang et al.20 synthesized all the six kinds of MnO2 crystal structures and investigated their activities in the O3-assisted catalytic oxidation of toluene at room temperature. They demonstrated that different types of MnO2 with different contents of oxygen vacancies and mobility of oxygen species play important roles in the expression of activity. Through combined computational and experimental studies, Hayashi et al.30 demonstrated that the catalytic oxidation of organic substances is largely dependent on the crystal structures of each type of MnO2. Tian et al.31 synthesized three MnO2 polymorphs (α-, β-, and ε-MnO2) and systematically studied their physicochemical properties for CO oxidation. Nevertheless, the morphological-control synthesis of MnO2 and the correlated structure–performance relationship for O3 catalytic decomposition are far from being well established. Compared to other oxides, manganese dioxide is much better than other oxides in use for O3 removal (Fig. S1†).
In this work, we prepared six kinds of MnO2 crystals (α-, β-, γ-, δ-, ε-, and λ-MnO2, Fig. 1) with diverse morphologies and investigated their catalytic activities for ozone decomposition. From a series of characterizations and computational results, an attempt to illustrate the structure–performance correlation for these catalysts with diverse morphologies and crystal facets has been done.
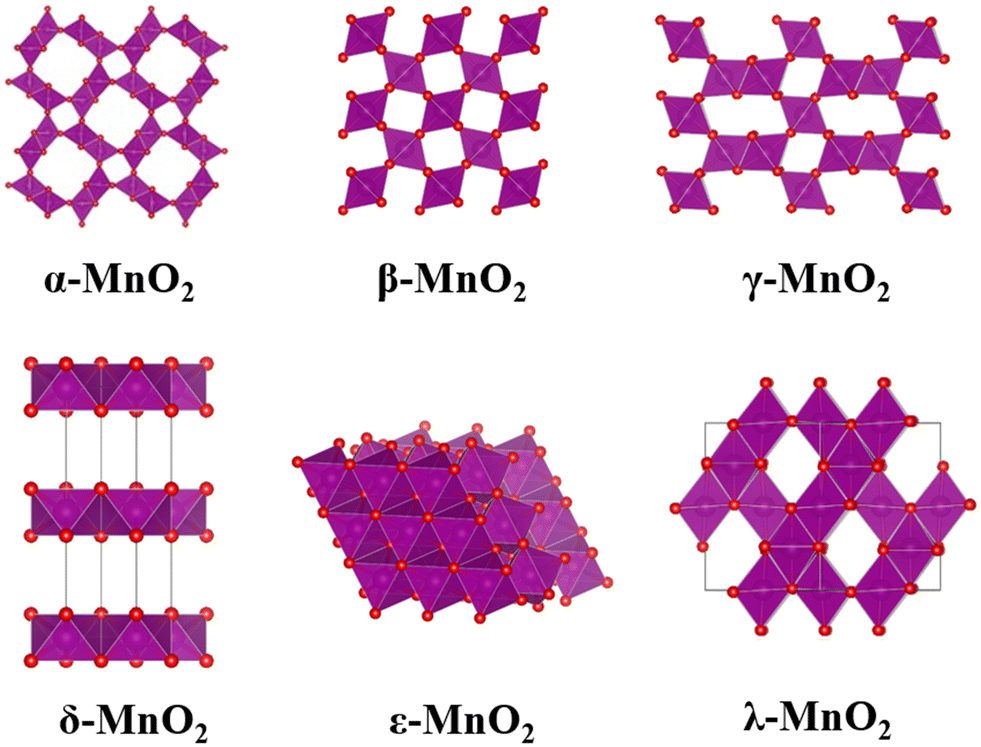 | ||
| Fig. 1 Diverse crystal structures of MnO2 samples. | ||
2. Experimental and computational details
2.1 Experimental section
Six kinds of MnO2 were accordingly prepared. All reagents used in this work were analytically pure and used without any treatment. The details of the synthesis methods are described in the ESI.†2.2 Catalyst characterization
The crystallographic information was investigated by X-ray diffraction (XRD) using a diffractometer equipped with Cu Kα radiation (Bruker, Germany). The specific surface areas (SBET) were determined using N2-sorption isothermal analysis (Quantachrome, USA) based on the Brunauer–Emmett–Teller (BET) theory, and the pore size distributions were calculated based on the Barrett–Joyner–Halenda (BJH) method. The temperature-programmed reduction by H2 (TPR) and temperature-programmed desorption of O2 (TPD) experiments were carried out on a device with a thermal conductivity detector (TCD, Huasi, China). Temperature-programmed oxygen isotopic exchange (TPOIE) was used to evaluate oxygen mobility in a wide temperature range, and the diagram of the device is shown in Fig. S2.† Scanning electron microscopy (SEM, Gemini Sigma-500, Zeiss, Germany) and high-resolution transmission electron microscopy (HRTEM, JEM-2100, JEOL, Japan) were employed to observe the morphologies and microstructures of MnO2 samples. An X-ray photoelectron spectroscopy (XPS) instrument (Thermo ESCALAB 250Xi, USA) equipped with a monochromatic Al Kα X-ray source was used to analyze the surface elemental properties. The details are given in the ESI.†2.3 Computational details
During the theoretical simulation, the slab models were respectively reconstructed using different scales of the supercell according to their structures, and the slabs were periodically repeated with a vacuum spacing of 15 Å for oxygen vacancy formation. All slab calculations were performed using a Monkhorst–Pack grid (k-mesh = 0.030) with a cutoff energy of 500 eV and the smearing parameter set to 0.02 eV. The computational details are given in the ESI.†2.4 Catalytic activity evaluation
The catalytic performance of the as-prepared samples for ozone decomposition was evaluated by a fixed-bed continuous flow quartz reactor at 25 °C. Gaseous ozone was generated by an UV ozone generator (SNXIN UV STERILIZER) and checked by an ozone monitor (Model 205 Dual Beam Ozone Monitor). The relative humidity (RH) was obtained by flowing air through a water bath and measured with a hygrometer (Center 313, Humidity Temperature Meter). The detailed reaction conditions are described as follows. First, the sample (100 mg, 40–60 mesh) was loaded into a quartz tube (inner diameter = 6 mm). The feed gases, consisting of 40 ppm of O3, 50% RH, and air, were subsequently introduced into the reaction system. The total gas flow rate was 500 mL min−1, corresponding to a gas hourly space velocity (GHSV) of 5800 h−1. The reaction temperature was 25 °C. The O3 conversion (XO3) can be calculated based on the following equation.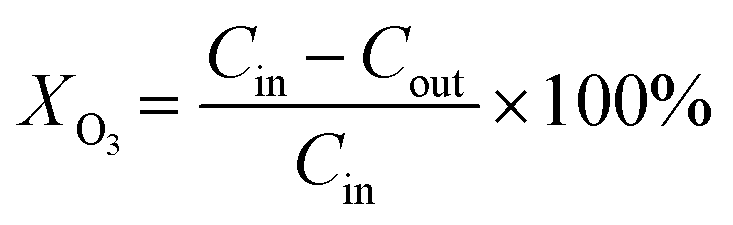 | (1) |
Here, Cin is the ozone concentration at the inlet and Cout is the ozone concentration at the outlet.
3. Results and discussion
3.1 Crystal & pore structure and morphology
The XRD patterns (Fig. 2a) of the MnO2 samples obtained are respectively in good agreement with those of α-MnO2 (JCPDS No. 44-0141), β-MnO2 (JCPDS No. 24-0735), γ-MnO2 (JCPDS No. 14-0644), δ-MnO2 (JCPDS No. 80-1098), ε-MnO2 (JCPDS No. 30-0820), and λ-MnO2 (JCPDS No. 44-0992), indicating that six kinds of MnO2 with specific crystalline phases have been successfully obtained. As seen from Fig. 2a, the sharp diffraction peaks of β-MnO2 (1 1 0) and λ-MnO2 (1 1 1) were visible, indicating their relatively high crystallinities with respect to the other samples (ε-MnO2, α-MnO2, γ-MnO2, and δ-MnO2). This difference in the crystallinity mainly comes from their synthetic methods. α-MnO2 was synthesized by the hydrothermal crystallization at 100 °C for 12 h, and the relatively low temperature and short crystallization time endowed the as-prepared α-MnO2 with a small particle size. Similarly, the spherical MnCO3 precursor with a small particle size of ε-MnO2 was synthesized at 80 °C. During the calcination process, this spherical MnCO3 structure restricted the growth of the crystal so that ε-MnO2 was able to maintain its small particle size. In addition, their small domains of primary particles result in relatively high specific surface areas. In addition, the positions of characteristic diffraction peaks and the corresponding crystal planes are distinguishable for different crystalline types of MnO2, indicating that they have various main exposed crystal planes. The crystal size calculated by the XRD patterns are given in Table 1.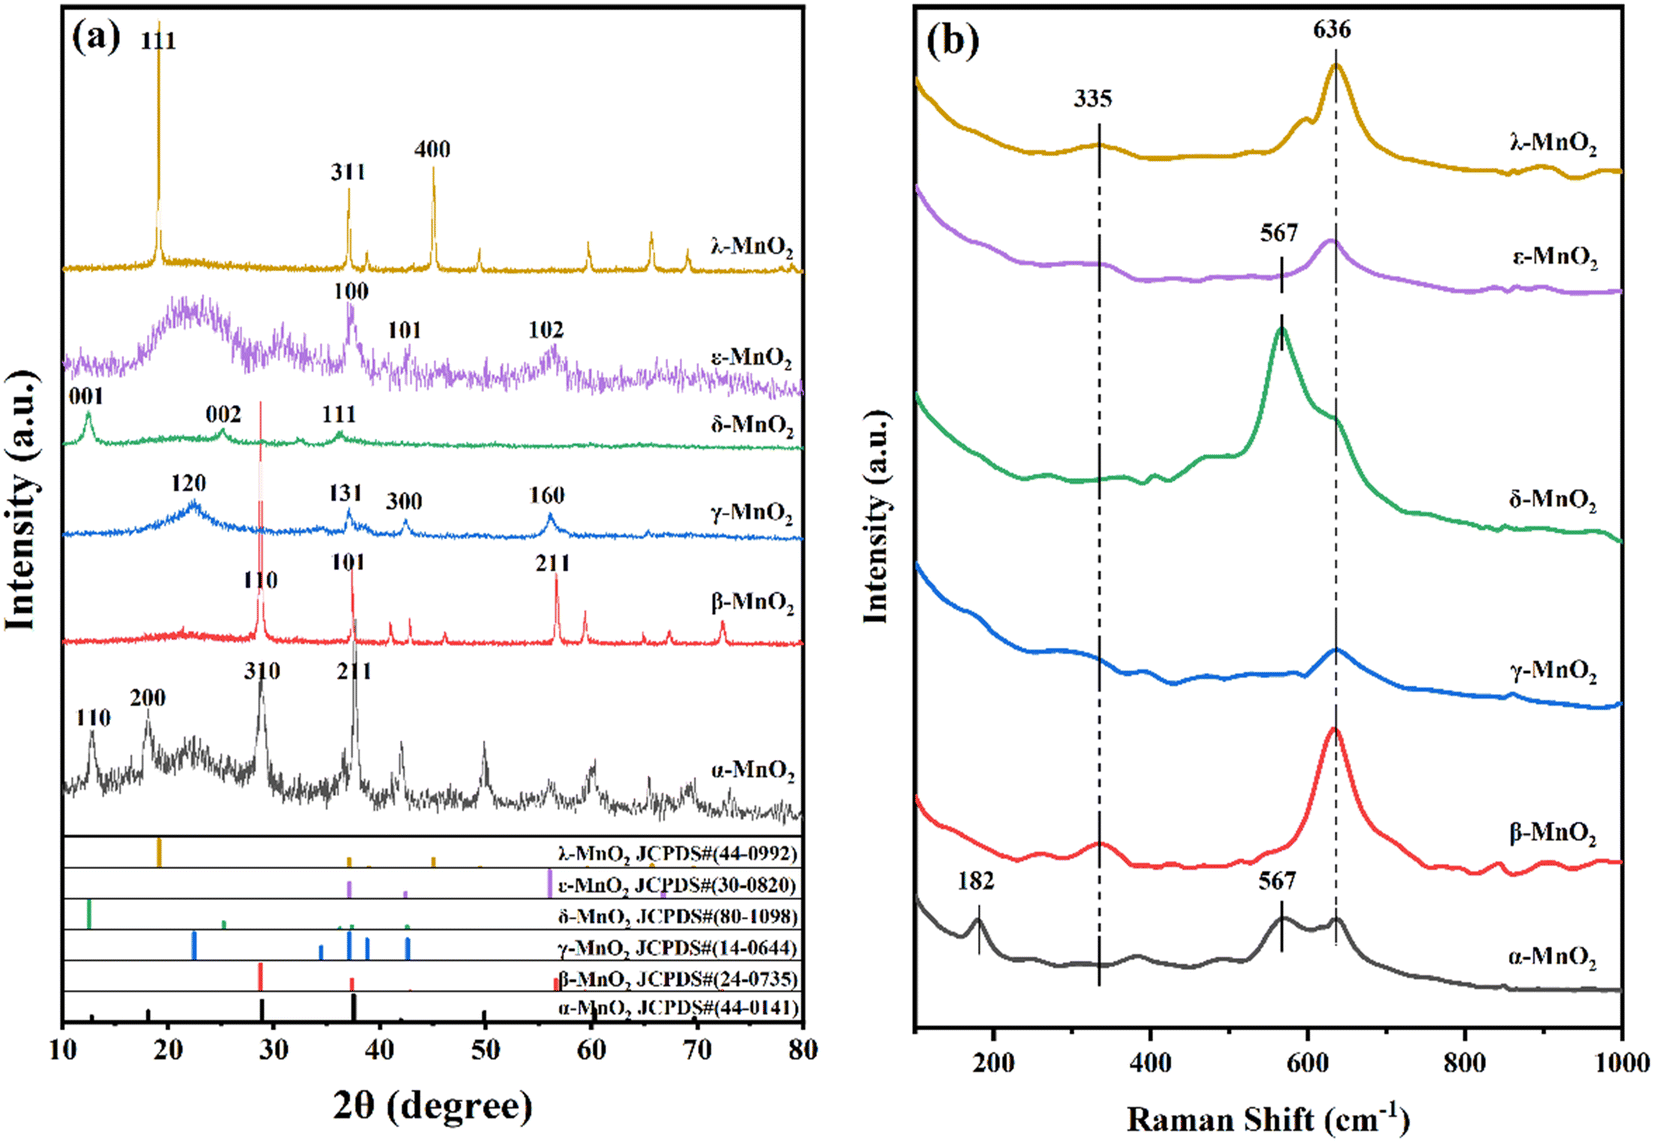 | ||
| Fig. 2 (a) XRD patterns and (b) Raman profiles of six crystal types of MnO2 samples. | ||
| Samples | S BET (m2 g−1) | Pore volume (cm3 g−1) | Average pore sizeb (nm) | Crystal sizec (Å) |
|---|---|---|---|---|
| a The SBET is calculated by micropore BET assistant. b The average pore size is calculated through BJH method by the desorption data. c The crystal size is calculated by Scherrer's formula. | ||||
| α-MnO2 | 58.41 | 0.28 | 17.42 | 3.10 |
| β-MnO2 | 19.99 | 0.08 | 3.05 | 5.11 |
| γ-MnO2 | 63.39 | 0.37 | 9.55 | 2.40 |
| δ-MnO2 | 76.06 | 0.30 | 17.47 | 7.09 |
| ε-MnO2 | 199.48 | 0.39 | 6.55 | 2.38 |
| λ-MnO2 | 25.54 | 0.09 | 3.82 | 4.65 |
Raman profiles (Fig. 2b) show that all the MnO2-type materials synthesized have two diagnostic Raman scattering (RS) bands at 335 and 636 cm−1 belonging to the symmetry of Ag from the vibrations of the [MnO6] octahedron within the framework of the tetragonal dolomite-type frameworks. Gao et al.32–34 reported that the vibrational bands are essentially related to the property of the channel structure. The strongest band at 636 cm−1 is assigned with the (1 × 1) tunnel structure formed by the [MnO6] octahedron of the tetragonal rutile framework, while the two vibrational bands at 182 and 567 cm−1 are related to the large pore structure (δ-, ε-MnO2: interlayer pore, α-MnO2: 2 × 2 tunneling structure) formed by the introduction of K+ ions.31 In particular, the vibrational band at 182 cm−1 is attributed to the (2 × 2) tunneling structure, which is unique to α-MnO2. The generation of oxygen vacancies leads to the breakage of Mn–O bonds in the samples, resulting in lower peak intensities in the Raman spectra.35 Therefore, the oxygen vacancies can be identified indirectly by examining the peak areas of the characteristic peaks (636 cm−1) in the Raman spectra. Semiquantitative analysis of the peaks (Table S1†) reveals that the peak area corresponding to the signal intensity generated by the vibration of the Mn–O bond of ε-MnO2 is significantly smaller than those of the other crystalline forms. This observation leads to the inference that its oxygen vacancy content is the highest among all the crystalline forms.
The type and size of tunnels, BET surface areas (SBET), pore volumes and pore size distributions of the six catalysts are shown in Table 1 and Fig. S3.† Based on the nitrogen adsorption–desorption isothermal curves (Fig. S3†), the SBET of the six catalysts decreased in the following order: ε-MnO2 > δ-MnO2 > γ-MnO2 > α-MnO2 > λ-MnO2 > β-MnO2. Among them, the SBET of ε-MnO2 reached 199.48 m2 g−1, which is the largest of the six crystalline types. All six crystal types of MnO2 have more pronounced hysteresis loops, and their adsorption isotherms are always type IV isotherms. Among them, the hysteresis loops of α-MnO2, β-MnO2, γ-MnO2, and λ-MnO2, without any saturated adsorption platform, all belong to the H3-type hysteresis loops, indicating that their pore structures are highly irregular. Besides, the typical H2-type hysteresis loop isotherm of ε-MnO2 shows an obvious saturated adsorption platform, reflecting its large number of mesoporous structures. For δ-MnO2, its H3-type hysteresis loop has no platform and no clear mesoporous structure, while its hysteresis loop has a wide relative pressure range, implying that its mesoporous structure is a pseudopore formed by the secondary construction of lamellar particles due to the layer structure.36 From the pore-size-distribution curves, it can be found that the pore-size distributions of α-MnO2, γ-MnO2, δ-MnO2, and ε-MnO2 are dominated by mesopores, with the average pore sizes ranging from 6.55 to 17.47 nm.
Among the six crystalline types, ε-MnO2 has the highest pore volume (0.39 cm3 g−1). The specific surface area and average pore sizes of β-MnO2 and λ-MnO2 are relatively small coupled with the fact that its pore capacity is also extremely low. We infer that β-MnO2 and λ-MnO2 have less cavity in their structures. The kinetic diameter of O3 molecule is about 2.2 Å, which is much smaller than the average pore size of the as-prepared samples, and thus the pore size effect on molecule diffusion is totally excluded. The large pore volume of ε-MnO2 associated with higher surface area (199.48 m2 g−1) usually provides more active sites, whereas the smaller pore volume of β-MnO2 and λ-MnO2 associated with a lower surface area (19.99 m2 g−1 and 25.54 m2 g−1) makes it more difficult to provide sufficient oxygen vacancies.
3.2 Crystal structure
The SEM and HRTEM images of the samples are shown in Fig. 3. As can be seen from the SEM images (Fig. 3a1–f1), the structures of α-MnO2 (Fig. S4a†), β-MnO2, and γ-MnO2 are essentially similar and all of them are spheres composed of straight rods or needles with diverse lengths, which is because they belong to the same one-dimensional structure. On the other hand, δ-MnO2 and ε-MnO2 are spheres composed of flower-like flakes or thicker plates, which is due to the fact that δ-MnO2 and ε-MnO2 belong to a two-dimensional lamellar structure. In contrast, λ-MnO2 is a three-dimensional structure formed by the accumulation of irregular small particle spheres. The difference in the morphologies among α-MnO2, β-MnO2, and γ-MnO2 is that the spheres of β-MnO2 (10–15 μm) exhibit a relatively large size, whereas those of α-MnO2 and γ-MnO2 (4–6 μm) display small ones. Besides, α-MnO2 and γ-MnO2 are comprised by nanorods with diameters of 20–80 nm and 10–15 nm (Fig. S4a and c†), while β-MnO2 is composed of rods with large diameters of 100–150 nm and lengths of 1.0 μm (Fig. S4b†). Generally, among these one-dimensional MnO2, a higher specific surface area is essentially correlated with a smaller diameter of primary rods and size of secondary constructed spheres. Moreover, the petal-like units comprising δ-MnO2 have diameters in the range of 150–200 nm and thicknesses in the range of 10 nm (Fig. S4d†). On the other hand, the plates constituting ε-MnO2 have a thickness of about 60 nm (Fig. S4e†). The secondary structure of λ-MnO2 has a domain in the range of 150–350 nm and a thickness of approximately 30 nm (Fig. S4f†). | ||
| Fig. 3 SEM images of (a1) α-MnO2, (b1) β-MnO2, (c1) γ-MnO2, (d1) δ-MnO2, (e1) ε-MnO2 and (f1) λ-MnO2 as well as HRTEM images of (a2 and a3) α-MnO2, (b2 and b3) β-MnO2, (c2 and c3) γ-MnO2, (d2 and d3) δ-MnO2, (e2 and e3) ε-MnO2 and (f2 and f3) λ-MnO2 samples. | ||
Based on the TEM images (Fig. 3a2–f2), the lattice fringes of various types of MnO2 crystals can be clearly seen. In the case of α-MnO2, the main lattice fringes with a width of 6.90 Å corresponding to the (1 1 0) crystal planes are clearly observed. As for β-MnO2, the main lattice fringes with a width of 3.10 Å corresponding to the (1 1 0) crystal planes are visible. For γ-MnO2, lattice stripes with a width of 2.42 Å corresponding to the (1 3 1) crystal plane are distinguishable in a large number. In the lamellar δ-MnO2, the main exposed surface is only the (0 0 1) crystal facet with a lattice stripe of 7.06 Å, which is related to its laminar structure, as depicted by its TEM image. In the case of ε-MnO2, the HRTEM images reveal a multitude of distinctive lattice fringes. The highest number of (1 0 2) crystalline facets is found to correspond with a width of 0.16 nm, which is in alignment with the findings of earlier research.37 Meanwhile, the (1 0 0) crystalline facets, displaying a width of 0.24 nm, can also be found. The lattice fringes of λ-MnO2 are dominated by the (1 1 1) facet with a width of 4.61 Å. In addition, significant discontinuities can be observed in the lattice fringes in the HRTEM images (Fig. 3a3–f3). When the concentration of defects is sufficiently high, a defect layer is formed, which leads to lattice fringe blurring, as observed in the HRTEM images (Fig. 3a3–f3). In comparison with the other samples, the lattice fringes of ε-MnO2 shows sever discontinuities and are more blurred, which indicates a large number of defects existing in ε-MnO2. Meanwhile, β-MnO2, δ-MnO2, and λ-MnO2 have fewer breaks in the lattice fringes in their HRTEM images, indicating that its defect sites are less abundant.
3.3 Valence analysis
Fig. 4 shows the XPS spectra of six MnO2 crystals obtained by analyzing the chemical state and surface composition of the as-prepared samples using X-ray photoelectron spectroscopy (XPS). It is worth noting that the samples were calcined before this XPS experiment and the chemisorbed water existing in the original sample was completely eliminated; thus, no obvious peaks of chemisorbed water appeared in the position above 532.4 eV. The peaks of O 1s spectra (Fig. 4a) can be divided into two regions. The binding energies in the range from 529.6 to 530.0 eV are attributed to lattice oxygen (Olatt),38,39 which constitute the bulk-phase oxygen in the crystalline structure. The binding energies in the range from 530.6 to 531.4 eV are attributed to surface adsorbed oxygens (Oads), a class of oxygen species that can favor the catalytic reaction, including species such as O2−, O−, and O22−, which naturally form chemical bonds around surface oxygen vacancies.40,41 The amount of Oads reflects the concentration of oxygen vacancies in the sample. From the quantitative analysis listed in Table 2, it can be seen that the content of surface-adsorbed oxygen (Oads) of ε-MnO2 is the most abundant, accounting for 45% of the total oxygen species, indicating that there are abundant oxygen vacancies on the surface of ε-MnO2.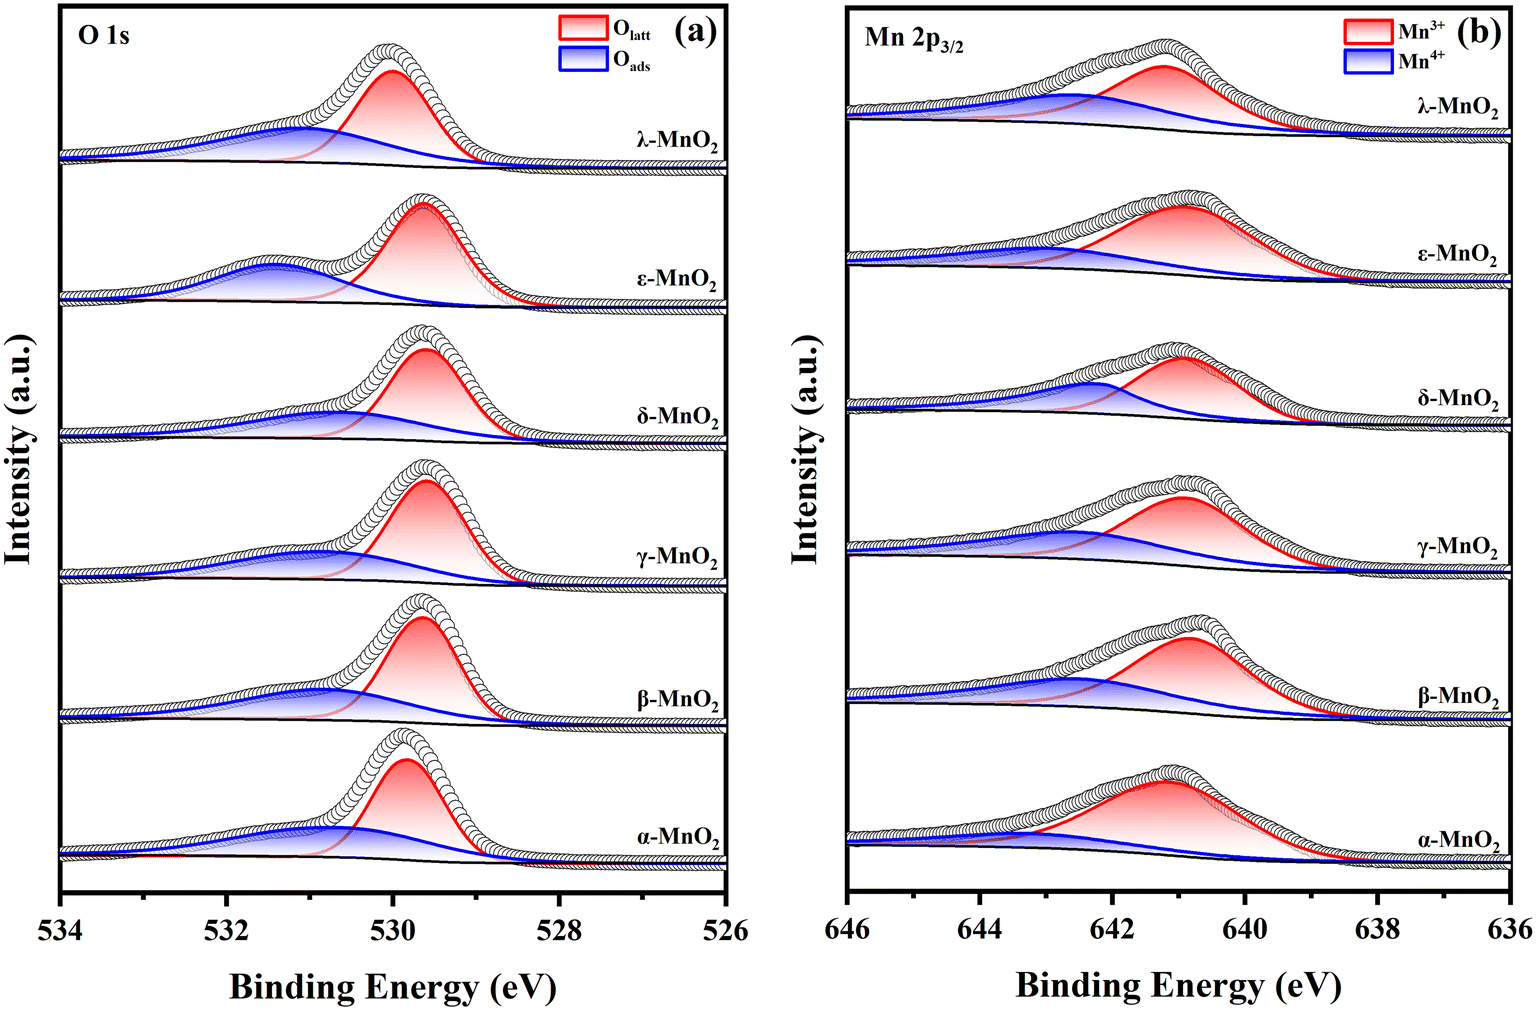 | ||
| Fig. 4 O 1s (a) and Mn 2p3/2 (b) XPS spectra of MnO2 samples. | ||
| Mn3+ (×103) | Mn4+ (×103) | Mn3+/Mn4+ | Oads (×104) | Olatt (×104) | Oads/Olatt | ΔES | AOS | |
|---|---|---|---|---|---|---|---|---|
| α-MnO2 | 10.30 | 6.00 | 1.72 | 7.29 | 15.33 | 0.47 | 5.21 | 3.09 |
| β-MnO2 | 8.12 | 6.94 | 1.17 | 1.25 | 4.01 | 0.30 | 4.65 | 3.72 |
| γ-MnO2 | 10.33 | 7.28 | 1.42 | 6.24 | 15.92 | 0.39 | 5.11 | 3.20 |
| δ-MnO2 | 8.12 | 4.85 | 1.40 | 5.14 | 15.47 | 0.33 | 4.80 | 3.55 |
| ε-MnO2 | 10.85 | 6.28 | 1.73 | 8.16 | 15.00 | 0.54 | 5.42 | 2.85 |
| λ-MnO2 | 6.34 | 5.54 | 1.26 | 5.07 | 17.49 | 0.29 | 4.88 | 3.46 |
The peaks of Mn 2p3/2 (Fig. 4b) near 640.9 eV and 643.1 eV can be attributed to surface Mn3+ and Mn4+, respectively.42–44 It is known that when Mn3+ is included in the oxide skeleton, ionic vacancies are formed on manganese dioxide in order to satisfy the charge balance.45 Therefore, the content of Mn3+ is often considered as an indicator of surface oxygen vacancies. Among all crystalline types of MnO2, α-MnO2 and ε-MnO2 have the highest content of Mn3+ (63%), which indicates a higher content of oxygen vacancies. In addition, due to the formation of oxygen vacancies, the Mn4+–O bond is more stable than the Mn3+–O bond.46 The quantitative results indicate that both α-MnO2 and ε-MnO2 have abundant Mn3+ ions, which means that they have abundant unstable Mn–O bonds on their surfaces. At the same time, the molecular or atomic oxygen species adsorbed upon these surfaces with more Mn3+ are more likely to be released and participate in the catalytic decomposition of ozone. Similarly, the presence of lowly valent manganese on the surface can promote the dissociation and activation of surrounding oxygen species.47
The average oxidation state (AOS) of manganese was calculated based on the bimodal split spacing (ΔES) of the Mn 3s spectra (Fig. S5†) by the following equation.
| AOS = 8.956 − 1.126ΔEs | (2) |
| Temperature/°C | H2 consumption (mmol g−1) | ||||||
|---|---|---|---|---|---|---|---|
| Peak α | Peak β | Peak γ | Peak α | Peak β | Peak γ | Total | |
| α-MnO2 | 298.0 | 315.2 | 337.6 | 2.29 | 3.91 | 2.95 | 9.16 |
| β-MnO2 | 316.1 | 333.7 | 426.6 | 3.94 | 3.14 | 4.33 | 11.42 |
| γ-MnO2 | 299.1 | 336.7 | 443.3 | 0.81 | 4.62 | 3.85 | 9.28 |
| δ-MnO2 | 306.0 | — | 338.9 | 3.88 | — | 7.44 | 11.32 |
| ε-MnO2 | 296.2 | 314.2 | 407.5 | 3.46 | 1.42 | 3.29 | 8.18 |
| λ-MnO2 | 334.4 | 359.1 | 462.3 | 4.54 | 2.53 | 4.04 | 11.10 |
3.4 Temperature-programmed analysis
The H2-TPR curves of the six MnO2 samples are shown in Fig. 5a. As the temperature continues to rise, the reduction process of MnO2 can be divided into three parts. (α): MnO2 → Mn2O3 (Mn4+ → Mn3+), (β): Mn2O3 → Mn3O4 (Mn3+ → Mn3+, Mn2+), (γ): Mn3O4 → MnO (Mn3+, Mn2+ → Mn2+). The reduction peaks are due to the gradual reduction of MnO2 to Mn2O3/Mn3O4 and MnO, and the lower temperature of the first reduction peak indicates the better redox properties of the catalyst. The order of the low-temperature reduction peaks for the six types of crystals is ε-MnO2 (296.2 °C) < α-MnO2 (298.0 °C) < γ-MnO2 (299.1 °C) < δ-MnO2 (306.0 °C) < β-MnO2 (316.1 °C) < λ-MnO2 (334.4 °C). The hydrogen consumption of each crystal type can be calculated by quantitative analysis, as shown in Table 3. The theoretical hydrogen consumption of reduction from MnO2 to MnO is 11.5 mmol g−1. However, the hydrogen consumption of all the as-prepared samples is lower than the theoretical hydrogen consumption of MnO2 to MnO, indicating the original presence of a certain amount of Mn3+ in the samples,47,48 which is related to the oxygen vacancies. Among them, ε-MnO2 has the lowest hydrogen consumption, indicating that its Mn3+ content is the highest among all the samples, which is in accordance with the findings of previous XPS analysis. | ||
| Fig. 5 H2-TPR (a) and O2-TPD (b) curves for the MnO2 samples. | ||
The adsorbed oxygen species over each type of crystal MnO2 were investigated by O2-TPD, and the results are shown in Fig. 5b. The desorption peaks below 400 °C are usually considered to be due to the desorption of α-O2, which is related to surface molecular oxygen species.49–53 The desorption peaks from 400 to 700 °C are due to the liberation of β-O2, which is associated with surface lattice oxygen. The desorption peaks above 700 °C are due to the release of lattice oxygen diffused from the bulk. It is generally accepted that active physisorbed oxygen can be removed from the surface at low temperatures.54 Herein, α-O2 desorption with temperature below 400 °C was hardly observed. According to the β-O2 peaks from 400 °C to 700 °C, the six types of MnO2 are in the order ε-MnO2 (501 °C) < γ-MnO2 (543 °C) < α-MnO2 (548 °C) < λ-MnO2 (596 °C) < δ-MnO2 (598 °C) < β-MnO2 (679 °C). Earlier peaks indicate it is easier for the Mn–O bond to be broken up, thus leading to the greater mobility of surface lattice oxygen for oxygen vacancy formation. With the lowest β-O2 peak, ε-MnO2 has a greater mobility of lattice oxygen, which may lead to the more formation of oxygen vacancies and surface-active species to participate in the reaction.49 The quantitative analysis of O2-TPD is listed in Table S2.† It shows that ε-MnO2 corresponds to the β-O2 peak with the largest area, indicating the highest exchange of lattice oxygen. According to a former study,55 the transformation of α-, β-, γ-, δ- and λ-MnO2 to Mn2O3 occurs at about 500 °C. However, the initiation of the β-O2 peak of ε-MnO2 is at about 350 °C, which supports its high oxygen mobility.
To further investigate the oxygen exchange behaviors, we performed TPOIE experiments. The as-prepared samples followed a heterogeneous exchange mechanism, which means the exchange of one oxygen atom at a time.36 The isotopic exchange curves of each sample is shown in Fig. S6.† The reaction of the TPOIE process is shown in the following formulas.
| 18O18O(g) + Mn–16O(s) ⇔ 18O16O(g) + Mn–18O(ads) | (3) |
| 18O16O(g) + Mn–16O(s) ⇔ 16O16O(g) + Mn–18O(ads) | (4) |
Here, (s), (g) and (ads) refer to the lattice oxygen in solid phase, gaseous oxygen and the adsorbed molecular oxygen, respectively. The showing curves of 18O16O resulted in the exchange between the lattice O of Mn–16O and 18O2. Additionally, the curves of 16O2 resulted in the exchange between 18O16O and Mn–16O2. The 18O16O isotopic exchange curves of α-MnO2 showed that it has a fast exchange rate among all the samples, proving its best oxygen mobility. Meanwhile, β-, γ- and ε-MnO2 showed the maximum value of 18O16O, which meant they can also reach the isotopic exchange balance. It is noteworthy that the lower corresponding temperature of the maximum value of 18O16O indicates the better oxygen mobility, suggesting that oxygen mobility at low temperatures follows the order ε-MnO2 > γ-MnO2 > β-MnO2 > λ-MnO2. In addition, the total 18O16O exchange of λ-MnO2 and δ-MnO2 is lower than that of 16O2, indicating that they have relative weak oxygen mobility and are insufficient to reach the exchange equilibrium of the first step.
The number of oxygen atoms exchanged (Ne) and the rate of oxygen exchange (Re) with increasing temperature are shown in Fig. 6. As shown in Fig. 6a, the Ne is different for various crystal types. Among them, ε-, γ- and α-MnO2 have the maximum exchange volume, while β-, λ- and δ-MnO2 have a relatively low exchange ability. Generally, a larger specific surface area allows for the optimal release and utilization of both surface adsorbed oxygens and lattice oxygens, resulting in an enhanced exchange capacity,56 which may be one of the reasons for the higher exchange capacity of ε-MnO2.
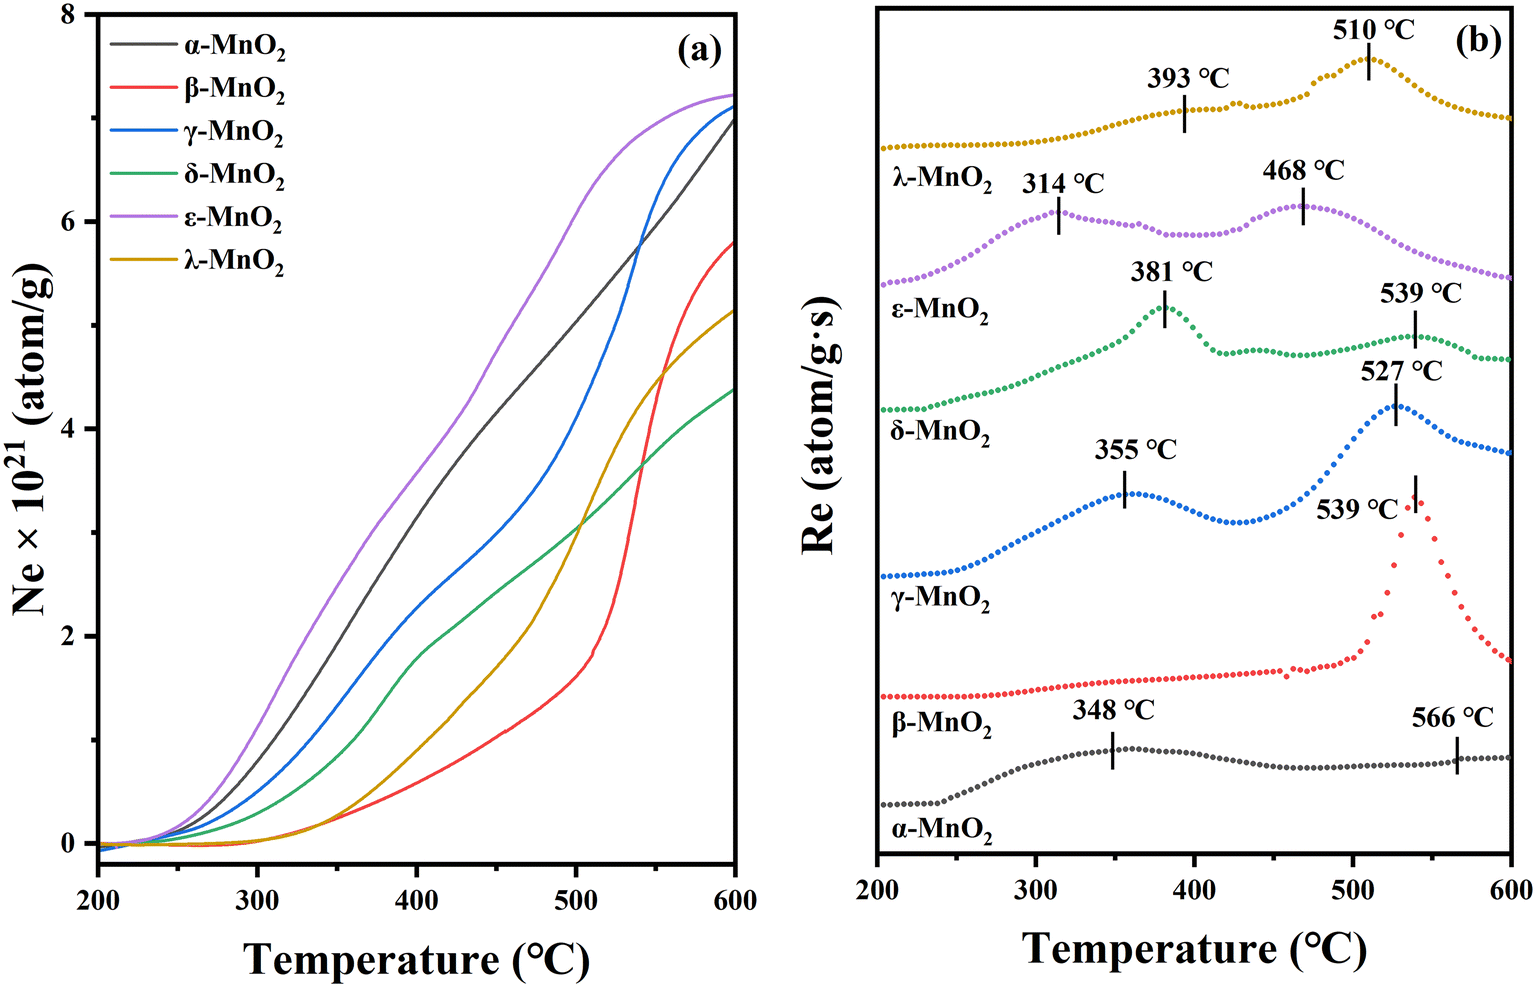 | ||
| Fig. 6 (a) The total number of exchanged 18O (Ne) curves and (b) the exchange rate (Re) with the temperature of MnO2 samples. | ||
The disparity in oxygen migration ability of different crystalline catalysts can be further investigated based on the Re curve in Fig. 6b. In the experimental temperature range, the maximum exchange rate Remax occurs when the exchange of gas and solid phases appears to be in equilibrium. Consequently, the oxygen mobility of the samples can be evaluated based on the temperature corresponding to Remax. This implies that the lower temperature for Remax associated with the higher oxygen-mobility rate. Therefore, the oxygen migration rates in these samples are in the following order: α-MnO2 > ε-MnO2 > γ-MnO2 > δ-MnO2 > λ-MnO2 > β-MnO2. As the temperature increases, a second extreme point will exist for some of the crystalline forms, while the corresponding temperature exhibits the mobility of the lattice oxygen, and it can be clearly seen that α-MnO2 and ε-MnO2 correspond to better mobility of the lattice oxygens, which is in good agreement with the previous results of O2-TPD.
3.5 DFT calculation
As mentioned earlier, various MnO2 correspond to different exposed surfaces. We therefore constructed separate models for the exposed crystal facets of manganese oxide, as shown in Fig. S8.† It is suggested that the formation of oxygen vacancies may be due to the easy loss of lattice oxygen and thereafter the generation of large amounts of surface reactive oxygen species adsorbed upon these ionic vacancies, which facilitates the corresponding redox reactions.40 Therefore, the ease of oxygen vacancy formation theoretically supports the presence of large amounts of surface reactive oxygen species. Combined with the previous characterization, the Mn3+ content of different crystalline forms can be observed by XPS and H2-TPR, which indicated the oxygen vacancies content. However, whether the oxygen vacancies are easy to form or not depends essentially on the oxygen formation energy. In order to assess the difficulty of oxygen vacancy formation in each crystal type of MnO2, we calculated the oxygen-vacancy-formation energy of each crystal type based on density functional theory crystallography up to the first-principle calculations. | (5) |
| Crystal plane | E vf (eV) | |
|---|---|---|
| α-MnO2 | (1 1 0) | 0.46 |
| β-MnO2 | (1 1 0) | 2.12 |
| γ-MnO2 | (1 3 1) | 0.82 |
| δ-MnO2 | (0 0 1) | 3.35 |
| ε-MnO2 | (1 0 2) | 0.20 |
| λ-MnO2 | (1 1 1) | 0.67 |
The order of oxygen vacancy formation energy is ε-MnO2 < α-MnO2 < λ-MnO2 < γ-MnO2 < β-MnO2 < δ-MnO2. The lower the absolute value of the oxygen vacancy formation energy is, the easier it is to form oxygen vacancies becomes. This is basically consistent with the previous characterization results.57 Compared with other samples, the ε-MnO2 sample is more prone to produce oxygen vacancies. Meanwhile, for δ-MnO2 and β-MnO2, the formation energies of oxygen vacancies are very large, which would make it difficult to generate oxygen vacancies in the reaction. It is noteworthy that the primary cell structure of δ-MnO2 and ε-MnO2 is from the same precursor,19,31,58 but the different crystal planes dominantly exposed [δ-MnO2 (1 1 0), ε-MnO2 (1 0 2)] (Fig. S9†) lead to a huge difference in the energies for oxygen-vacancy formation. It suggests that the distinct surface facets can have a great influence on the catalytic behaviors in ozone decomposition.
Additionally, as shown in Fig. 7, by comparing the structures before and after the calculation, it can be found that after the oxygen vacancies are created, there is a significant changing of the Mn–O bonds and Mn–Mn bonds around the oxygen vacancies, showing a clear Jahn–Teller effect.59 This disorder change of the crystal structure makes it easier for activated lattice oxygen to participate in the reaction.
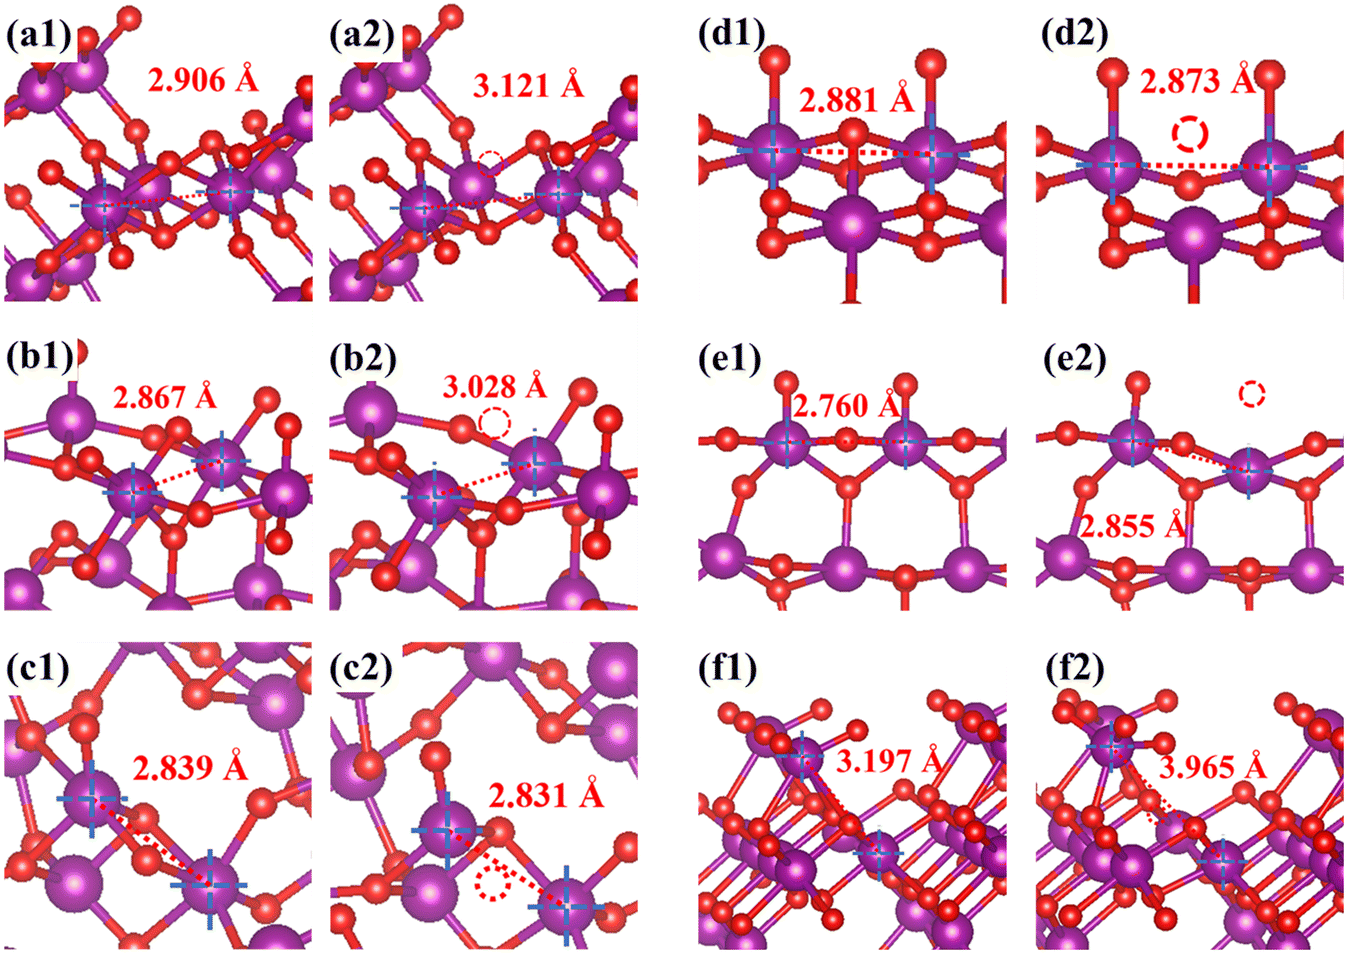 | ||
| Fig. 7 Changes in the structural and bond length between two neighboring Mn atoms before and after oxygen vacancy formations: (a1 and a2) α-, (b1 and b2) β-, (c1 and c2) γ-, (d1 and d2) δ-, (e1 and e2) ε- and (f1 and f2) λ-MnO2. | ||
In order to further investigate the interaction of O3 with MnO2, we used the nudged elastic band (NEB) method to carry out a search for the transition state of O3 from adsorption to bond cleavage. Based on the methodology of NEB transition state search, we performed calculations for the top three samples with the superior activity. The results of the calculation are shown in Fig. 8.
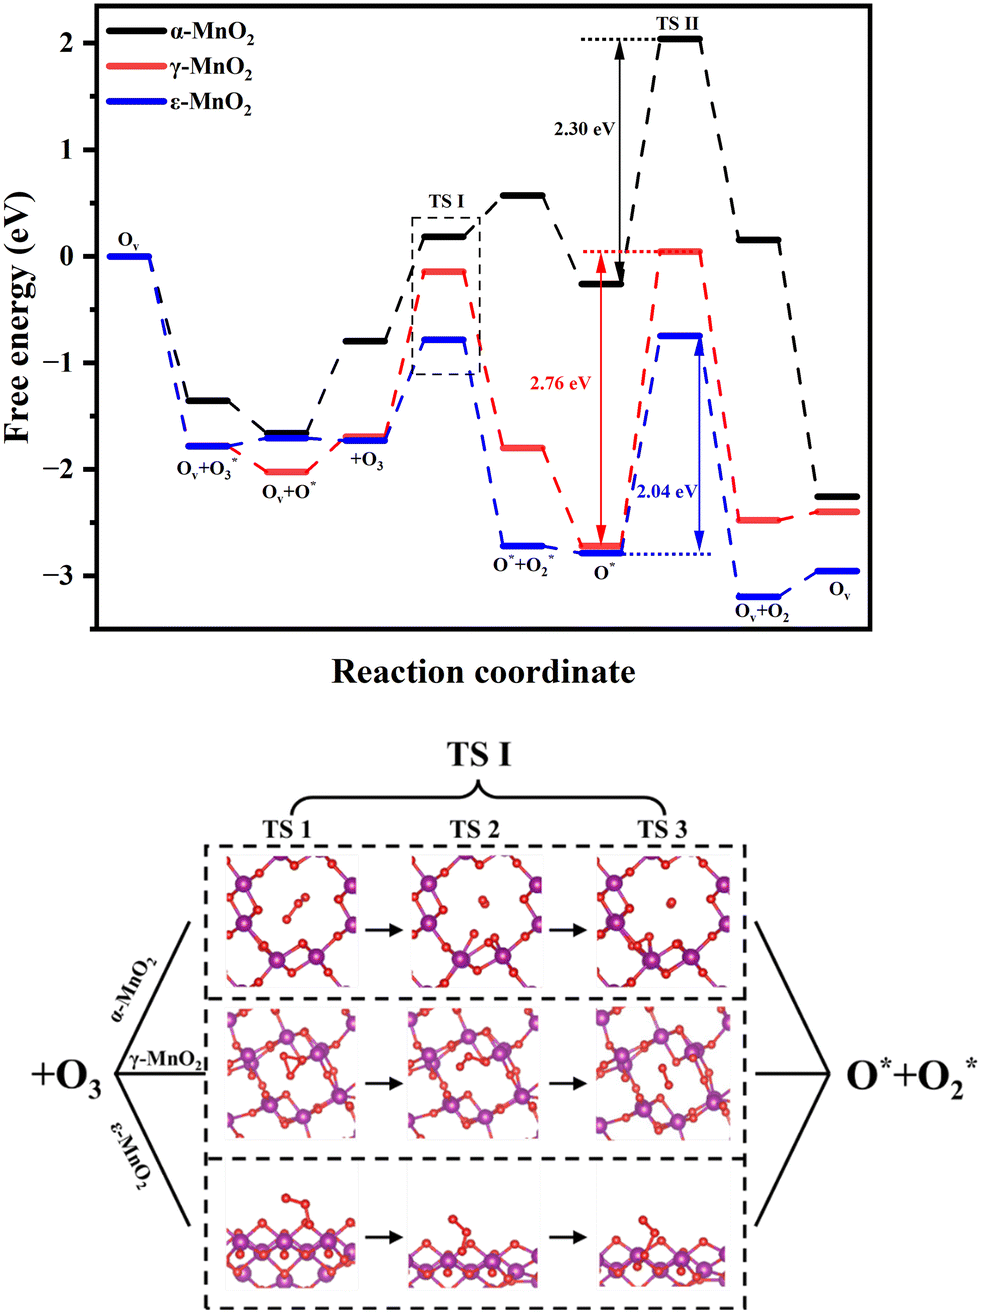 | ||
| Fig. 8 Free energy during the reaction coordinate and the specific process of the reaction of O3 with MnO2. | ||
The reaction paths are essentially the same for α-MnO2 and ε-MnO2. However, there is a little difference in the first O3 adsorption. The reaction of the first O3 with MnO2 is illustrated by Fig. 8. First, O3 adsorbed on the surface shifts to some extent, and after reaching a certain position, one of the O–O bonds elongates and breaks after a certain length, forming O2· and O·. Subsequently, O· binds to the crystal and O2· escapes. The reaction of γ-MnO2 with O3 is different: first, the O3 adsorbed on the indicated rotates, the bond angle initially becomes smaller, and O–O bond breakage occurs after the displacement until it is suitable. This phenomenon should be attributed to their difference in pore tunnels. γ-MnO2 has predominantly (1 × 2) and (1 × 1) tunnels, where the extension of the O3 bond is limited by the pore structure at this exposed crystal surface; thus, the O–O bond, which should have been elongated and then broken, led to a change in the bond angle. Similarly, Chen et al.60 observed that MnO2 with the (2 × 2) tunnel structure is much more active than MnO2 with the (1 × 1) structure since the effective diameter of the (2 × 2) tunnel is more suitable. Galliez demonstrated that the hydrogen trapping reaction by γ-MnO2 is also limited by the tunnels via DFT calculations.61 This suggests that the appropriate pore aperture of MnO2 for ensuing O3 molecules to access the active sites through diffusion is an important factor in promoting the catalytic activity. Structurally, the (1 0 2) phase of ε-MnO2 exposed showed sufficient reaction sites, while the (1 3 1) phase of γ-MnO2 brings the limitation of bond-breaking of ozone. During the reaction, it can be seen that different crystal types differ in their reaction energy barriers. The height of the energy barrier (ΔEa) indicates the magnitude of the energy barrier that needs to be overcome to transform the reactants into products. The higher the energy barrier is, the more difficult the reaction becomes. According to our calculations, ε-MnO2 has the lowest reaction potential barrier (ΔEa = 0.95 eV), demonstrating that its reaction with O3 is rather easier to carry out. The energy barrier of γ-MnO2 (ΔEa = 1.55 eV) is significantly higher than those of α-MnO2 (ΔEa = 0.98 eV) and ε-MnO2, indicating that the reaction pathway of γ-MnO2 needs to overcome more energetic barriers and that the reaction is relatively more difficult to take place. We also performed transition state calculations for the O22− desorption process. As shown in Fig. 8, the transition state in the desorption of O22− showed higher energy barriers for all the three types of MnO2, indicating that the desorption of the O22− should be the decisive step. The O22− desorption energy is in order ε-MnO2 (2.04 eV) < α-MnO2 (2.30 eV) < γ-MnO2 (2.76 eV). It can be seen that for both ozone adsorption and O22− desorption, ε-MnO2 has the minimal energy barrier, suggesting its high activity in catalytic ozone decomposition.
The mechanism of MnO2 in catalytic ozone decomposition is described as follows. First, O3 absorbed on the bulk with oxygen vacancies (Ov), filled the oxygen vacancies to form a perfect bulk and O3 rapidly broke bonds. In order to satisfy the charge balance, electrons from Mn3+ are transferred to the O atoms to form O2− (eqn (6)). After the desorption of O2, another O3 is absorbed on the perfect bulk. Subsequently, the O–O bond in O3 breaks to form O2 and gets out of the bulk, forming a perfect cell. Moreover, O2− in the lattice loses an electron, which transfers to O*, forming O22− (eqn (7)). Finally, each O22− gives two electrons to the two nearby Mn4+ into oxygen desorption while restoring the oxygen vacancies (eqn (8)). If the O22− formed during the reaction is not released in time to restore the oxygen vacancies, the reaction rate would be slowed down. Actually, the activation energy (ΔEa) for O22− desorption is much higher than that for O3 dissociation for the same crystalline form (ε-MnO2: 2.04 eV > 0.95 eV, α-MnO2: 2.30 eV > 0.98 eV, γ-MnO2: 2.76 eV > 1.55 eV). Therefore, the rate-determining step is O22− desorption to restore the surface oxygen vacancies.13,62,63 In the catalytic decomposition of ozone, molecular oxygen is primarily adsorbed on the oxygen vacancies on the surface of the samples, where it is successively decomposed to produce atomic oxygen and other surface activated oxygen species, including O2− and O22−, which participate in the overall reaction process. From the above mechanism, it is clear that oxygen vacancy is the key to promote the reaction.
| [Mn3+–Ov–Mn3+] + O3 → [Mn4+–O2−–Mn4+] + O2(g) | (6) |
| [Mn4+–O2−–Mn4+] + O3 → [Mn4+–O22−–Mn4+] + O2(g) | (7) |
| [Mn4+–O22−–Mn4+] → [Mn3+–Ov–Mn3+] + O2(g) | (8) |
3.6 Catalytic activity test
The catalytic performance of ozone decomposition over each type of MnO2 at room temperature was tested using a fixed-bed continuous flow reactor, and the results are shown in Fig. 9. It was seen that at 25 °C and 200 min reaction time, the activities of diverse crystal types for ozone decomposition are significantly different, decreasing in the order ε-MnO2 > α-MnO2 > γ-MnO2 > β-MnO2 ≈ δ-MnO2 > λ-MnO2. As seen from Fig. 9, ε-MnO2 has the highest activity, reaching 100% ozone depletion and this efficiency is maintained within 200 minutes. The catalytic activity of α-MnO2 was slightly stronger than that of γ-MnO2 after 200 minutes of the reaction. The activity for α-MnO2 and γ-MnO2 respectively decreased to 80% and 76%. The activities of β-MnO2 and δ-MnO2 exhibited diminished performance at a comparable level, with the activity declining to less than 30% after 200 minutes of reaction. For λ-MnO2, the rate of activity declined sharply at the initial stage of reaction and reached approximately 60% by 30 minutes. Thereafter, the rate of deactivation slowed and its reactivity dropped to 40% after 200 minutes. In order to study the stability of ε-MnO2, the long-term performance of ε-MnO2 was investigated in Fig. S7.† This best-performing ε-MnO2 can maintain complete O3 removal lasting for above 14 h.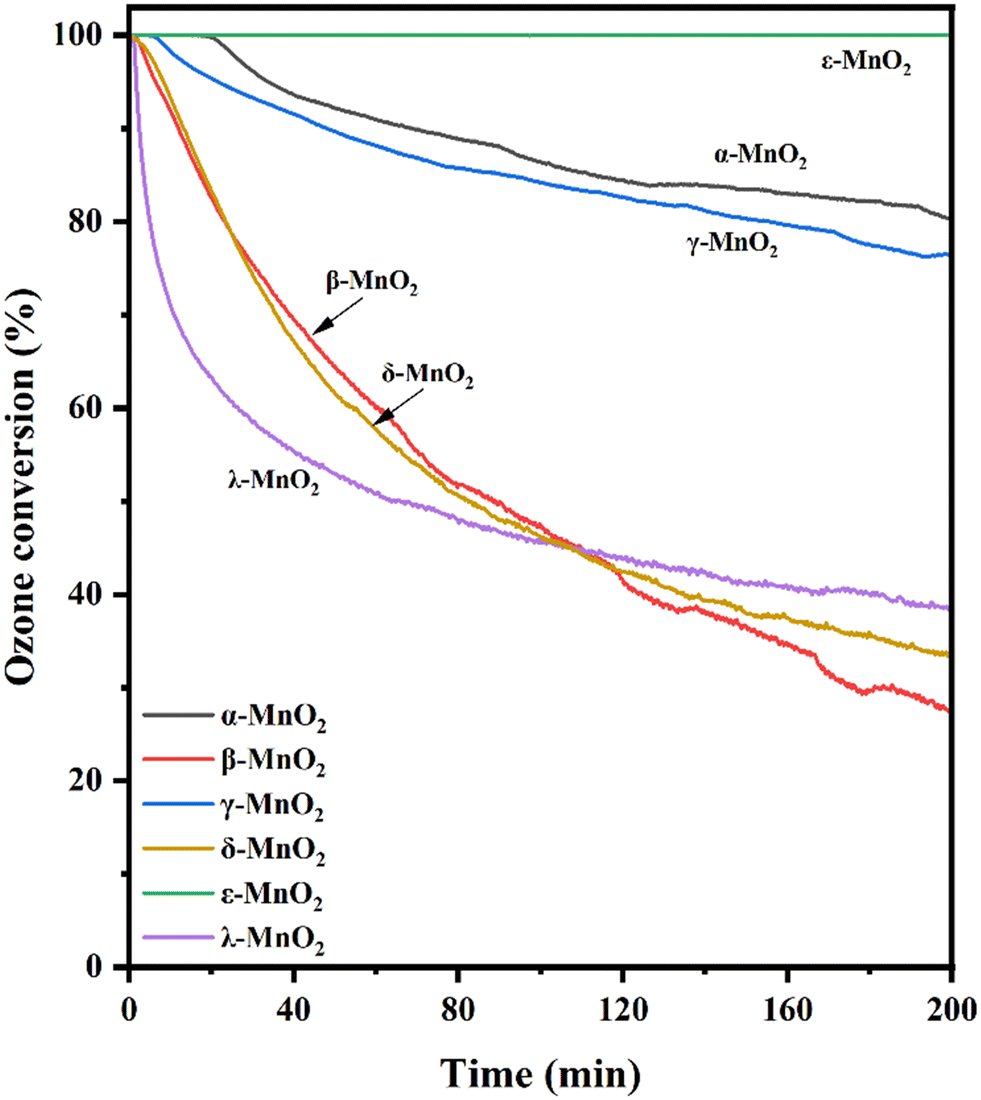 | ||
| Fig. 9 Reaction curves of catalyzed ozone over time at room temperature for each crystal type of the MnO2 samples (reaction conditions: initial ozone concentration: 25 °C, 40 ppm, RH = 0, catalyst mass 100 mg, GHSV = 5800 h−1). | ||
3.7 Correlation between structure and performance
As discussed in section 3.6, the catalytic activity test yielded the following order: ε-MnO2 > α-MnO2 > γ-MnO2 > β-MnO2 ≈ δ-MnO2 > λ-MnO2. The activity of MnO2 in the catalytic decomposition of ozone is the result of a multifactorial determination. Among them, oxygen vacancies are decisive for the fast reaction. Suitable exposed crystalline surfaces provide more oxygen vacancies and facilitate the catalytic reaction. The (1 0 2) facet on ε-MnO2 provides good exposure orientation, and with this crystal surface as the primary exposed surface, it is better able to participate in the catalytic removal of O3. In order to avoid the unobjective effect of discussing only by per surface area or per volume on the catalyst activity, we used the normalized reaction rate (Rnorm, the calculation details are displayed in the ESI,† Fig. S10) to evaluate the special activity of the catalyst with respect to surface area, and the results are given in Fig. S10.† The order of Rnorm for each catalyst is consistent with the order of activity with respect to volume. In addition, by comparing the specific surface areas of β- and δ-MnO2, we can infer that although the surface area of β-MnO2 (19.99 m2 g−1) is significantly lower than that of δ-MnO2 (76.06 m2 g−1), the activity of these two catalysts is close to each other, which suggests that the specific surface area is not the decisive factor for the catalytic activity. Raman mapping shows that ε-MnO2 has the most defective sites (Table S1†), indicating that it has the highest content of oxygen vacancies. The XPS results show that ε-MnO2 is the best both in terms of the content in Mn3+ (Mn3+/Mn4+ = 1.73) and Oads (Oads/Olatt = 0.54), which corresponds with the Raman results. By calculating the oxygen-vacancy-formation energy, it was found that the oxygen-vacancy-formation energy of ε-MnO2 (0.20 eV) is significantly lower than those of other crystalline types, indicating that it is very susceptible to the formation of oxygen vacancies.The decisive step in the catalytic removal of ozone by MnO2 is the desorption of the peroxygenated species O22−. If the oxygen vacancies in one reaction cycle are not recovered in time, they will affect O3 adsorption in the next circular step. DFT calculations show that ε-MnO2 has the lowest activation energy required for the desorption of O22−, suggesting that it is more likely to desorb O22− and restore oxygen vacancies. The process of O22− desorption to form oxygen vacancies is also directly related to oxygen mobility. O2-TPD and TPOIE showed that ε-MnO2 exhibits the highest oxygen mobility, enabling the rapid removal of O22− to restore the oxygen vacancies.
As the rate-determining step, the desorption energy of O22− determines the whole reaction rate. Through the DFT calculation, we found that the best three samples have a significant discrepancy in the O22− desorption potentials, which is in order ε-MnO2 (2.04 eV) < α-MnO2 (2.30 eV) < γ-MnO2 (2.76 eV). This can well explain the active performance of ε-MnO2: due to the lower potential barrier (2.04 eV) in the rate-decisive step, the O22− generated during its reaction can be desorbed in time to restore the oxygen vacancies and start the cycle of the next reaction.
In addition to the decisive step of O22− desorption, the decomposition of molecular O3 on MnO2 is also crucial for the reaction. By calculating the transition states via the NEB method, we found that the decomposition mechanism of O3 by MnO2 of different crystalline types is different, which largely depends on its pore structure and exposed surface. When the pores are large enough (ε-MnO2 and α-MnO2), one of the O–O bonds in O3 elongates before breaking the bond. When the pore structure is limited (γ-MnO2), the decomposition of O3 leads to a reduction of the bond angle before its breakage. The activation energy of the decomposition process of adsorbed O3 is in the order ε-MnO2 < α-MnO2 < γ-MnO2. This is also the same order as the activity and the energy barrier of the rate-determining step.
Elsewhere, the large specific surface area of ε-MnO2 (199.48 m2 g−1) leads to a high exposure of the crystal surface, resulting in the formation of more oxygen vacancies. On the other hand, the SBET of δ-MnO2 (76.06 m2 g−1) is higher than that of β-MnO2 (19.99 m2 g−1), but there is no significant activity difference between them; thus, SBET is not the decisive factor in ozone decomposition. The large pore volume of ε-MnO2 (0.39 cm3 g−1) is able to accommodate more reactants and products, and its suitable pore size (6.55 nm) provides a high specific surface area without limiting the diffusion of O3.
4. Conclusion
In this study, six types of MnO2 (α-, β-, γ-, δ-, ε- and λ-MnO2) catalysts were synthesized for ozone removal. Compared to other Mn-based catalysts reported in the literature (Table S4†), the as-prepared ε-MnO2 in this study performs outstanding behaviors in ozone removal. In summary, the room-temperature decomposition of ozone over MnO2 is dominated by a combination of multiple factors. The different facets of crystals have various structures, which also determines that the exposed surfaces are essentially distinguishable, which has important implications in catalytic O3 decomposition. The HRTEM images showed their respective exposed crystal surfaces, which enclose different capacities for ozone adsorption and reaction sites. Among all types of MnO2, ε-MnO2 shows the best O3 decomposition activity under the ambient conditions (25 °C, dry air). Compared with the other samples, it has the largest specific surface area, which provides a large number of adsorption sites. Moreover, its abundant oxygen vacancies play a crucial role in the ozone-decomposition process. The formation of oxygen vacancies associated with (1 0 2) facet leads to the partial distortion of the structure, weakening the Mn–O bonding energy; therefore, the lattice oxygen mobility is substantially increased. Raman analysis showed that a large number of oxygen vacancies existed in ε-MnO2. Its low average oxidation state (2.85), high Mn3+ content (Mn3+/Mn4+ = 1.73) and adsorbed oxygen content (Oads/Olatt = 0.54) were also verified by the Raman spectroscopy. In addition, good reducibility and strong oxygen mobility are also crucial for its high activity. DFT calculations reveal that it is easy for ε-MnO2 (Evf = 0.20 eV) to form oxygen vacancies. The calculations of the reaction pathway also showed that ε-MnO2 has minimal reaction activation energy whether at the decisive step of O22− decomposition (ΔEa = 2.04 eV) or O3 adsorption (ΔEa = 0.95 eV), thus supporting its high activity for ozone decomposition.This work elucidated the structure–performance relationship of MnO2 toward the catalytic decomposition of ozone at ordinary conditions and clarified the origin of high catalytic activity, and the reaction mechanism was also revealed by DFT calculations, which provides guidance for future research on MnO2-based materials toward the ozone purification.
Data availability
The data supporting this article have been included as part of the ESI.†Author contributions
Haotian Wu: conceptualization, methodology, investigation, validation, computation, writing – original draft. Runduo Zhang: writing – review and editing, supervision, and funding acquisition. Bin Kang: formal analysis. Xiaonan Guo: software. Zhaoying Di: methodology. Kun Wang: data curation. Jingbo Jia: validation. Ying Wei: methodology. Zhou-jun Wang: methodology.Conflicts of interest
The authors declare no conflict of interest.Acknowledgements
This work was supported by National Key Research and Development Program of China (2023YFC3905400), National Natural Science Foundation of China (No. 22176010), and the Fundamental Research Funds for the Central Universities (JD2405).References
- J. Jia, P. Zhang and L. Chen, The effect of morphology of α-MnO2 on catalytic decomposition of gaseous ozone, Catal. Sci. Technol., 2016, 6, 5841–5847 RSC.
- R. Atkinson, Atmospheric chemistry of VOCs and NOx, Atmos. Environ., 2000, 34, 2063–2101 CrossRef CAS.
- M. O. Fadeyi, Ozone in indoor environments: Research progress in the past 15 years, Sustain. Cities Soc., 2015, 18, 78–94 CrossRef.
- H. Wang, C. He, L. Morawska, P. McGarry and G. Johnson, Ozone-initiated particle formation, particle aging, and precursors in a laser printer, Environ. Sci. Technol., 2012, 46, 704–712 CrossRef CAS.
- A. Zukeran, Y. Ikeda, F. Mashimo, K. Yasumoto, M. Matsumoto and N. Matsumoto, Effect of collection efficiency and reducing ozone generation in an electrostatic precipitator with knife edge disk type electrode, J. Electrost., 2023, 125, 103842 CrossRef CAS.
- S. W. Benson and A. E. Axworthy, Jr., Mechanism of the Gas Phase, Thermal decomposition of ozone, J. Chem. Phys., 1957, 26, 1718–1726 CrossRef CAS.
- B. Dhandapani and S. T. Oyama, Gas phase ozone decomposition catalysts, Appl. Catal., B, 1997, 11, 129–166 CrossRef CAS.
- J. H. Hibben, I. The effect of radiation on the decomposition of ozone and nitrous oxide, J. Am. Chem. Soc., 1928, 50, 937–940 CrossRef CAS.
- P. Lee and J. Davidson, Evaluation of activated carbon filters for removal of ozone at the PPB level, Am. Ind. Hyg. Assoc. J., 1999, 60, 589–600 CrossRef CAS PubMed.
- C.-C. Lin, C.-Y. Chao, M.-Y. Liu and Y.-L. Lee, Feasibility of ozone absorption by H2O2 solution in rotating packed beds, J. Hazard. Mater., 2009, 167, 1014–1020 CrossRef CAS.
- Y. S. Mok, D. J. Koh, D. N. Shin and K. T. Kim, Gaseous ozone decomposition using a nonthermal plasma reactor with adsorbent and dielectric pellets, Korean J. Chem. Eng., 2009, 26, 1613–1619 CrossRef CAS.
- Y. Chen, W. Qu, C. Li, J. Chen, Z. Ma and X. Tang, Ultra-low-temperature ozone abatement on α-MnO2 (001) facets with down-shifted lowest unoccupied orbitals, Ind. Eng. Chem. Res., 2018, 57, 12590–12594 CrossRef CAS.
- J. Jia, P. Zhang and L. Chen, Catalytic decomposition of gaseous ozone over manganese dioxides with different crystal structures, Appl. Catal., B, 2016, 189, 210–218 CrossRef CAS.
- L. Zhang, S. Wang, C. Ni, M. Wang and S. Wang, Ozone elimination over oxygen-deficient MnOx based catalysts: Effect of different transition metal dopants, Chem. Eng. Sci., 2021, 229, 116011 CrossRef CAS.
- X. Li, J. Ma, L. Yang, G. He, C. Zhang, R. Zhang and H. He, Oxygen vacancies induced by transition metal doping in γ-MnO2 for highly efficient ozone decomposition, Environ. Sci. Technol., 2018, 52, 12685–12696 CrossRef CAS PubMed.
- Z. Xu, W. Yang, W. Si, J. Chen, Y. Peng and J. Li, A novel γ-like MnO2 catalyst for ozone decomposition in high humidity conditions, J. Hazard. Mater., 2021, 420, 126641 CrossRef CAS PubMed.
- Z. Wang, T. Li, S. Zhang, R. Zhang, Y. Zhang and Q. Zhong, One-step synthesis of δ-MnO2 with rich defects for efficient ozone decomposition under humid conditions, Chem. Eng. J., 2024, 488, 150693 CrossRef CAS.
- T. Gopi, G. Swetha, S. Chandra Shekar, C. Ramakrishna, B. Saini, R. Krishna and P. V. L. Rao, Catalytic decomposition of ozone on nanostructured potassium and proton containing δ-MnO2 catalysts, Catal. Commun., 2017, 92, 51–55 CrossRef CAS.
- W. Hong, M. Shao, T. Zhu, H. Wang, Y. Sun, F. Shen and X. Li, To promote ozone catalytic decomposition by fabricating manganese vacancies in ε-MnO2 catalyst via selective dissolution of Mn-Li precursors, Appl. Catal., B, 2020, 274, 119088 CrossRef CAS.
- R. Yang, Z. Guo, L. Cai, R. Zhu, Y. Fan, Y. Zhang, P. Han, W. Zhang, X. Zhu, Q. Zhao, Z. Zhu, C. K. Chan and Z. Zeng, Investigation into the phase–activity relationship of MnO2 nanomaterials toward ozone-assisted catalytic oxidation of toluene, Small, 2021, 17, 2103052 CrossRef CAS.
- L. Li, Q. Yang, D. Wang, Y. Peng, J. Yan, J. Li and J. Crittenden, Facile synthesis λ-MnO2 spinel for highly effective catalytic oxidation of benzene, Chem. Eng. J., 2021, 421, 127828 CrossRef CAS.
- Y. Liu, P. Zhang, J. Zhan and L. Liu, Heat treatment of MnCO3: An easy way to obtain efficient and stable MnO2 for humid O3 decomposition, Appl. Surf. Sci., 2019, 463, 374–385 CrossRef CAS.
- Y. Li, J. Liu and D. He, Catalytic synthesis of glycerol carbonate from biomass-based glycerol and dimethyl carbonate over Li-La2O3 catalysts, Appl. Catal., A, 2018, 564, 234–242 CrossRef CAS.
- J. Ma, C. Wang and H. He, Transition metal doped cryptomelane-type manganese oxide catalysts for ozone decomposition, Appl. Catal., B, 2017, 201, 503–510 CrossRef CAS.
- H. Deng, S. Kang, J. Ma, L. Wang, C. Zhang and H. He, Role of structural defects in MnOx promoted by Ag doping in the catalytic combustion of volatile organic compounds and ambient decomposition of O3, Environ. Sci. Technol., 2019, 53, 10871–10879 CrossRef CAS PubMed.
- Y. Liu and P. Zhang, Catalytic decomposition of gaseous ozone over todorokite-type manganese dioxides at room temperature: Effects of cerium modification, Appl. Catal., A, 2017, 530, 102–110 CrossRef CAS.
- L. Yang, J. Ma, X. Li, C. Zhang and H. He, Enhancing oxygen vacancies of Ce-OMS-2 via optimized hydrothermal conditions to improve catalytic ozone decomposition, Ind. Eng. Chem. Res., 2020, 59, 118–128 CrossRef CAS.
- H.-L. Yuan, Y.-L. Zhao, X.-J. Qin, Y.-P. Liu, H.-F. Yu, P.-F. Zhu, Q. Jin, X.-W. Yang and X.-D. Luo, Anti-inflammatory and analgesic activities of Neolamarckia cadamba and its bioactive monoterpenoid indole alkaloids, J. Ethnopharmacol., 2020, 260, 113103 CrossRef CAS PubMed.
- W. Hong, T. Zhu, Y. Sun, H. Wang, X. Li and F. Shen, Enhancing oxygen vacancies by introducing Na+ into OMS-2 tunnels to promote catalytic ozone decomposition, Environ. Sci. Technol., 2019, 53, 13332–13343 CrossRef PubMed.
- E. Hayashi, Y. Yamaguchi, K. Kamata, N. Tsunoda, Y. Kumagai, F. Oba and M. Hara, Effect of MnO2 crystal structure on aerobic oxidation of 5-Hydroxymethylfurfural to 2,5-furandicarboxylic acid, J. Am. Chem. Soc., 2019, 141, 890–900 CrossRef CAS.
- F.-X. Tian, H. Li, M. Zhu, W. Tu, D. Lin and Y.-F. Han, Effect of MnO2 polymorphs' structure on low-temperature catalytic oxidation: Crystalline controlled oxygen vacancy formation, ACS Appl. Mater. Interfaces, 2022, 14, 18525–18538 CrossRef CAS PubMed.
- T. Gao, H. Fjellvåg and P. Norby, A comparison study on Raman scattering properties of α- and β-MnO2, Anal. Chim. Acta, 2009, 648, 235–239 CrossRef CAS PubMed.
- C. Lume-Pereira, S. Baral, A. Henglein and E. Janata, Chemistry of colloidal manganese dioxide. 1. Mechanism of reduction by an organic radical (a radiation chemical study), J. Phys. Chem., 1985, 89, 5772–5778 CrossRef CAS.
- S. Ma, X. Ye, X. Jiang, W. Cen, W. Jiang and H. Wang, First principles calculation of mechanical, dynamical and thermodynamic properties of MnO2 with four crystal phases, J. Alloys Compd., 2021, 852, 157007 CrossRef CAS.
- L. Fan, J. Zhao, F. Jing, Z. Ma, Y. Fan, X. Qin and G. Shao, Fabrication of oxygen-vacancy abundant MnO2 nanowires@NiMnxOy-δ nanosheets core-shell heterostructure for capacity supercapacitors, J. Energy Storage, 2022, 52, 104845 CrossRef.
- B. Shi, Z. Di, X. Guo, Y. Wei, R. Zhang and J. Jia, Facet control of manganese oxides with diverse redox abilities and acidities for catalytically removing hazardous 1,2-dichloroethane, Mater. Adv., 2022, 3, 1101–1114 RSC.
- L. Zhang, S. Yang, W. Fu, Y. Cui, J. Wang, D. Zhao, C. Yang, X. Wang and B. Cao, Plasma-induced ε-MnO2 based aqueous zinc-ion batteries and their dissolution-deposition mechanism, J. Mater. Sci. Technol., 2022, 127, 206–213 CrossRef CAS.
- P. Hu, Z. Amghouz, Z. Huang, F. Xu, Y. Chen and X. Tang, Surface-confined atomic silver centers catalyzing formaldehyde oxidation, Environ. Sci. Technol., 2015, 49, 2384–2390 CrossRef CAS.
- J. Wang, H. Zhao, J. Song, T. Zhu and W. Xu, Structure-activity relationship of manganese oxide catalysts for the catalytic oxidation of (chloro)-VOCs, Catalysts, 2019, 9, 726 CrossRef CAS.
- M. Li, R. Zhang, H. Wang, H. Chen and Y. Wei, Role of the exposure facets upon diverse morphologies of cobalt spinels on catalytic deN2O process, Catal. Today, 2021, 376, 177–187 CrossRef CAS.
- K. Xiang, Z. Xu, T. Qu, Z. Tian, Y. Zhang, Y. Wang, M. Xie, X. Guo, W. Ding and X. Guo, Two dimensional oxygen-vacancy-rich Co3O4 nanosheets with excellent supercapacitor performances, Chem. Commun., 2017, 53, 12410–12413 RSC.
- W. Liu, H. Ge, Z. Gu, X. Lu, J. Li and J. Wang, Electrochemical deposition tailors the catalytic performance of MnO2-based micromotors, Small, 2018, 14, 1802771 CrossRef.
- Z. Liu, K. Xu, P. She, S. Yin, X. Zhu and H. Sun, Self-assembly of 2D MnO2 nanosheets into high-purity aerogels with ultralow density, Chem. Sci., 2016, 7, 1926–1932 RSC.
- C. Ma, Y. Wen, C. Rong, N. Zhang, J. Zheng and B. H. Chen, δ-MnO2 with an ultrahigh Mn4+ fraction is highly active and stable for catalytic wet air oxidation of phenol under mild conditions, Catal. Sci. Technol., 2017, 7, 3200–3204 RSC.
- B. Peng, W. Bao, L. Wei, R. Zhang, Z. Wang, Z. Wang and Y. Wei, Highly active OMS-2 for catalytic ozone decomposition under humid conditions, Pet. Sci., 2019, 16, 912–919 CrossRef CAS.
- Y. Zhang, Electronegativities of elements in valence states and their applications. 1. Electronegativities of elements in valence states, Inorg. Chem., 1982, 21, 3886–3889 CrossRef CAS.
- W. Yang, Z. A. Su, Z. Xu, W. Yang, Y. Peng and J. Li, Comparative study of α-, β-, γ- and δ-MnO2 on toluene oxidation: Oxygen vacancies and reaction intermediates, Appl. Catal., B, 2020, 260, 118150 CrossRef CAS.
- F. Shi, F. Wang, H. Dai, J. Dai, J. Deng, Y. Liu, G. Bai, K. Ji and C. T. Au, Rod-, flower-, and dumbbell-like MnO2: Highly active catalysts for the combustion of toluene, Appl. Catal., A, 2012, 433–434, 206–213 CrossRef CAS.
- B. Kang, M. Guo, H. Wu, X. Guo, Z. Di, Y. Wei, J. Jia, Z.-j. Wang and R. Zhang, Effect of alkali/alkaline-earth-metal doping on the Co3O4 spinel structure and N2O decomposition, Catal. Sci. Technol., 2024, 14, 2825–2837 RSC.
- T. Bu, J. Li, Q. Lin, D. P. McMeekin, J. Sun, M. Wang, W. Chen, X. Wen, W. Mao, C. R. McNeill, W. Huang, X.-L. Zhang, J. Zhong, Y.-B. Cheng, U. Bach and F. Huang, Structure engineering of hierarchical layered perovskite interface for efficient and stable wide bandgap photovoltaics, Nano Energy, 2020, 75, 104917 CrossRef CAS.
- H. Li, P. Zhang, J. Jia, X. Wang and S. Rong, A cobalt-vacant Co3O4 as a stable catalyst for room-temperature decomposition of ozone in humid air, Appl. Catal., B, 2024, 340, 123222 CrossRef CAS.
- X. Liang, L. Wang, T. Wen, H. Liu, J. Zhang, Z. Liu, C. Zhu and C. Long, Mesoporous poorly crystalline α-Fe2O3 with abundant oxygen vacancies and acid sites for ozone decomposition, Sci. Total Environ., 2022, 804, 150161 CrossRef CAS.
- T. Liu, Y. Yao, L. Wei, Z. Shi, L. Han, H. Yuan, B. Li, L. Dong, F. Wang and C. Sun, Preparation and evaluation of copper–manganese oxide as a high-efficiency catalyst for CO oxidation and NO reduction by CO, J. Phys. Chem. C, 2017, 121, 12757–12770 CrossRef CAS.
- W. Bao, H. Chen, H. Wang, R. Zhang, Y. Wei and L. Zheng, Pt nanoparticles supported on N/Ce-doped activated carbon for the catalytic oxidation of formaldehyde at room temperature, ACS Appl. Nano Mater., 2020, 3, 2614–2624 CrossRef CAS.
- T. Hatakeyama, N. L. Okamoto and T. Ichitsubo, Thermal stability of MnO2 polymorphs, J. Solid State Chem., 2022, 305, 122683 CrossRef CAS.
- S. Royer, D. Duprez and S. Kaliaguine, Oxygen mobility in LaCoO3 perovskites, Catal. Today, 2006, 112, 99–102 CrossRef CAS.
- B. Baldassarri, J. He, A. Gopakumar, S. Griesemer, A. J. A. Salgado-Casanova, T.-C. Liu, S. B. Torrisi and C. Wolverton, Oxygen vacancy formation energy in metal oxides: High-throughput computational studies and machine-learning predictions, Chem. Mater., 2023, 35, 10619–10634 CrossRef CAS.
- Y. Yang, Y. Li, Q. Zhang, M. Zeng, S. Wu, L. Lan and X. Zhao, Novel photoactivation and solar-light-driven thermocatalysis on ε-MnO2 nanosheets lead to highly efficient catalytic abatement of ethyl acetate without acetaldehyde as unfavorable by-product, J. Mater. Chem. A, 2018, 6, 14195–14206 RSC.
- L. Chen, Y. Liu, X. Fang and Y. Cheng, Simple strategy for the construction of oxygen vacancies on α-MnO2 catalyst to improve toluene catalytic oxidation, J. Hazard. Mater., 2021, 409, 125020 CrossRef CAS PubMed.
- T. Chen, H. Dou, X. Li, X. Tang, J. Li and J. Hao, Tunnel structure effect of manganese oxides in complete oxidation of formaldehyde, Microporous Mesoporous Mater., 2009, 122, 270–274 CrossRef CAS.
- K. Galliez, P. Deniard, C. Payen, D. Lambertin, F. Bart, H.-J. Koo, M.-H. Whangbo and S. Jobic, Pair distribution function and density functional theory analyses of hydrogen trapping by γ-MnO2, Inorg. Chem., 2015, 54, 1194–1196 CrossRef CAS.
- B. Xu, H. Qin, X. Wu and Y. Sun, Ozone decomposition mechanism at different structural oxygen vacancies on manganese dioxide, J. Phys. Chem. C, 2022, 126, 17076–17083 CrossRef CAS.
- L. Wu, Z. Wang, J. Liu, C. Liu, X. Li, Y. Zhang, W. Wang, J. Ma and Z. Sun, Selective ozone catalyzation modulated by surface and bulk oxygen vacancies over MnO2 for superior water purification, Appl. Catal., B, 2024, 343, 123526 CrossRef CAS.
Footnote |
| † Electronic supplementary information (ESI) available. See DOI: https://doi.org/10.1039/d4en00857j |
| This journal is © The Royal Society of Chemistry 2025 |