
 Open Access Article
 This Open Access Article is licensed under a Creative Commons Attribution-Non Commercial 3.0 Unported Licence
Demystifying charge-compensation mechanisms and oxygen dimerization in Li-rich Li2NiO3 cathodes†
Hrishit Banerjee
 *ab,
Clare P. Greycd and
Andrew J. Morrisbd
*ab,
Clare P. Greycd and
Andrew J. Morrisbd
aSchool of Science and Engineering, University of Dundee, Nethergate, Dundee, DD14HN, UK. E-mail: hbanerjee001@dundee.ac.uk
bSchool of Metallurgy and Materials, University of Birmingham, Edgbaston, Birmingham, B15 2TT, UK
cYusuf Hamied Department of Chemistry, University of Cambridge, Lensfield Road, Cambridge, CB2 1EW, UK
dThe Faraday Institution, Quad One, Harwell Campus, Becquerel Ave, Didcot OX11 0RA, UK
First published on 8th July 2025
Abstract
Li-rich cathodes are gaining popularity for Li-ion batteries due to their higher capacity compared to standard layered cathodes. However, the redox mechanisms in these materials are still not clear, nor is the origin of the extra capacity observed experimentally. We investigate the elusive charge-compensation mechanisms and their impact on potential oxygen-dimer formation in a recently synthesized Li-rich cathode, Li2NiO3. Using state-of-the-art ab initio dynamical mean-field theory, we show that the excess capacity in Li2NiO3 comes from a combined Ni and O redox, unlike its layered counterpart LiNiO2, where O redox predominates. Moreover, we demonstrate O dimer formation via a plot of the electron localization function for the first time, and attribute this formation to the higher oxidation state of O, even in the pristine material. Finally, we show that Li migration to the interlayer tetrahedral sites at the end of charge is potentially unlikely due to the end configuration being higher in energy and the stabilization of the parent structure caused by O dimerization. Without this microscopic understanding, it is not possible to design better Li-rich high Ni-content cathodes with higher capacity and minimal degradation.
 Hrishit Banerjee | Dr Hrishit Banerjee, MRSC, MInstP, is a Lecturer in Physics at the University of Dundee, UK, since January 2024. He is a theoretical condensed matter physicist and has 13 years of experience in the field of electronic structure theory focussing on energy and quantum materials. He received his PhD from University of Calcutta and has held postdoctoral positions at CNR SPIN Institute, Graz University of Technology, and University of Cambridge. He has been awarded several fellowships including TRIL Fellowship of ICTP and ESPRIT fellowship of FWF. He has won numerous awards for talks and posters and delivered several invited lectures. |
1 Introduction
Due to the higher specific capacities beyond 250 mAh g−1, lithium (Li)-rich cathodes are promising cathodes for the next generation of batteries, bridging the capacity gap between traditional layered-oxide-based Li-ion batteries and future Li-metal batteries, such as Li–sulfur and Li–air batteries.1 Most studies on Li-rich materials focused on modifying the well-studied layered manganese (Mn)-based material Li2MnO3 (LLMO). These layered materials have a Li layer and a transition metal (TM) layer with an extra Li in the TM layer, making them Li-rich. The general perception for these materials is that Mn being in a formal +4 (d3) oxidation state is electrochemically inactive, and hence all of the capacity results from anionic redox i.e. O in this material, considering no covalency in the ionic picture. LLMO and its derivatives have reasonably high capacity, however, the practical application of Li-rich oxides has been hindered by several formidable challenges,2,3 including capacity and voltage fade,2 structural rearrangement and formation of molecular O2,4 oxygen (O) loss,3,5 slow kinetics, a large hysteresis between the charge and discharge voltages6 and the “voltage droop” issue.7Amongst the Li-rich materials, currently the nickel (Ni)-based ones are receiving increasing attention due to the higher energy density of Ni-rich materials in general. Their high energy density makes Ni the redox-active element of choice for automotive applications.8–10
Although an isostructural Ni-based variant of LLMO was reported a while back,11 with the chemical formula Li2NiO3 (LLNO), it was prepared under highly oxidizing conditions by employing either a high O2 partial pressure12,13 or high mechanical pressure,14,15 hence making the process non-scalable and commercially non-sustainable. More recently, a solid state route of synthesizing this material from LiNiO2 (LNO) has been suggested,8,10,16 focusing the discussion back on Li2NiO3.
Several questions have been raised about the redox mechanisms involved in the electrochemical cycling process of LLNO. It was hypothesized by Bianchini et al.10 that in this material Ni is in a +4 (d6) state, and the capacity is mostly due to lattice O2 release. However, it is also mentioned that 76% of the total specific capacity is obtained from O2 release and that gas evolution does not account for all the observed capacity. This poses the question of where this extra 24% capacity comes from if we accept it as true that there is absolutely no redox activity of Ni. It is also to be noted that almost double the amount of O loss is observed in LLNO by Ogley et al.17 compared to LLMO as shown by Rana et al.;18 so clearly lattice O2 release cannot be the only mechanism at play.
We have shown recently through advanced state-of-the-art DMFT calculations that in LNO19–21 which is the prototypical standard layered Ni-based material, and its doped versions NMC-811,21–23 that the formal oxidation state picture has become obsolete, and Ni does not reach the +4 state at the end of charge as expected from basic inorganic chemistry due to the presence of ligand holes on O and O undergoing O redox in Ni rich materials due to large Ni–O covalency. At the end of charge in LNO and other Ni-rich layered cathodes, Ni is in a 3d8L2 state. Similarly the Ni in LLNO has been shown from Ni K edge X-ray Absorption Near Edge Structure (XANES) spectra to be in a 3d8L2 state similar to LNO at the end of charge (in a highly covalent Ni–O hybridized state).17 Hence, it is clear that the ionic picture of formal oxidation states does not work in the case of high Ni–O covalency, which can be expected for LLNO as well, due to large Ni–O covalency and raises the imperative need for a clear explanation of the redox mechanism involved in the cycling process of this material.
XANES and Resonant Inelastic X-ray Scattering (RIXS) measurements show that O dimerization occurs in LLNO.17 In this study, the authors show the presence of Ni in 3d8L2 state based on both Ni-K and Ni L-edge spectra. An overall reduction of the cathode is associated with the movement of the Ni K edge to lower energies and attributed to the change in structural composition of the cathode due to loss of stoichiometry, owing to O loss, as well as trapped O dimers. It is emphasized that although the RIXS signature of O dimerization is seen here, O–O RIXS may not be a good signature of O redox (as seen previously as well24), necessitating and inspiring further theoretical investigation of O redox. The O–O dimer feature is shown by Ogley et al.17 to be absent in pristine LLNO, arising only at delithiated states, suggesting that Li content may be a key determinant in driving the intensity of the RIXS feature. It is proposed that the O–O dimer feature may not necessarily be associated with the 3d8L2 configuration, and there may be structural effects at play. It has also been well established for related Ni-rich materials19,22 that TM K edge XANES do not provide a faithful description of oxidation state change, particularly in the case of strongly covalent systems, and are often affected by structural reconstruction effects. Hence, it is imperative to disentangle the bulk O redox mechanism in LLNO from the structural reconstructions and correlate this to the mechanism of O dimerization, which is not yet well understood in Li-rich materials.
Based on calculations,25 it has recently been suggested albeit for a different Ni-rich material LNO that O dimerization arises due to defects in the system. These calculations combined bond-length analysis with magnetic moment analysis to characterize this dimer as “molecular O2-like”. Bond length analysis showed a relaxed bond length of 1.208 Å, which is the average bond length of molecular O2. Magnetic moment analysis showed an average magnetic moment over the two constituent oxygens of 0.761 μB, which is close to the corresponding value of the magnetic moment of triplet O2. However, O dimerization is an electronic phenomenon, and a structural analysis argument based on bond length and average magnetic moment from different O sites on a plane wave calculation might not fully reflect either the occurrence or bonding nature of dimers. This is even more complicated considering the multifaceted nature of electronic interaction in solids when trying to determine the occurrence of an O dimer in a solid state with numerous plausible interactions, unlike an O dimer in vacuum, where a bond length analysis alone would have been sufficient. The study25 undertakes further characterization of the structure and assigns charges to these oxygens (via Mulliken and Löwdin partitioning) of approximately zero, and an integrated crystal orbital bond index between them of 0.95, indicating a covalent bonding. No such analysis exists for LLNO. Very recently, the assumptions about the origin of O dimerization and molecular O2 in a different Li-rich material have been questioned, and ideas regarding the impact of beam damage in X-ray experiments on molecular O2 have been put forth,26 challenging the existing notions of anion redox. Since there is no concrete and accurate theoretical understanding yet on Li-rich materials, the jury is still out on these very relevant and fundamental questions.
In this article, we address several fundamental questions regarding this interesting Li-rich high Ni content cathode material, LLNO, which has the potential for applicability in batteries due to its high capacity. Using dynamical-mean field theory (DMFT), we present the progress of the electronic structure as a function of state-of-charge, as well as track very accurately the occupancies of Ni d and O p orbitals, thereby clarifying the redox mechanism at finite temperatures. Using the GW approximation, we reproduce the TM K edges. Utilizing core-hole DFT methods, we capture the O–K edge and the corresponding peak, which is believed to be7,17,27,28 indicative of O dimerization, and show, using excited state core-hole PDOS analysis, the nature of the peak. Employing the Electron Localization Function (ELF), we show definitively the formation of O dimers in the bulk material without the presence of defects and show that the O dimerization is due to the electronic structure instability arising from the higher oxidation state of O. Finally, we comment on the possibility of Li migration from intralayer octahedral to interlayer tetrahedral sites. Our work clarifies the origin of the extra capacity seen by Bianchini et al.,10 shows the origin of O dimerization without defects, and clarifies the redox mechanism in this material and its impact on Li migration as well. The microscopic understanding of O dimerization-based degradation, as well as the origin of the extra capacity clarified in this article, can potentially aid in the design of optimal Li-rich high Ni content cathodes with high capacity and minimal degradation.
2 Computational details
2.1 Computational details: DFT calculations
Our DFT calculations for structural relaxation were carried out in a plane-wave basis with projector-augmented wave (PAW) potentials29 as implemented in the Vienna Ab initio Simulation Package (VASP).30,31In all our DFT relaxation calculations, we chose as exchange–correlation functional the Generalized Gradient Approximation (GGA) implemented following the Perdew–Burke–Ernzerhof (PBESol) prescription32 for solids. For ionic relaxations using the VASP package, the internal positions of the atoms were allowed to relax until the forces became less than 0.005 eV Å−1. An energy cutoff of 600 eV and an 8 × 8 × 4 Monkhorst–Pack k-points mesh provided good convergence of the total energy.
The DFT + U calculations were carried out in the form of GGA + U. The value of U at the Ni sites in the GGA + U formalism was 6 eV, in the Dudarev Scheme, following previous calculations where similar values of U have been selected.19–22,33–35
The electron localization function (ELF) is plotted to show oxygen dimerization, which is defined as a measure of the likelihood of finding an electron in the neighborhood space of a reference electron located at a given point and with the same spin, and given by the formula,36
 | (1) |
 and
and  .
.
2.2 Prediction of XAS using DFT calculations
X-ray absorption spectra for the O K edge were calculated with VASP6 using PAW with an energy cutoff of 600 eV. A core hole was introduced in the 1s state of O. The PBE functional was chosen since it has been shown before to be sufficient for describing the essential O p states19 as well as capturing the edge and pre-edge peak features sufficiently.352.3 Feff calculations for prediction of XANES for strongly correlated TM
In our study, we employed the FEFF10 code for the ab initio calculation of K-edge XANES for the transition metals. The X-ray absorption spectra of transition metals are commonly dominated by atomic multiplet interactions arising from electron correlation.37 FEFF employs Green's formulation of the multiple scattering theory to compute the spectra.38,39 The X-ray absorption cross-section μ is calculated in a manner similar to Fermi's golden rule when written in terms of the projected photo-electron density of final states or the imaginary part of the one-particle Green's function, G(r, r′; E). In terms of the Green's function, G(r, r′; E), the absorption coefficient, μ, from a given core level c is given by ref. 40.
 | (2) |
 | (3) |
2.4 Computational details: DMFT calculations
For our DFT + DMFT calculations, we used the full-potential augmented plane-wave basis as implemented in the WIEN2K code package.41 For the WIEN2K calculations, we used the largest possible muffin-tin radii, and the basis set plane-wave cutoff was defined by Rmin·Kmax = 9, where Rmin is the muffin-tin radius of the O atoms. The consistency between the VASP and WIEN2K results has always been cross-checked.DMFT calculations were performed using the TRIQS/DFTTools package42–44 based on the TRIQS libraries.45 We performed DMFT calculations in a basis set of projective Wannier functions as implemented in the dmftproj module of TRIQS. It was also used to calculate the initial occupancy of the correlated orbitals. A projection window of −8 eV to +26 eV was chosen. The large window of unoccupied bands was chosen to account for any hybridization between Ni d and O p orbitals in the higher energy unoccupied bands, for more accurate charge projections within the d – p model. All five Ni d orbitals have been treated in the impurity model, whereas the O p states have been taken into account only as non-interacting.
The Anderson impurity model, constructed by mapping the many-body lattice problem to a local problem of an impurity interacting with a bath, was solved using the continuous-time quantum Monte Carlo algorithm in the hybridization expansion (CT-HYB)46 as implemented in the TRIQS/CTHYB package.47 For each DMFT step, 125![[thin space (1/6-em)]](https://www.rsc.org/images/entities/char_2009.gif) 000 × 128 cycles of warmup steps and 1250000 × 128 cycles of measures were performed for the quantum Monte Carlo calculations. We performed one-shot DFT + DMFT calculations, using a fully localized limit (FLL) type double-counting correction.48 We used a fully rotationally invariant Kanamori Hamiltonian parametrized by Hubbard U and Hund's coupling JH, where we set the intraorbital interaction to U′ = U – 2JH. For our DMFT calculations, we used U = 6 eV and JH = 0.5 eV following existing literature for Ni d orbitals.19,20,22 The insulating state for pristine LLNO structure was seen to appear at U = 6 eV, JH = 0.5 eV, which also match with our choice of U in the DFT calculations as well as previous existing values of U in literature.19–23,33–35,49 Real-frequency Green's functions have been obtained using the maximum-entropy method of analytic continuation as implemented in the TRIQS/MAXENT application.50
000 × 128 cycles of warmup steps and 1250000 × 128 cycles of measures were performed for the quantum Monte Carlo calculations. We performed one-shot DFT + DMFT calculations, using a fully localized limit (FLL) type double-counting correction.48 We used a fully rotationally invariant Kanamori Hamiltonian parametrized by Hubbard U and Hund's coupling JH, where we set the intraorbital interaction to U′ = U – 2JH. For our DMFT calculations, we used U = 6 eV and JH = 0.5 eV following existing literature for Ni d orbitals.19,20,22 The insulating state for pristine LLNO structure was seen to appear at U = 6 eV, JH = 0.5 eV, which also match with our choice of U in the DFT calculations as well as previous existing values of U in literature.19–23,33–35,49 Real-frequency Green's functions have been obtained using the maximum-entropy method of analytic continuation as implemented in the TRIQS/MAXENT application.50
3 Results and discussion
In this section, we discuss the results obtained from DFT, GW and DMFT calculations. We first describe the crystal structure and the DFT non-spin polarized band structure, based on which we determine the low-energy Wannier Hamiltonian. Then we describe the progression of the DMFT spectral functions with various states of charge (SOC) and the calculated DMFT charges from interacting Green's functions. Next, we show the calculated XANES spectra and correlate them with experimental results. Finally, we show the origin of the O dimerization with the electron localization function plots, and describe the potential Li migration behavior.3.1 Crystal structure and DFT bands
In this section, we describe the crystal structure and the DFT non-spin polarized band structure of LLNO. LLNO is isostructural to LLMO. The lattice crystallizes in space group C2/m. The PBESol-relaxed lattice constants are: a = 4.846 Å, b = 8.384 Å, c = 4.939 Å, α = 90°, β = 109.305°, γ = 90°. The structure is shown in Fig. 1a. It is a layered structure with excess Li in the TM layers as shown. There are a total of 4 Li, 2 Ni, and 6 O ions in the unit cell. In principle, Li2NiO3 can be considered as Li[Ni2/3Li1/3]O2, where alternating Li and Ni2/3Li1/3 layers are embedded within a nearly cubic close-packed oxygen sublattice, and the Ni2/3Li1/3 layer shows a honeycomb ordering. We then create different states of charge by removing Li ions first from the Li layers as suggested by Bianchini et al.10 and finally, at the very end of charge, we remove Li from the TM layer to create NiO3. We provide the details of all the relaxed structures in Table 1 and the relaxed CIF files as ESI.† | ||
| Fig. 1 (a) Crystal structure of Li2NiO3 in pristine state and (b) the corresponding non-magnetic DFT band structure. The representative colors for the fat bands as well as the atomic spheres are Ni (blue), O (red), and Li (green). The Fermi energy is marked with the dashed line at 0 eV. | ||
| Pristine | 50% SOC | 75% SOC | 100% SOC | |
|---|---|---|---|---|
| Lattice constants [Å] | ||||
| a | 4.846 | 4.864 | 5.138 | 5.099 |
| b | 8.834 | 8.273 | 9.043 | 9.094 |
| c | 4.939 | 5.056 | 4.740 | 4.605 |
|
||||
| Lattice angles [°] | ||||
| α | 90.00 | 90.00 | 90.00 | 90.00 |
| β | 109.3 | 111.7 | 131.5 | 134.9 |
| γ | 90.00 | 90.00 | 90.00 | 90.00 |
| Volume [Å3] | 189.4 | 189.1 | 165.0 | 151.3 |
In the pristine state, the non-magnetic DFT band structure shows that LLNO is a diamagnetic insulator, confirming experimental findings. We observe a large overlap between Ni d and O p states as shown in Fig. 1b. This large overlap of Ni d and O p bands is similar to the band structure of NiO2 seen in ref. 19, indicating a strong hybridization between Ni d and O p orbitals, where a d–p low-energy Wannier Hamiltonian was constructed due to the large covalency between Ni d and O p bands. In this case, we also construct a Wannier d–p model.
3.2 Correlated electronic structure
In this section, we discuss the evolution of the correlated electronic structure in the paramagnetic phase as a function of state-of-charge using DMFT. We follow the real-frequency interacting Green's functions as we delithiate the structure. In Fig. 2, we show this evolution where we plot orbital resolved spectral functions. Although the large angle β = 109.305° leads to a trigonal distortion and breaks somewhat the degeneracy of the t2g orbitals, for all practical purposes, we can still use the t2g–eg split nomenclature to track the change of spectral functions. DMFT calculations are carried out at 1/kBT = 20 eV−1, which corresponds to a temperature T = 580 K in the paramagnetic regime.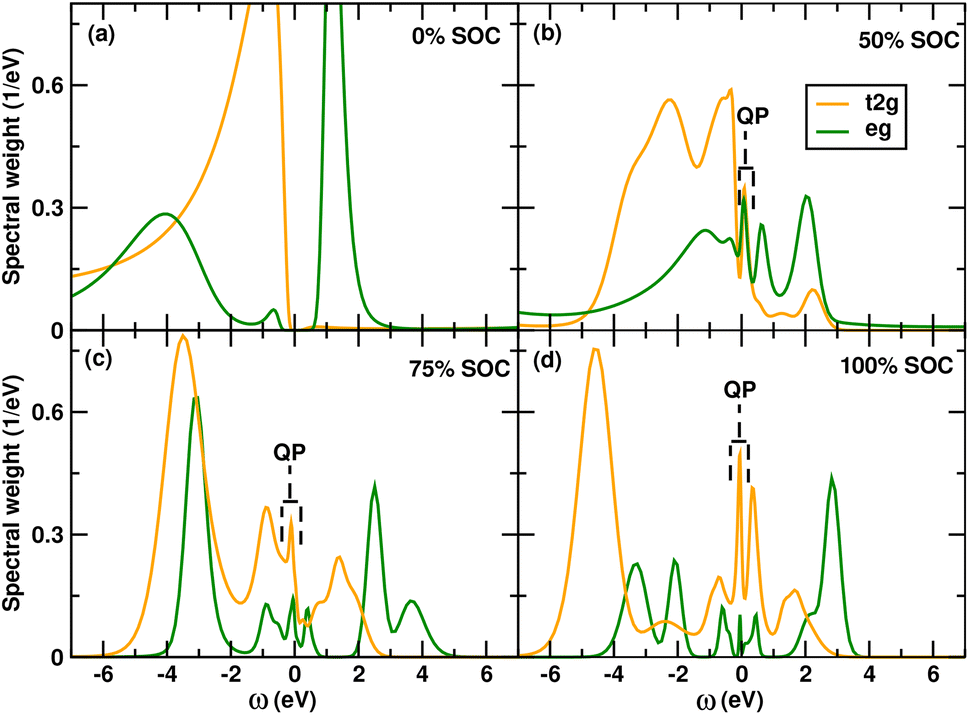 | ||
| Fig. 2 Figure showing the evolution of DMFT spectral functions obtained from Green's functions with the different states of charge (a) 0% SOC (b) 50% SOC (c) 75% SOC and (d) 100% SOC. The change in spectral function as well as the emergence of quasiparticle peaks (shown using dashed brackets) show the involvement of Ni d orbitals in the redox process. | ||
The paramagnetic spectral function at 0% SOC shows an insulating state with fully-filled t2g and half-filled eg orbitals, with a small band gap of 0.4 eV. The occupancy of Ni-d orbital from the DMFT interacting Green's function is 8e, which is a ligand hole state of 3d8L2 in this material. The total number of electrons in the d–p manifold is 48 electrons, and since there are 2 Ni and 6 O atoms, the average occupancy of O p orbitals in this state of charge is 5.33. This indicates a large ligand-hole on the O and a large deviation from the formal oxidation state of +4 for Ni (also shown in Fig. 3). Following the logic of formal oxidation states, this would have resulted in an O2− state, which we do not see in the DMFT calculations.
 | ||
| Fig. 3 Figure showing redox states of Ni and O species for various states of charge calculated using DMFT d–p models. This confirms that the redox behavior is shown by both Ni and O. O redox occurs first, and Ni redox occurs at a later stage. | ||
Next, we move on to the 50% state-of-charge and see a massive change in the Ni d spectral function obtained from the interacting Green's functions. We show that both the t2g and eg orbitals start emptying out, thus showing the involvement of the Ni d in the redox process. In this case we find the average occupancy of the Ni d orbitals become 7.7 and since the total number of electrons in this case of 46 due to removal of 2 Li and correspondingly 2e leads to an average O p occupancy of 5.1, also shown in Fig. 3. Thus we see an involvement of both O and Ni in the redox process, although up to this state-of-charge the major involvement in the redox process is due to O p orbitals confirming O redox, essentially demonstrating ligand hole redox similar to LNO up to this SOC.
At 75% SOC we find a large change in the spectral function of both the t2g and eg spectral functions, demonstrating further involvement of Ni d orbitals in the redox process, as shown in Fig. 2. The integrated charge from the interacting Green's function shows an average occupancy of 7.25 on Ni d orbitals. Since the total occupancy of the d–p manifold is 45e, we find the average occupancy of O p orbitals is 5.08, as shown in Fig. 3. Hence, beyond 50% state of charge, a larger involvement of Ni d orbitals is observed in LLNO, which was not seen in LNO.
Finally, at 100% SOC, we obtain the NiO3 structure. Although it is difficult to extract the last Li ions from the structure experimentally, it is possible to create this structure theoretically. Moreover, since there is the possibility of Li moving from the transition-metal octahedral site to the inter-layer tetrahedral site, which has been predicted in LLMO, it may be possible to extract the Li which has moved to the inter-layer tetrahedral site. From the spectral function, we see a large change in both the t2g and eg orbitals as shown in Fig. 2. From the calculated charges we find Ni d orbital having average occupancy of 7.1 which is a 3 d8L and with total d–p manifold having 44e hence O p orbitals having average occupancy of 4.96. Thus, we see more oxidation of Ni d orbitals. Overall, Ni d goes from an occupancy of 8 (3d8L2) to 7.1 (3d8L), and O p goes from 5.33 to 4.96. Hence, we find redox of both Ni and O, and this explains the charge-compensation mechanism during cycling as well as the extra capacity observed by Bianchini et al.10 which cannot be explained through only lattice O2 release.
Incidentally, from standard GGA + U calculations, it is also seen that near the end of charge localized moments appear in 0 K DFT calculations which indicate that the material becomes more paramagnetic at the end of charge compared to a diamagnetic configuration at the beginning of charge, this can also be seen from the occupancies on Ni sites. This idea is further supported by the correlated paramagnetic spectral functions shown in Fig. 2 where large quasiparticle peaks appear beyond 50% state of charge shown using dashed brackets,‡ which indicates a localized behavior associated with the correlated metallic state and potentially localized moments at low temperatures. It is to be noted, however, that a correlated metal with a large quasiparticle peak is not the same as a free electron metal and has vastly different experimental conductivities.
3.3 Redox mechanism and XANES spectra
We have already demonstrated the different occupancies of Ni d and O p orbitals as a function of SOC. This explains the redox and corresponding charge-compensation mechanism in LLNO during cycling. We observe primarily ligand hole redox due to the large Ni–O covalency at the beginning of the charge. This is very different from LLMO O redox, where O redox is primarily due to unhybridized O species. Next, we try to reproduce the trends in the experimental XANES spectra, and correlate this to existing experimental spectra.First, we use core-hole DFT to predict the O K edge as a function of state of charge. This is shown in Fig. 4a. We see a good match with the existing literature.17 The small peak feature associated with the post-edge peak at the end of charge is seen at 523 eV. Very importantly, we observe that the post-edge peak at 523 eV that is attributed to O dimerization17 is seen in our theoretical spectra as well. Although it is not possible to calculate the exact energies, particularly from pseudopotential DFT calculations, the main features are well represented. It is also to be noted that soft X-rays are often surface sensitive, and the depth of penetration of the X-ray determines the lineshapes and particularly intensities through surface attenuation, as is seen in experimental literature.
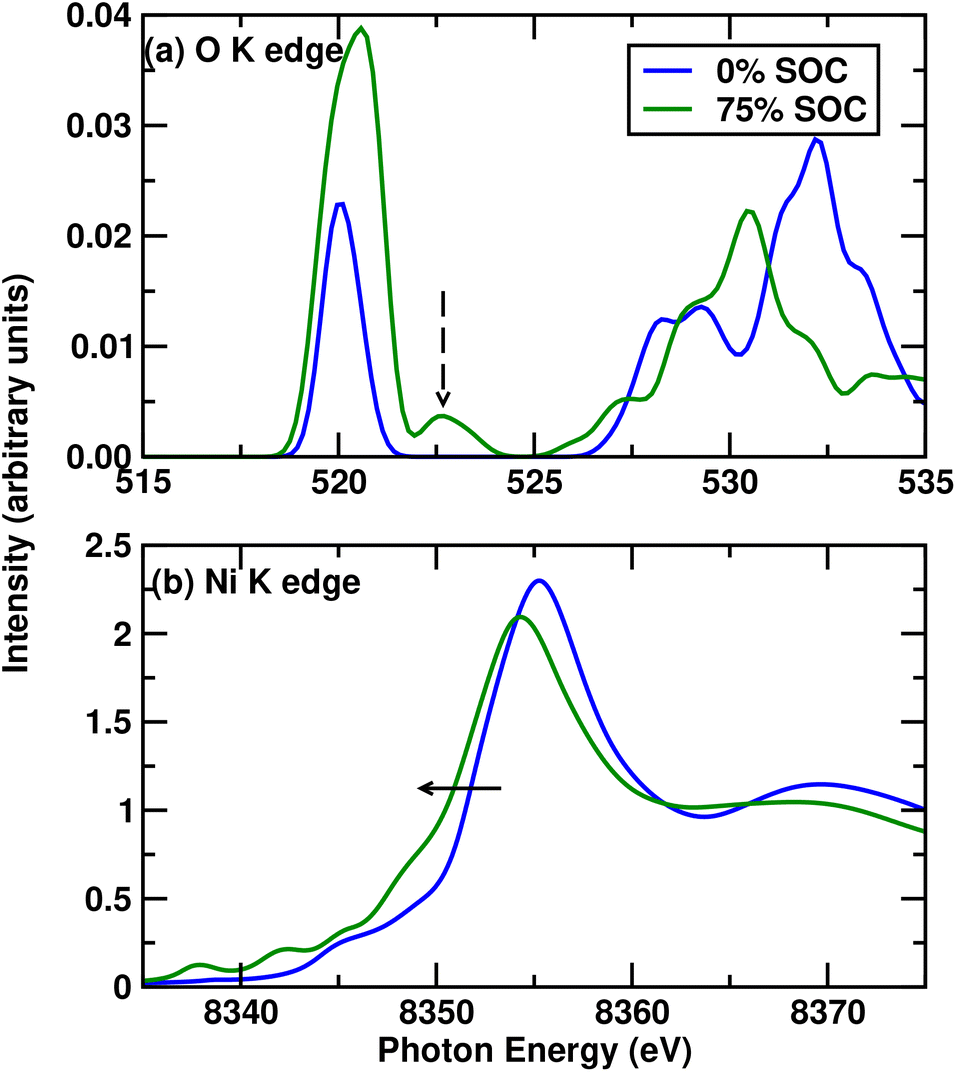 | ||
| Fig. 4 Figure showing (a) O–K and (b) Ni K edges for Li2NiO3 at the beginning and near the end of charge at 0% and 75% SOC. The dashed arrow in (a) indicates the peak generally shown in experimental studies to indicate the O dimer, while the solid arrow in (b) shows the movement of the Ni K edge as a function of state of charge. | ||
Next, we analyze the O K edge for Li0.5NiO3 (75% delithiated Li2NiO3) in detail, where we find the peak which is experimentally pointed out to be a dimer. We show that the peak consists of two inequivalent O sites in Fig. 5a. We also analyze the excited-state PDOS from the core-hole DFT calculations. We find that the pre-edge peak consists of a mix of Ni d and O p states due to hybridization, as has generally been shown in Ni-rich materials.35 However, we also see in Fig. 5b that the small post-edge peak consists primarily of O p contribution with no contribution from Ni d states. Hence, we can establish clearly that this small peak arises from the O dimer formation, which we will demonstrate in the next section via plots of the electron-localization function. We also note here that this peak does not appear in Li2NiO3 or other configurations of Li0.5NiO3 with Li in interlayer sites, confirming that dimer formation occurs only in cases without Li in interlayer sites. We shall explain this in detail in a later section on Li migration.
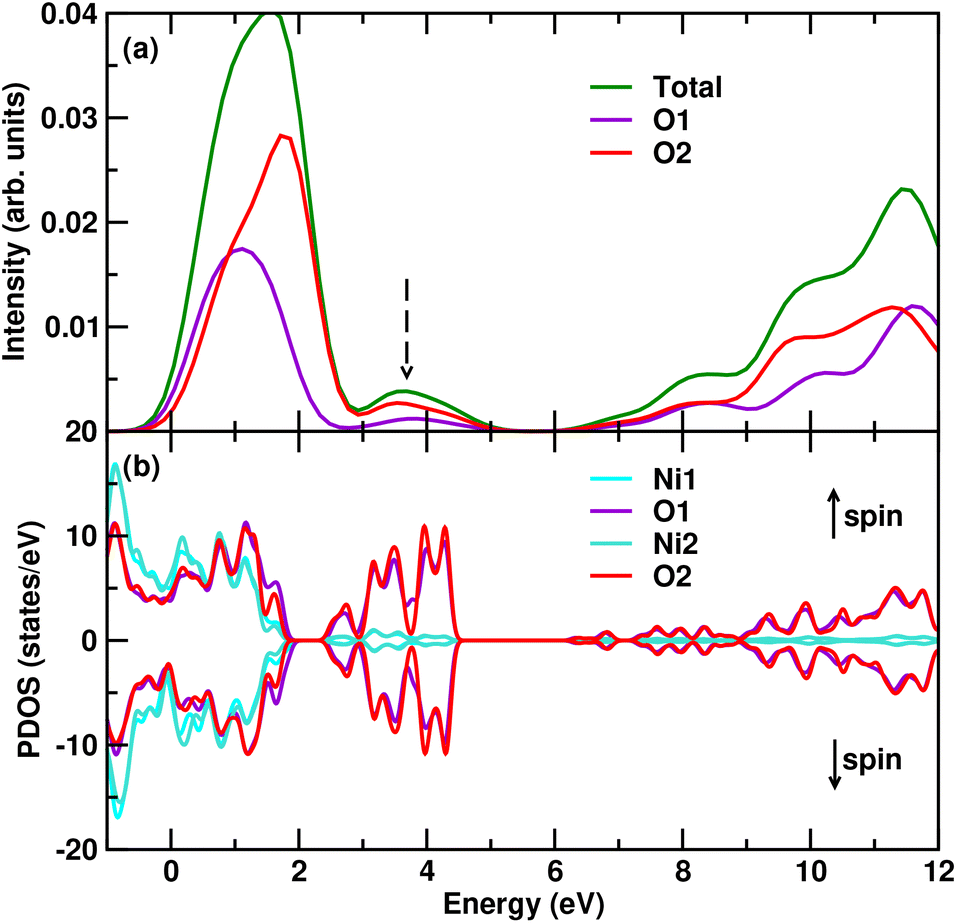 | ||
| Fig. 5 Figure showing (a) the calculated contribution from each inequivalent O site to the total XANES K-edge for Li0.5NiO3. (b) The excited-state core-hole electronic PDOS-based analysis of the dimer peak in O K-edge XANES for 75% state of charge. The peak labelled with the dashed arrow in (a) has previously been attributed to the oxygen dimer. We verify this by showing in (b) that the electronic density of states at this energy comprises states associated with the oxygen dimer. | ||
Next, we calculate the Ni K edges, which are generally measured with hard X-rays experimentally and are much more bulk sensitive. In this case, due to the inability of DFT to take into account electron correlation-based self-energy effects accurately, we use the GW-approximation-based multiple scattering methods and obtain an excellent match with experimental Ni K edges. We show in Fig. 4b that the Ni K edge moves to lower energies in delithiation, which has been suggested in experimental studies to be indicative of the reduction of Ni. Limitations in periodic modelling necessitate that the GW-approximation calculations presented are carried out on structures comprising a stoichiometric ratio of atoms. In experiment, along with trapped O dimers, there is also O-loss leading to loss of stoichiometry. This loss causes structural changes, which contribute to the negative shift.17 Indeed, it is well known that structural effects play a massive role in K-edge spectra.19,22 The negative shift in our stoichiometric calculations may be correlated to trapped O dimers forming at the end of charge which we demonstrate in the next section.
3.4 O dimerization
In this section, we demonstrate the formation of O dimers and explain the origin of O dimerization phenomena. It has been suggested previously, albeit for a different Ni-rich material LNO, that O dimerization occurs due to the formation of defects,25 using a combination of bond length and magnetic moment analysis, with Mulliken and Löwdin charges and ICOOP. However, the state-of-the-art in providing the clearest demonstration of the formation of a dimer is usually carried out employing ELF36,53–56 analysis, since by definition the electron localization function is a measure of the probability of finding an electron in the neighborhood space of a reference electron located at a given point and with the same spin, essentially defining a dimer. We see the formation of O dimers at 75% state of charge, while no such dimer exists at 0% state of charge. We show the ELF plots for 0% and 75% state of charge in Fig. 6. In Fig. 6a ELF for 0% state of charge is shown, where there is no O dimer formation, while in Fig. 6b, a clear O dimer formation is seen at 75% state of charge. O dimers form in the bulk structure itself and do not require defects or O vacancies (although these might potentially be present). This is because dimerization of O stabilizes the O ions in a highly oxidized state, as we have shown in Fig. 3. We can see that the O p-orbital occupancy is ∼5 which indicates an O oxidation state of −1. Formation of a dimer allows two O ions at −1 state to share electrons to form a dimer and stabilize their configuration. The question might arise as to why this does not form in the case of a 0% state of charge, which is also unstable with p orbital occupancy of 5.33. However, as we can see in Fig. 6a, the Li ions in the interlayer space prevent O dimerization. Moreover, the O ions between the two TM layers have a large distance, which also prevents dimerization. So, dimerization, we have demonstrated here, is not necessarily a defect-driven process, but is an electronic structure-driven process arising due to the instability associated with the higher oxidation state of O. It is hence energetically favourable for the O in p5 state to form dimers and stabilize by fulfilling the octet configuration. It is to be noted that by defect we mean specifically O vacancies and O site defects and not Li vacancies occurring due to delithiation. Although it is plausible that Li vacancies in the charging/delithiation process and subsequent structural relaxation may induce local lattice distortions that could potentially impact O–O interactions or even, as in any oxide material, affect the formation of O vacancies, the primary driving force behind O dimerization is the electronic instability of O in a highly oxidized state, rather than O vacancies. This is evident from our calculations, which demonstrate O dimerization even in a bulk O vacancy-free structure. This can also lead to the eventual formation of molecular O2 in the material as has been shown before theoretically using AIMD simulations19 for a related Ni-rich material LiNiO2. In this study on LiNiO2 in a highly charged state the following mechanism for the observed reaction route was proposed: (1) two oxide ion radicals O− combine to form a peroxide ion O2−2; (2) upon peroxide formation and desorption, the two O− radicals are oxidized to molecular O2, leaving behind two oxygen vacancies and two electrons; and (3) the two electrons reduce the two closest O− radicals to O2− ions. The latter two processes occur simultaneously. O dimerization will also have a significant impact on Li migration. | ||
| Fig. 6 Figure showing electron localization functions (a) for 0% state of charge and (b) for 75% state of charge, during cycling, clearly showing the formation of O dimers at 75% SOC. | ||
3.5 Li migration
In this section, we discuss the Li migration in Li-rich materials, which have been observed in LLMO. It has been seen previously57 that in LLMO, near the end of charge Li in the TM layer in the octahedral site migrates to the interlayer tetrahedral site and forms a dumb-bell configuration of two Li ions.First, we try to construct a structure with the dumbbell configuration in LLNO at 75% state of charge, similar to what would be observed in LLMO and other Li-rich layered materials,57 and relax this structure. We observe that after a full relaxation of this structure, the energy difference between the structure with Li in interlayer tetrahedral sites and the structure with Li in intralayer octahedral sites is ∼2.4 eV (energy difference per ion ∼133 meV). This is a massive energy difference which cannot be overcome by thermal fluctuations at any reasonable temperature. Hence, we can conclude that the structure with Li in interlayer tetrahedral sites is energetically unfavourable in this case.
To further establish the idea that Li migration in this structure to inter-layer sites is unlikely, next we carry out AIMD calculations at different temperatures T = 300 K, and 500 K, in the NVT ensemble using the Nose–Hoover thermostat for a few picoseconds. However, this does not show a Li migration from intra-layer octahedral to inter-layer tetrahedral sites.
The higher stabilization of the structure with Li in the intralayer octahedral sites can be attributed to the fact that in the case of the structure with Li in the tetrahedral interlayer sites, the highly oxidized O ions cannot attain stability by forming O dimers. Hence, the stabilization energy of O dimerization competes with the thermal energy, and this results in the final state being unfavourable and higher in energy. Thus, even though it might be possible to have Li migration in LLNO, the likelihood of such a transition is very low due to the stabilization effect of O dimerization.
To further confirm that the structure with Li in interlayer tetrahedral sites is unlikely to appear, we carry out XANES O K edge spectra simulation with this structure. Unsurprisingly, the dimer peak shown in Fig. 4a as well as Fig. 5a does not appear since dimers do not form in this structure. We also find no dimer formation in our calculation for ELF for this structure either.
4 Conclusions
In this article, we study the electronic structure of LLNO, a Li-rich high Ni-content cathode material of current interest, using advanced theoretical methods. We show that, unlike Mn in LLMO, Ni in pristine LLNO does not exist in its formal oxidation state (of +4 i.e., d6 configuration). We demonstrate that Ni shows a 3d8L2 ligand hole state, and contrary to what is suggested in existing literature, participates in the redox mechanism along with O. This participation explains the extra capacity observed in experimental studies. O redox dominates at the beginning of charge, with some participation from Ni, while Ni redox dominates at the end of charge. Our calculated Ni K edge and O K edge show an excellent match with experimental XANES spectra, and demonstrate that the O K edge XANES feature of O dimers arises due to O p states only. O dimerization is convincingly demonstrated using ELF plots. The dimerization can be attributed to the higher oxidation state of O at the end of the charge and the absence of Li in the interlayer space. Although the origin of O dimerization albeit for a different Ni-rich material LiNiO2 was previously thought to be defect driven,25 we show here that at least for Li2NiO3, O dimerization occurs in the pristine lattice without defects, purely arising from the electronic instability associated with the higher oxidation state of O. This also has significant impact in the formation of molecular O2 observed experimentally in Li-rich materials7,27,28 arising again potentially from electronic instability rather than beam damage.26 Finally, we show using NVT ensemble AIMD that the likelihood of Li migration from octahedral-intralayer sites to tetrahedral-interlayer sites is very low. This is caused by the higher energy of the final structure, since the initial structure is stabilized by O dimerization. This conclusion is also supported by the absence of the O-dimer peak in the Li-migrated structure. Our study provides valuable insights regarding the open questions in the field about the charge-compensation mechanisms and the origin of O-dimerization in Li-rich high Ni-content materials. The microscopic understanding of the origin of O dimerization-based degradation, as well as the origin of the extra capacity in Li-rich high Ni-content cathodes, will help design optimal batteries with high energy density and minimal degradation.Data availability
The cif files for the structures are available as ESI.† The codes (VASP, WIEN2K, and TRIQS) are standard codes used in materials theory.Conflicts of interest
There are no conflicts to declare.Acknowledgements
HB acknowledges fruitful discussions with Prof. Antoine Georges and Prof. Jean-Marie Tarascon. HB, CPG, and AJM acknowledge critical inputs from Prof. Louis F. J. Piper and Prof. David O. Scanlon. Generous computing resources were provided by the Sulis HPC service (EP/T022108/1), ARCHER2 UK National Computing Service which was granted via HPC-CONEXS, the UK High-End Computing Consortium (EPSRC grant no. EP/X035514/1) and networking support by CCP-NC (EP/T026642/1), CCP9 (EP/T026375/1), and UKCP (EP/P022561/1). This work has been funded by the Faraday Institution degradation project (FIRG060).References
- W. Zuo, M. Luo, X. Liu, J. Wu, H. Liu, J. Li, M. Winter, R. Fu, W. Yang and Y. Yang, Energy Environ. Sci., 2020, 13, 4450–4497 RSC.
- P. Yan, L. Xiao, J. Zheng, Y. Zhou, Y. He, X. Zu, S. X. Mao, J. Xiao, F. Gao, J.-G. Zhang and C.-M. Wang, Chem. Mater., 2015, 27, 975–982 CrossRef CAS.
- E. Cho, K. Kim, C. Jung, S.-W. Seo, K. Min, H. S. Lee, G.-S. Park and J. Shin, J. Phys. Chem. C, 2017, 121, 21118–21127 Search PubMed.
- K. McColl, S. W. Coles, P. Zarabadi-Poor, B. J. Morgan and M. S. Islam, Nat. Mater., 2024, 23, 826–833 CAS.
- P. M. Csernica, K. McColl, G. M. Busse, K. Lim, D. F. Rivera, D. A. Shapiro, M. S. Islam and W. C. Chueh, Nat. Mater., 2025, 24, 92–100 CAS.
- M. Calpa, K. Kubota, E. Mizuki, M. Ono, S. Matsuda and K. Takada, Energy Storage Mater., 2023, 63, 103051 Search PubMed.
- J.-J. Marie, R. A. House, G. J. Rees, A. W. Robertson, M. Jenkins, J. Chen, S. Agrestini, M. Garcia-Fernandez, K.-J. Zhou and P. G. Bruce, Nat. Mater., 2024, 23, 818–825 CAS.
- M. Tabuchi, N. Kuriyama, K. Takamori, Y. Imanari and K. Nakane, J. Electrochem. Soc., 2016, 163, A2312 CAS.
- L. Karger, P. Henkel, S. Murugan, R. Zhang, A. Kondrakov and T. Brezesinski, Chem. Commun., 2024, 60, 11355–11358 CAS.
- M. Bianchini, A. Schiele, S. Schweidler, S. Sicolo, F. Fauth, E. Suard, S. Indris, A. Mazilkin, P. Nagel, S. Schuppler, M. Merz, P. Hartmann, T. Brezesinski and J. Janek, Chem. Mater., 2020, 32, 9211–9227 CrossRef CAS.
- W. Bronger, H. Bade and W. Klemm, Z. Anorg. Allg. Chem., 1964, 333, 188–200 CAS.
- H. Migeon, A. Courtois, M. Zanne and C. Gleitzer, Rev. Chim. Miner., 1976, 13, 1–8 CAS.
- H. N. Migeon, M. Zanne, C. Gleitzer and J. Aubry, J. Mater. Sci., 1978, 13, 461–466 CAS.
- E. Shinova, E. Zhecheva, R. Stoyanova and G. D. Bromiley, J. Solid State Chem., 2005, 178, 1661–1669 CAS.
- R. Stoyanova, E. Zhecheva, R. Alcántara, J. Tirado, G. Bromiley, F. Bromiley and T. Boffa Ballaran, Solid State Ionics, 2003, 161, 197–204 CrossRef CAS.
- Y. Kobayashi, M. Tabuchi, H. Miyashiro and N. Kuriyama, J. Power Sources, 2017, 364, 156–162 CAS.
- M. J. W. Ogley, A. S. Menon, B. J. Johnston, G. Pandey, I. McClelland, X. Shi, S. Agrestini, V. Celorrio, G. E. Pérez, S. G. Booth, J. Cabana, S. A. Cussen and L. F. J. Piper, ACS Energy Lett., 2024, 9, 4607–4613 Search PubMed.
- J. Rana, J. K. Papp, Z. Lebens-Higgins, M. Zuba, L. A. Kaufman, A. Goel, R. Schmuch, M. Winter, M. S. Whittingham, W. Yang, B. D. McCloskey and L. F. J. Piper, ACS Energy Lett., 2020, 5, 634–641 Search PubMed.
- A. R. Genreith-Schriever, H. Banerjee, A. S. Menon, E. N. Bassey, L. F. Piper, C. P. Grey and A. J. Morris, Joule, 2023, 7, 1623–1640 CrossRef CAS.
- H. Banerjee, M. Aichhorn, C. P. Grey and A. J. Morris, J. Phys.: Energy, 2024, 6, 045003 CAS.
- H. Banerjee and A. J. Morris, J. Mater. Res., 2025, 40, 2–35 CrossRef CAS.
- H. Banerjee, C. P. Grey and A. J. Morris, Chem. Mater., 2024, 36, 6575–6587 CrossRef CAS.
- N. A. Shah, G. J. Páez Fajardo, H. Banerjee, G. C. Pandey, A. S. Menon, M. Ans, V. Majherova, G. Bree, S. Bolloju, D. C. Grinter, P. Ferrer, P. K. Thakur, T.-L. Lee, M. J. Loveridge, A. J. Morris, C. P. Grey and L. F. J. Piper, ACS Energy Lett., 2025, 10, 1313–1320 CrossRef CAS.
- Z. W. Lebens-Higgins, J. Vinckeviciute, J. Wu, N. V. Faenza, Y. Li, S. Sallis, N. Pereira, Y. S. Meng, G. G. Amatucci, A. V. Der Ven, W. Yang and L. F. J. Piper, J. Phys. Chem. C, 2019, 123, 13201–13207 CrossRef CAS.
- A. G. Squires, L. Ganeshkumar, C. N. Savory, S. R. Kavanagh and D. O. Scanlon, ACS Energy Lett., 2024, 9, 4180–4187 CrossRef CAS PubMed.
- X. Gao, B. Li, K. Kummer, A. Geondzhian, D. A. Aksyonov, R. Dedryvère, D. Foix, G. Rousse, M. Ben Yahia, M.-L. Doublet, A. M. Abakumov and J.-M. Tarascon, Nat. Mater., 2025, 24, 743–752 CrossRef CAS PubMed.
- R. A. House, J.-J. Marie, M. A. Pérez-Osorio, G. J. Rees, E. Boivin and P. G. Bruce, Nat. Energy, 2021, 6, 781–789 CrossRef CAS.
- R. A. House, G. J. Rees, K. McColl, J.-J. Marie, M. Garcia-Fernandez, A. Nag, K.-J. Zhou, S. Cassidy, B. J. Morgan, M. Saiful Islam and P. G. Bruce, Nat. Energy, 2023, 8, 351–360 CrossRef CAS.
- P. E. Blöchl, Phys. Rev. B:Condens. Matter Mater. Phys., 1994, 50, 17953–17979 CrossRef PubMed.
- G. Kresse and J. Hafner, Phys. Rev. B:Condens. Matter Mater. Phys., 1993, 47, 558–561 CrossRef CAS PubMed.
- G. Kresse and J. Furthmüller, Phys. Rev. B:Condens. Matter Mater. Phys., 1996, 54, 11169–11186 CrossRef CAS PubMed.
- J. P. Perdew, K. Burke and M. Ernzerhof, Phys. Rev. Lett., 1996, 77, 3865–3868 CrossRef CAS PubMed.
- H. Das, A. Urban, W. Huang and G. Ceder, Chem. Mater., 2017, 29, 7840–7851 CrossRef CAS.
- K. Saritas, E. R. Fadel, B. Kozinsky and J. C. Grossman, J. Phys. Chem. C, 2020, 124, 5893–5901 CrossRef CAS.
- N. Ramesh, H. Banerjee, J. E. N. Swallow, E. Björklund, A. Dean, P. Didwal, M. Fraser, C. M. E. Phelan, L. An, J. Singh, J. Lewis, W. Song, R. A. House, A. J. Morris, R. S. Weatherup and R. J. Nicholls, Chem. Mater., 2024, 36, 11051–11064 CrossRef CAS PubMed.
- B. Silvi and A. Savin, Nature, 1994, 371, 683–686 CrossRef CAS.
- F. de Groot, Coord. Chem. Rev., 2005, 249, 31–63 CrossRef CAS.
- J. J. Rehr, J. J. Kas, F. D. Vila, M. P. Prange and K. Jorissen, Phys. Chem. Chem. Phys., 2010, 12, 5503–5513 RSC.
- J. J. Kas, F. D. Vila, C. D. Pemmaraju, T. S. Tan and J. J. Rehr, J. Synchrotron Radiat., 2021, 28, 1801–1810 CrossRef CAS PubMed.
- J. J. Rehr and R. C. Albers, Rev. Mod. Phys., 2000, 72, 621–654 CrossRef CAS.
- P. Blaha, K. Schwarz, F. Tran, R. Laskowski, G. K. H. Madsen and L. D. Marks, J. Chem. Phys., 2020, 152, 074101 CrossRef CAS PubMed.
- M. Aichhorn, L. Pourovskii, V. Vildosola, M. Ferrero, O. Parcollet, T. Miyake, A. Georges and S. Biermann, Phys. Rev. B:Condens. Matter Mater. Phys., 2009, 80, 085101 CrossRef.
- M. Aichhorn, L. Pourovskii and A. Georges, Phys. Rev. B:Condens. Matter Mater. Phys., 2011, 84, 054529 CrossRef.
- M. Aichhorn, L. Pourovskii, P. Seth, V. Vildosola, M. Zingl, O. E. Peil, X. Deng, J. Mravlje, G. J. Kraberger, C. Martins, M. Ferrero and O. Parcollet, Comput. Phys. Commun., 2016, 204, 200–208 CrossRef CAS.
- O. Parcollet, M. Ferrero, T. Ayral, H. Hafermann, I. Krivenko, L. Messio and P. Seth, Comput. Phys. Commun., 2015, 196, 398–415 CrossRef CAS.
- P. Werner and A. J. Millis, Phys. Rev. B:Condens. Matter Mater. Phys., 2006, 74, 155107 CrossRef.
- P. Seth, I. Krivenko, M. Ferrero and O. Parcollet, Comput. Phys. Commun., 2016, 200, 274–284 CrossRef CAS.
- K. Held, Adv. Phys., 2007, 56, 829–926 CrossRef CAS.
- R. L. B. Chen, F. N. Sayed, H. Banerjee, I. Temprano, J. Wan, A. J. Morris and C. P. Grey, Energy Environ. Sci., 2025, 18, 1879–1900 RSC.
- G. J. Kraberger, R. Triebl, M. Zingl and M. Aichhorn, Phys. Rev. B, 2017, 96, 155128 CrossRef.
- L. D. Landau, Zh. Eksp. Teor. Fiz., 1956, 30, 1058 CAS.
- K. Held, Adv. Phys., 2007, 56, 829–926 CrossRef CAS.
- A. Savin, R. Nesper, S. Wengert and T. F. Fässler, Angew Chem. Int. Ed. Engl., 1997, 36, 1808–1832 CrossRef CAS.
- E. R. Batista and R. L. Martin, J. Am. Chem. Soc., 2007, 129, 7224–7225 CrossRef CAS PubMed.
- S. K. Saha, H. Banerjee and M. Kumar, J. Appl. Phys., 2021, 129, 085103 CrossRef CAS.
- K.-J. Ylivainio, A. Sufyan and J. Andreas Larsson, J. Phys.: Condens. Matter, 2025, 37, 205502 CrossRef CAS PubMed.
- C. P. Grey, W.-S. Yoon, J. Reed and G. Ceder, Electrochem. Solid-State Lett., 2004, 7, A290 CrossRef CAS.
Footnotes |
| † Electronic supplementary information (ESI) available. See DOI: https://doi.org/10.1039/d5ta03794h |
| ‡ In this case we have an “electron quasiparticle”: an electron in a crystal which behaves as if it had an effective mass m* which differs from its real mass in vacuum, a la Landau51 who suggested that the low-temperature properties of correlated metals can be understood in terms of long-lived quasiparticles with all complex interactions included in Fermi-liquid parameters. The quasiparticle peak is the peak associated with this semi-localized behavior, often seen in Mott transitions at moderate correlation strengths where the strength of interaction U ∼ metal bandwidth W, associated with lower and upper Hubbard bands52. |
| This journal is © The Royal Society of Chemistry 2025 |