
 Open Access Article
 This Open Access Article is licensed under a
 Creative Commons Attribution 3.0 Unported Licence
The impact bimetallic Ni–Fe deposit configuration has on accessing synergy during plasma-catalytic CO2 methanation†
Ahmad Z.
Md Azmi
 a,
Rachelle
Tay
a,
Jiajia
Zhao
b,
Christopher D.
Easton
c,
Aaron
Seeber
c,
Yunxia
Yang
b,
Anthony B.
Murphy
d,
Emma
Lovell
*a and
Jason
Scott
*a
a,
Rachelle
Tay
a,
Jiajia
Zhao
b,
Christopher D.
Easton
c,
Aaron
Seeber
c,
Yunxia
Yang
b,
Anthony B.
Murphy
d,
Emma
Lovell
*a and
Jason
Scott
*a
aParticles and Catalysis Research Group, School of Chemical Engineering, UNSW, Kensington, Sydney, NSW 2052, Australia. E-mail: e.lovell@unsw.edu.au; jason.scott@unsw.edu.au
bCSIRO Energy, 71 Normanby Road, Clayton South, VIC 3168, Australia
cCSIRO Manufacturing, Private Bag 10, Clayton, VIC 3168, Australia
dCSIRO Manufacturing, PO Box 218, Lindfield, NSW 2070, Australia
First published on 17th April 2025
Abstract
Catalytic CO2 methanation in the presence of plasma is of significant industrial interest due to the lower temperature requirements and capacity for electrification. Advancing catalyst design is crucial for improving the feasibility of plasma-catalytic methanation for industrial applications. The potential for harnessing bimetallic catalyst synergies within the plasma-catalytic system exists although understanding in this area remains limited. Here, two distinct synthesis methods were used, wet co-impregnation (WI) and co-deposition precipitation (DP) to load bimetallic Ni–Fe on a γ-Al2O3 support such that the Ni–Fe configuration within the catalyst deposits was regulated to be: (i) segregated Janus-like; (ii) Fe-decorated Ni; and (iii) Fe-encapsulated Ni. The extent of interaction between the Fe and Ni was found to influence the nature of the Ni species within the deposit which, if sufficient, invoked a synergy. More intimate contact between the Ni–Fe or a sufficiently large Fe presence (observed in 10%Ni WI and 10%Fe WI), evidenced by the increase in the fraction of Ni(OH)2 in the deposits, boosted methane productivity by 78% (relative to 10%Ni WI). In the instance where Fe excessively decorated or encapsulated the Ni deposits (observed in the 10%Ni DP and 10%Fe DP) the benefit of bimetallic intimacy was lost (a 90% reduction in methane productivity relative to 10%Ni3%Fe DP). This study highlights the critical role of metal–metal interactions in controlling catalyst performance. The Ni–Fe synergy was found to be translatable between thermal-catalytic and plasma-catalytic environments, underscoring the potential for adapting the benefits of bimetallic catalysts to plasma catalytic systems. The findings from this study will contribute to the development of catalysts toward practical industrial applications.
1 Introduction
Recent significant weather events and an increase in the frequency of natural disasters have been linked to climate change arising from the warming of the Earth's temperature.1 The release of anthropogenic CO2 and its effect on the climate has been singled out as the major cause of climate change.2,3 As such, recent research has focused on carbon capture utilization and storage.4 Using captured CO2 as a feedstock to produce value-added chemicals is viewed as a key strategy to manage CO2 emissions.5 Among these opportunities is the power-to-methane (PtM) concept, which utilizes renewable hydrogen and captures CO2 to produce methane. PtM has the advantages of closing the carbon loop whilst being able to leverage existing natural gas infrastructure.6 However, thermodynamic limitations and the stability of CO2 demand temperatures of approximately 400 °C, in the presence of a catalyst, to achieve practical CO2 conversion and CH4 selectivity.7–10 This also poses challenges in integrating CO2 methanation with renewable feedstocks and energy sources.11 As such, there is growing interest in the plasma-enabled electrification of CO2 methanation using nonthermal plasma (NTP) as an alternative energy input. The non-equilibrium nature of NTP and the presence of high-energy species allows CO2 methanation to be conducted at lower temperatures than thermal catalysis alone12–14 while simultaneously electrifying the chemical reaction.11Supported nickel catalysts are typically adopted for NTP methanation due to their favorable performance and high methane selectivity. For instance, Jwa et al.15 investigated the use of Al2O3, Ni/Al2O3, TiO2/Al2O3 and Ni–TiO2/Al2O3 catalysts and found that samples containing Ni enhanced methane production. Samples without Ni, mainly Al2O3 and TiO2/Al2O3, were not observed to contribute to CO and CO2 methanation. Additionally, Nizio et al.16 demonstrated comparable reaction performances at 90 °C in plasma to 300 °C under thermal conditions using ceria–zirconia-supported Ni catalysts.
Bimetallic arrays often invoke a catalytic synergy in thermal systems, in particular the pairing of Ni with noble metals such as that demonstrated by Pan et al.17 They demonstrated bimetallic synergy with Ni–Ru/CeO2 catalysts where small amounts of Ru (0.2% wt) improved the dispersion of Ni, leading to increased CO2 adsorption. Arandiyan et al.18 demonstrated that bimetallic Rh–Ni nanoalloys increased the presence of surface oxygen vacancies, enhancing CO2 adsorption and achieving 90% CO2 conversion at 308 °C. While the pairing of noble metals with Ni have been studied for CO2 methanation, the high costs have led to researchers opting for more affordable and widely available alternatives. Consequently, Ni–Fe catalysts have become one of the most extensively researched bimetallic catalysts for thermal CO2 methanation.19,20 For example, Serrer et al.21 studied an Ni–Fe/Al2O3 catalyst for thermal methanation where FeOx clusters were postulated to promote CO2 dissociation that dynamically interacted with Ni. Such results motivated the current study on Ni–Fe bimetallic synergy in NTP systems.
In contrast, exploring bimetallic catalysts in a plasma environment for CO2 methanation remains comparatively limited.14 Gao et al.22 investigated NiFe0.25–Al/nickel foam as a catalyst for CO2 methanation within a plasma and observed the improved dispersion of Ni enhanced H2 and CO2 activation. Zhang et al.23 studied bimetallic NiFen/(Mg, Al)Ox catalysts during plasma-assisted CO2 methanation and observed enhanced adsorption and dissociation of CO2 in the presence of Ni3Fe alloys. To date, studies have considered the contribution of each element to NTP bimetallic catalyst synergy, however the arrangement of the individual metals within the catalyst deposits and the ensuing influence on NTP synergy remains unclear. The current work examines the influence of varying Ni–Fe bimetallic catalyst deposit configurations, supported by γ-Al2O3, on NTP CO2 methanation and offers insights into the importance of the mode of metal interaction for facilitating catalytic synergy. The study provides a unique perspective on NTP catalysis by deconvoluting the complex interactions between distinct bimetallic properties and the respective pathways for improving catalyst reactivity in a plasma environment.
2 Experimental
2.1 Catalyst synthesis
Al2O3-supported bimetallic catalysts with varying Ni![[thin space (1/6-em)]](https://www.rsc.org/images/entities/char_2009.gif) :Fe ratios (10%Ni to 1%, 2%, 3%, 4%, 5% and 10%Fe), monometallic catalysts (10%Ni and Fe) and neat Al2O3 were synthesized using wet co-impregnation (WI) and co-deposition precipitation (DP) techniques. For WI synthesis, appropriate amounts of nickel(II) nitrate hexahydrate (Sigma Aldrich, purity ≥98.5%) and iron(III) nitrate nonahydrate (Sigma Aldrich, purity ≥98%) were dissolved in Milli-Q water to give a 0.1 M total metal concentration. Commercial grade γ-Al2O3 (Sigma Aldrich, <50 nm, purity ≥98%) was measured depending on the total nominal weightage of the metals to achieve a final mass of 2 g. The Al2O3 was then added to the solution and stirred at room temperature for 3 h. Next, the solution was dried in an oven at 100 °C for 24 h and calcined in 60 mL min−1 of air (Coregas, dry air) at 450 °C with a ramp rate of 5 °C min−1 for 4 h. The sample was then cooled to room temperature under ambient conditions.
:Fe ratios (10%Ni to 1%, 2%, 3%, 4%, 5% and 10%Fe), monometallic catalysts (10%Ni and Fe) and neat Al2O3 were synthesized using wet co-impregnation (WI) and co-deposition precipitation (DP) techniques. For WI synthesis, appropriate amounts of nickel(II) nitrate hexahydrate (Sigma Aldrich, purity ≥98.5%) and iron(III) nitrate nonahydrate (Sigma Aldrich, purity ≥98%) were dissolved in Milli-Q water to give a 0.1 M total metal concentration. Commercial grade γ-Al2O3 (Sigma Aldrich, <50 nm, purity ≥98%) was measured depending on the total nominal weightage of the metals to achieve a final mass of 2 g. The Al2O3 was then added to the solution and stirred at room temperature for 3 h. Next, the solution was dried in an oven at 100 °C for 24 h and calcined in 60 mL min−1 of air (Coregas, dry air) at 450 °C with a ramp rate of 5 °C min−1 for 4 h. The sample was then cooled to room temperature under ambient conditions.
The DP catalysts were prepared by first adding appropriate amounts of Al2O3, similar to that of WI, Ni and Fe precursors to 250 mL of Milli-Q water. A 5 mL aliquot of Milli-Q water containing 1.024 g of dissolved urea (Sigma Aldrich, ≥98%) was then added to the precursor solution. The combined solution was stirred for 24 h at 90 °C. The solution was left to cool for 0.5 h and monitored to have reached a pH of >6.5. The solids were then recovered by centrifuging (1000 rpm, 10 min). The recovered particles were then washed with 50 mL Milli-Q water and re-centrifuged three times then dried and calcined, similarly to the WI method. Monometallic Ni and Fe catalysts were prepared by the WI and DP methods using the same conditions as the bimetallic catalysts. A neat Al2O3 control was also prepared using the WI and DP techniques without the presence of the Ni and Fe precursors.
2.2 Catalyst characterization
The actual metal loading of the as-prepared catalysts was determined via inductively coupled plasma optical emission spectroscopy (ICP-OES) using an OPTIMA7300 (PerkinElmer). Prior to analysis, the samples were digested in aqua regia with microwave assistance. Specific surface areas (SSA) were determined using N2 physisorption at −196 °C on a Micromeritics Tristar 3030. Samples were degassed under vacuum at 150 °C for 3 h prior to analysis. Hydrogen temperature-programmed reduction (H2-TPR) analyses were conducted on a Micromeritics Autochem 2920 with a thermal conductivity detector (TCD) to measure the reducibility of the different bimetallic catalysts. Prior to analysis, the samples were pretreated under Ar (Coregas, purity >99.99%) at 150 °C with a ramp rate of 5 °C min−1 for 1 h. The sample was then reduced by 10% H2 in Ar (Coregas; 10.05% H2 in Ar balance, purity >99.99%) at a flow rate of 20 mL min−1 and heating from 50 °C to 700 °C (ramp rate 5 °C min−1). An estimated error of ±1 °C was used based on the inherent equipment precision.24 CO2-temperature programmed desorption (CO2-TPD) was performed on a Micromeritics AutoChem HP 2950 equipped with a TCD detector. Samples were pre-treated in the presence of 10% H2 in Ar (Coregas, 10.05% H2 in Ar balance, purity >99.99%) at 50 mL min−1 and at 450 °C with a ramp rate of 10 °C min−1 for 2 h. The sample was then cooled in the presence of He (Coregas, purity >99.99%) at 50 mL min−1 to 50 °C at a ramp rate of −10 °C min−1. The surface of the sample was then saturated with 10%CO2 in He (Coregas, 10.05% CO2 in He, purity >99.99%) at 50 mL min−1 for 1 h after which excess CO2 was removed using He (Coregas, purity >99.99%) at 50 mL min−1 for 0.5 h. TPDs were conducted from 50 °C to 850 °C with a ramp rate of 5 °C min−1. An error of ±1 °C was used based on the precision of the instrument used.25 X-ray diffraction (XRD) was performed using a Bruker D8 Advance A25 X-ray diffractometer with Cu Kα radiation (40 kV, 40 mA) in the 2θ range of 10–90° with a step size of 0.02°. Qualitative analysis of the crystalline phases used the Bruker XRD search match program EVA™6 with identification from the ICDD-JCPDS powder diffraction database. X-ray photoelectron spectroscopy (XPS) measurements were performed using an AXIS Nova spectrometer (Kratos Analytical Inc., Manchester, UK) with a monochromated Al Kα source (180 W, 15 kV × 12 mA) in a vacuum range of 10−9 to 10−8 torr. Survey spectra were acquired at a pass energy of 160 eV with a step size of 0.5 eV, while high-resolution spectra were recorded at a pass energy of 40 eV with a step size of 0.1 eV. Data processing was performed using CasaXPS processing software version 2.3.25 (Casa Software Ltd., Teignmouth, UK). All elements present were identified from survey spectra. The atomic concentrations of the detected elements were calculated using integral peak intensities and the sensitivity factors supplied by the manufacturer. For peak fitting, either a three-parameter Tougaard or Shirley background was used along with analytical Voigt line shapes for individual fitting components. Complex Ni 2p and Fe 2p peak shapes were fitted using an “envelope” approach, discussed elsewhere.26 Based on the nature of the fitting, an error of ±0.1 eV is estimated. The accuracy associated with quantitative XPS is approximately 10–15%.26 For high-resolution transmission electron microscopy (HRTEM) analysis, samples were dispersed in methanol using a sonicator. The mixtures were then drop-casted onto Cu-lacey carbon TEM grids (Electron Microscopy Sciences, LC200-CU-100) and air-dried. The loaded TEM grids were then pre-treated overnight in a vacuum prior to HRTEM analysis using a JEOL JEM-F200 microscope.2.3 Activity tests
Activity tests were conducted under thermal-only or plasma-thermal environments. All tests were undertaken in a custom packed-bed dielectric barrier discharge reactor system described elsewhere.27 Fig. S10† displays the reactor configuration used for thermal and plasma-thermal CO2 methanation. The reactor temperature was controlled by a vertical split tube furnace (Labec, VTFS30-300/12) while a plasma generator (Plasma Leap 1000) generated the plasma discharge. Outlet gas from the reactor was directed through a cold trap to remove moisture and then passed into a gas chromatograph (GC, Shimadzu 2010 plus). Product separation was achieved by an Agilent J&W CarboPlotP7 column with a TCD and a flame ionization detector (FID) used for compound detection.All as-prepared catalysts underwent an ex situ reduction and passivation step in a Micrometrics Autochem 2920. Reduction was conducted in H2 (Coregas, 10.05%H2 in Ar, 20 mL min−1, purity >99.99%) at 600 °C for 1 h with subsequent passivation in O2 (Coregas, 0.97% O2 in He, 10 ml min−1, purity >99.99%) at 50 °C for 12 h. Irrespective of the reaction environment, before activity testing, 150 mg of reduced and passivated catalyst was mixed with 7.3 g of glass beads (Sigma Aldrich, 1 mm). Prior to mixing, the glass beads were calcined in air (Coregas, dry air, 60 mL min−1, purity >99.99%) at 450 °C for 4 h. The glass bead-catalyst blend was then loaded into the annular zone of the reactor. The catalyst bed had a height of ∼100 mm and was reduced at 450 °C with a ramp rate of 5 °C min−1 for 2 h in an H2 (Coregas, 30 mL min−1, purity >99.99%) and N2 (Coregas, 30 mL min−1, purity >99.99%) mixture after which it was cooled to room temperature in 30 mL min−1 N2 (Coregas, 30 mL min−1, purity >99.99%).
Thermal-only methanation tests were conducted in a gas mixture comprising H2 (Coregas, 40 mL min−1, purity >99.99%) and CO2 (Coregas, 10 mL min−1, purity >99.99%) with N2 (Coregas, 10 mL min−1, purity >99.99%) included as an internal standard. Catalyst activity and selectivity were measured across a temperature range of 150 °C to 450 °C in 50 °C increments. The same gas mixture was used for plasma-thermal methanation, where the reaction was conducted under isothermal conditions at 150 °C. This heating was used to prevent water condensation within the bed. Plasma operating conditions were maintained at: voltage = 150 V; discharge frequency = 850 Hz; resonant frequency = 60 kHz; duty time = 100 μs; power = 21 W. Control activity tests were also conducted using glass beads alone.
3 Results and discussion
3.1 Catalyst characteristics
The actual metal loadings of the catalysts are provided in Table 1 with the complete Fe series in Table S1 (ESI†) and are within ∼10% of the nominal loadings. An exception is the 10Ni10Fe sample prepared by WI, where both the Ni and Fe loading are ∼20% below the nominal value. SSA of the WI samples (including the Al2O3 control) are consistently lower than the DP samples, indicating the different synthesis environments mildly alter the surface morphology and/or chemistry of the Al2O3 support.| Sample | Ni actual (wt%) | Fe actual (wt%) | Ni/Fe ratio | SSA (m2 g−1) |
|---|---|---|---|---|
| Al2O3WI | 0 | 0 | — | 138 |
| 10Ni/Al2O3WI | 10.6 | 0.0 | — | 130 |
| 10Ni1Fe/Al2O3WI | 10.5 | 1.1 | 9.5 | 128 |
| 10Ni3Fe/Al2O3WI | 9.9 | 3.3 | 3.0 | 130 |
| 10Ni10Fe/Al2O3WI | 8.0 | 7.8 | 1.0 | 146 |
| 10Fe/Al2O3WI | 0.0 | 10.5 | — | 148 |
| Al2O3DP | 0 | 0 | — | 165 |
| 10Ni/Al2O3DP | 9.6 | 0.0 | — | 157 |
| 10Ni1Fe/Al2O3DP | 9.1 | 1.0 | 9.1 | 158 |
| 10Ni3Fe/Al2O3DP | 9.2 | 2.9 | 3.2 | 168 |
| 10Ni10Fe/Al2O3DP | 8.9 | 9.2 | 1.0 | 153 |
| 10Fe/Al2O3DP | 0.0 | 9.7 | — | 164 |
H2-TPR profiles of the WI and DP samples are presented in Fig. 1A and B, respectively. The 10Ni WI sample exhibits two primary peaks at 221 °C and 433 °C (broad) with evidence of a shoulder (299 °C) on the higher temperature peak. Ni catalysts supported on γ-Al2O3 typically exhibit two reduction peaks, between 300 °C to 450 °C and 450 °C to 650 °C, corresponding to surface NiO species which interact with the support with differing strengths.28 Ni aluminates may also be present although they typically reduce at temperatures >700 °C.29 The 10Fe WI sample presents with three distinct peaks at 254 °C, 389 °C and 665 °C. The peaks are consistent with those in other reports on Fe on Al2O3 and are attributed to (in the order of increasing peak temperature): (i) FeOOH reduction to Fe2O3; (ii) Fe2O3 reduction to Fe3O4; and (iii) Fe3O4 reduction to FeO.30,31 When a small amount of Fe is incorporated with the Ni (10Ni1Fe), the low temperature NiO peak intensity increases and the shoulder peak becomes more prevalent, indicating improved Ni reducibility with Fe presence. Further Fe incorporation for the WI samples (10Ni3Fe, 10Ni10Fe) sees the shoulder peak, in particular, increase further in intensity. The additional intensity increase may also be due to the reduction of the Fe oxide species. An influence of the Ni on Fe reducibility is also apparent as the high-temperature Fe peak (665 °C) from the 10Fe WI sample is not present for the 10Ni3Fe and 10Ni10Fe samples. The Ni–Fe presence appears to alter the reduction of Fe3O4 into FeO or FeAl2O3, underscoring the Ni–Fe interaction.
 | ||
| Fig. 1 H2-TPR and XRD analysis of the as-prepared WI and DP catalysts. A) WI catalysts, B) DP catalysts, i) H2-TPRs profiles, ii) XRD profiles. | ||
H2-TPR profiles for the DP samples exhibit similarities and differences when compared to the WI samples. The 10Ni DP sample offers two primary peaks, a low-temperature peak at 226 °C (similar to the WI sample) and a broad, high-temperature peak at 549 °C (∼120 °C higher than the WI sample). The asymmetry of the high-temperature peak suggests a lower-temperature shoulder may exist, although it is not readily apparent. The 10Fe DP sample displays peaks at 214 °C, 339 °C and 665 °C, similar to that observed for the 10Fe WI sample. Adding the small amount of Fe (10Ni1Fe) reduces the NiO peak intensity and appears to introduce a (low-temperature) shoulder on the high-temperature peak, with the effect also apparent for the 10Ni3Fe sample. With the highest Fe presence (10Ni10Fe), a clear peak appears at 360 °C which aligns with the 339 °C peak for the 10Fe sample. The high-temperature peaks for the 10Ni (549 °C) and 10Fe (665 °C) also disappear with the higher Fe content in the bimetallic sample. Contrasting the profiles for the 10Ni10Fe samples indicates the two synthesis methods impact the reducibility of the two metals in similar and different ways.
XRD spectra for the reduced and passivated WI and DP catalysts are provided in Fig. 1. The cubic NiO (red diamonds, PDF 00-004-0835) and hexagonal Fe2O3 (black triangles, PDF 04-008-8479) species are identified in Fig. 1Aii and Bii, and the crystal phases of the support are provided in Fig. S4 (ESI†). The XRD profiles of the support (Fig. S4, ESI†) reveal clear differences between the WI and DP samples. A combination of corundum (PDF 04-013-1687) and deltalumite (PDF 00-072-0420) phases were observed for all WI samples while DP samples mainly exhibited a deltalumite alumina phase, indicating the synthesis method impacts the structural properties of the support. The neat Al2O3 DP sample also contained bayerite, unlike the other DP samples. Differences in the Ni and Fe crystallography were also observed depending on the synthesis method. Cubic NiO crystals exhibit peaks at 2θ values of 37.2°, 43.3°, 62.8°, 75.4° and 79.3° corresponding to the (111), (200), (220), (311) and (222) crystal planes, respectively. Hexagonal Fe2O3 crystals exhibit peaks at 24.2°, 35.8° and 54.2° corresponding to (012), (110) and (024) crystal planes. The complexity of the Al2O3 support spectrum meant that significant peak overlapping with the Ni and Fe occurred whereby peaks were only clearly observable for the Ni and Fe crystals of sufficient loading and size. Consequently, the NiO species for the WI samples gave significantly clearer signals compared to the DP samples, indicating smaller and more dispersed NiO crystals for the DP samples. Similarly, Fe2O3 was detected only for the WI samples with a 10%Fe loading, while any Fe oxide species were undetectable in the DP sample. While the presence of the Ni and Fe oxides were observed due to the passivation step, the presence of metallic Ni and Fe, if any, were undetectable with the XRD analysis likely due to their small size (<3 nm). The XRD findings highlight the significance of the synthesis method in varying the structural properties of the support, the metal deposits and the subsequent metal–support interactions.
CO2-TPDs for the WI and DP samples are provided in Fig. S3 (ESI†). The CO2-TPDs for the WI samples indicate that loading the Ni onto the Al2O3 boosts CO2 adsorption at lower temperatures (∼100–150 °C). Adding low levels of Fe does not appear to significantly alter CO2 adsorption for the Ni-loaded Al2O3 samples. At the elevated Fe loading (10Ni10Fe), CO2 adsorption at low temperatures remains, although CO2 adsorption at an intermediate temperature (270–370 °C) is no longer distinctly apparent. In the case of the DP samples, Ni addition to the Al2O3 appears to increase CO2 adsorption at intermediate temperatures (∼200–400 °C). Fe addition appears to increase CO2 adsorption at lower temperatures (∼100 °C), with the CO2 adsorption at (∼200–400 °C) attributed to Ni being retained. At the higher Fe loading (10Ni10Fe), low-temperature CO2 adsorption has increased further while the CO2 adsorption at the intermediate temperature appears to have been suppressed. Table S3† summarizes the key findings of the H2-TPR, CO2-TPD and XRD analyses and additional details on the relative H2 consumption and CO2 desorption of the catalysts are provided in Table S4 of the ESI.†
The H2-TPR, XRD and CO2-TPD analyses indicated the 10Ni10Fe samples offered the clearest differences in Ni–Fe deposit characteristics for the two synthesis methods. Consequently, HRTEM imaging (Fig. 2) and EDS mapping (Fig. 3) were performed on the 10Ni10Fe catalysts for both WI and DP syntheses. HRTEM micrographs and EDS mapping of the 10Ni3Fe WI and DP samples are also provided in Fig. S5 (ESI†).
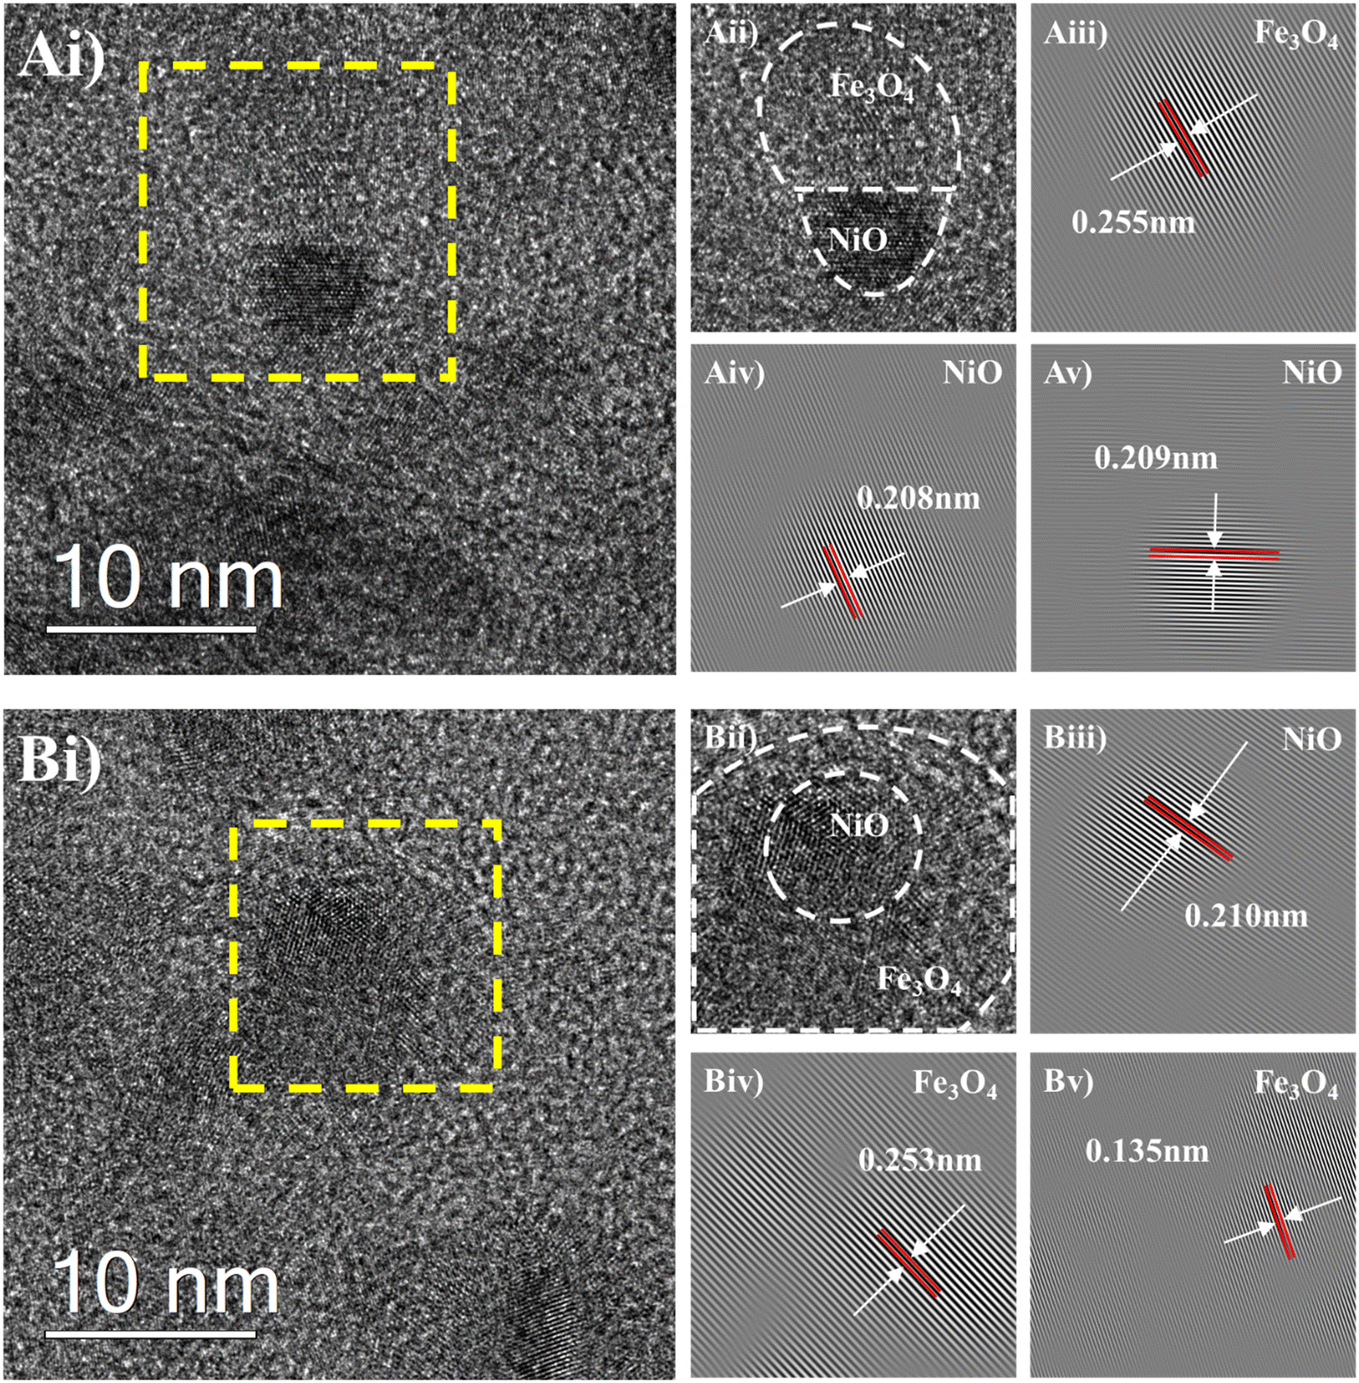 | ||
| Fig. 2 HRTEM micrographs of the reduced and passivated 10Ni10Fe bimetallic catalyst. A) WI; B) DP, i) wide-view micrographs at a 10 nm scale, ii) magnified-view of yellow-dashed highlighted region, iii–v) lattice spacing analysis. | ||
 | ||
| Fig. 3 EDS mapping and line scans of 10Ni10Fe WI and DP catalysts. A) 10Ni10Fe WI, B) 10Ni10Fe DP; i) Ni mapping, ii) Fe mapping, iii) Ni–Fe mapping overlay, iv) Ni–Fe line scans. | ||
HRTEM micrographs of 10Ni10Fe WI (Fig. 2Ai–v) reveal NiO and Fe3O4 have formed a Janus particle-like deposit on the Al2O3 support, where segregated Ni and Fe components are connected via a distinct boundary. Lattice-spacing analysis indicates the smaller, darker fraction of the deposit is the (200) plane of cubic NiO (0.208 nm and 0.209 nm in Fig. 2Aiv and v, respectively). The larger, lighter fraction of the deposit exhibits a lattice spacing of 0.255 nm, corresponding to the (311) plane of Fe3O4 (Fig. 2Aiii).
In contrast, the 10Ni10Fe DP deposits (Fig. 2Bi–v) possess a core–shell-like structure comprising a NiO core surrounded by a Fe3O4 shell. Lattice spacing indicates that the darker core within the deposit is the (200) plane of cubic NiO (0.210 nm in Fig. 2Biii). The lighter shell of the deposit has lattice spacings of 0.253 nm (Fig. 2Biv) and 0.135 nm (Fig. 2Bv), corresponding to the (311) and (620) planes of Fe3O4, respectively. The Fe3O4 crystal structure was also observed to overlap the NiO region, supporting the Ni–Fe core–shell arrangement.
EDS mapping of the 10Ni10Fe WI and DP samples are presented in Fig. 3. EDS mapping of the 10Ni3Fe WI and DP samples can be found in Fig. S6 (ESI†). Fig. S7 in the ESI† shows the particle size distribution of the reduced and passivated samples from HRTEM analysis, based on 45 to 60 counted particles.
Ni and Fe elemental maps for the 10Ni10Fe WI and DP samples illustrate the dispersion of Ni and Fe across both catalysts. Similarly, co-located Ni and Fe are dispersed across the 10Ni3Fe catalysts (Fig. S6, ESI†). The elemental line scan for 10Ni10Fe WI (Fig. 3Aiv) shows a clear overlapping of Ni and Fe, with well-defined, closely aligned boundaries for the scanned deposit. In contrast, the elemental line scan for 10Ni10Fe DP (Fig. 3Biv) shows a clear overlapping of Ni and Fe although the boundaries are not as well-defined nor closely aligned for the scanned deposit. In particular, the Fe extends beyond the Ni deposit boundary, which may reflect the Ni–Fe core–shell arrangement depicted in Fig. 2B. Elemental line scans of the 10Ni3Fe WI and DP samples (Fig. S6, ESI†) demonstrate the co-existence of Ni and Fe in the deposits. The lower Fe loading makes it difficult to discern whether the Ni–Fe deposits in the 10Ni3Fe samples exhibit the same characteristics as the 10Ni10Fe samples. It is possible that the Fe may decorate the Ni deposits for 10Ni3Fe as part of the eventual Fe encapsulation process observed for 10Ni10Fe.
Fig. 4 shows the relative fractions of Ni oxidation states and the surface Ni/Fe atomic ratios from XPS for both reduced and passivated WI and DP samples. The Ni and Fe XPS spectra for the samples are available in ESI† Fig. S7 and S8, respectively. For the WI samples, the fractions of Ni species remain relatively consistent across the 10Ni, 10Ni1Fe and 10Ni3Fe WI samples. However, distinct composition changes are apparent for the 10Ni10Fe WI sample, which is dominated by the Ni(OH)2 species at the expense of the NiO species. The DP samples, in contrast, exhibit variations in Ni species fractions with increasing Fe content across the 10Ni, 10Ni1Fe and 10Ni3Fe samples. The NiO fraction appears to remain consistent with increasing Fe presence, while the Ni(OH)2 presence increases at the expense of NiOOH. Like the WI samples, the 10Ni10Fe DP exhibits distinct changes in the Ni composition relative to the lower Fe loadings. The most prevalent species is Ni(OH)2, while the NiOOH presence has substantially increased at the expense of NiO. For both the WI and DP samples, the Ni/Fe ratio decreases with increasing Fe presence, as expected. However, the Ni/Fe ratio for all DP samples is consistently lower than for the corresponding WI samples, as well as being consistently lower than the bulk DP deposit Ni/Fe ratio (Table 1), again suggesting initial Fe decoration of the Ni deposits leading to in Fe encapsulation at the highest Fe loading. In contrast, the surface Ni/Fe ratio of 10Ni10Fe WI sample remained relatively higher (Ni/Fe = 1.6, Fig. 4A) than that of the bulk WI deposit Ni/Fe ratio (Ni/Fe ratio = 1, Table 1), suggesting that the surface is dominated by surface Ni as opposed to Fe.
 | ||
| Fig. 4 Surface Ni species and Ni/Fe atomic ratios of the catalyst deposits (from XPS) for the reduced and passivated 10Ni, 10Ni1Fe, 10Ni3Fe and 10Ni10Fe samples. A) WI and B) DP. | ||
The XPS findings indicate that, for the WI samples, lower Fe loadings have little influence on the Ni species present, while the higher Fe loading has an impact, supporting the notion that the Ni and Fe are segregated within the deposits. That is, at low Fe loadings, the Ni–Fe segregation restricts its capacity to influence the Ni characteristics. At the highest Fe loading, the barrier invoked by Ni–Fe segregation is diminished and the Fe can influence the Ni species present, promoting the formation of Ni(OH)2 in this case. The propensity of the Fe to promote Ni(OH)2 in the Ni deposits is also illustrated in the XPS findings for the DP samples. The more intimate contact between Fe and Ni introduced by Fe decoration of the Ni deposits amplifies the influence of Fe on the Ni species present, again promoting the formation of Ni(OH)2. As the Fe content increases, the Ni(OH)2 fraction increases arising from the intimacy with Fe. At the highest Fe loading, the Ni deposits are encapsulated by the Fe, where additional effects, such as further Ni oxidation to form NiOOH, occur.
Characterization of the bimetallic Ni–Fe deposits has indicated that there are distinct differences in their make-up based on the synthesis method employed. Loading the Ni and Fe by WI appears to produce segregated Ni and Fe components within the deposit, producing a Janus-like arrangement. In contrast, loading the Ni and Fe by DP appears to initially decorate the Ni deposits with Fe, eventually leading to Ni encapsulation at higher Fe loadings. Schematics visualizing the nature of the catalyst deposits with increasing Fe presence arising from WI and DP synthesis are provided in Fig. 5A and B, respectively.
 | ||
| Fig. 5 Schematics visualizing the evolution of Ni–Fe configurations with increasing Fe presence. A) WI samples portraying segregated Ni and Fe phases; B) DP samples showing decoration followed by encapsulation of Ni with Fe. | ||
3.2 Thermal-catalytic activity and selectivity
The CO2 conversion, CH4 selectivity and CH4 productivity for selected WI and DP samples during CO2 methanation under thermal-catalytic conditions at 300 °C are provided in Fig. 6 with the light-off curves of the complete series of Fe loadings provided in Fig. S11 (ESI†). Apart from the neat Al2O3 controls and 10Fe DP, all catalysts exhibit activity from 250 °C onwards. For the WI catalysts, a low Fe presence appears to have little impact on thermal conversion, and the methane selectivity remains high. For the DP catalysts, a low Fe presence appears to enhance catalyst activity without influencing the high methane selectivity. At higher Fe loading (>10Ni3Fe, refer Fig. S11Aiii†), for the WI sample, there may be a small downturn in activity, although it is not significant, and methane selectivity remains high (>95%, Fig. S11Aii†). For the DP catalysts, higher Fe loadings (>3%) negatively impacts activity while CH4 selectivity is not altered apart from the highest Fe loading ranging between 40% to 44% (10Ni10Fe DP sample, Fig. S11Bii†), where selectivity shifts to favor CO. When Fe alone is present, catalyst activity is significantly diminished, and CO selectivity dominates irrespective of the synthesis method. | ||
| Fig. 6 CO2 conversion and CH4 selectivity during thermal-catalytic CO2 methanation at 300 °C by 10Ni, 10Fe and 10NixFe (where x = 1, 3, 10) Al2O3-supported catalysts. Neat Al2O3 is included as a control. Where: A) WI; B) DP. | ||
The distinct difference in activity and selectivity for the 10Ni10Fe WI and DP catalysts can be attributed to the differences in bimetallic deposit characteristics. The Fe shell in the Ni–Fe DP deposits (Fig. 2B) appears to suppress CO2 methanation by the Ni catalyst and favor CO formation. This is evidenced by the 10Ni10Fe DP catalyst by the substantial drop in CH4 selectivity (Fig. 6B). In contrast, the segregated structure of the 10Ni10Fe WI deposits (Fig. 2A) leaves sufficient Ni exposed such that its catalytic activity is not significantly impacted by the Fe presence (Fig. 6A).
The similarity in light-off and selectivity profiles exhibited by the 10Ni and 10Ni1Fe to 10Ni3Fe DP samples imply the Fe loading for these samples is not sufficiently high for Ni deposit encapsulation. Consequently, adequate Ni is exposed/available for CO2 methanation to occur. However, as the Fe loading continues to increase (10Ni4Fe and 10Ni5Fe; Fig. S11Bi, ESI†) the light-off curves show CO2 conversion is progressively diminished. The negative effect of the extra Fe may result from the more extensive Fe decoration of the Ni deposits, decreasing the amount of exposed Ni catalyst and curbing activity as a result.
The findings illustrate the potential synergy that can exist between Fe and Ni during thermal-catalytic CO2 methanation and, importantly, the arrangement of each metal within the deposit needed to harness the synergy. Evidence of CO2 adsorption by both the Ni and Fe was demonstrated by the CO2-TPDs (Fig. S3, ESI†). The Ni is the primary driving force for CO2 methanation where it facilitates CO2 and CO disassociation, and subsequent hydrogenation into CH4.32,33 In contrast, Fe (or Fe oxides) can absorb CO2 although it does not favor hydrogenation, instead converting it into CO (via the RWGS reaction).34,35 Further, the Fe appears to be less reactive than the Ni in general. However, the Fe can also influence the Ni species present within the deposit, promoting the presence of Ni(OH)2, with the extent to which this occurs defined by the Fe loading and the Ni–Fe intimacy. For instance, the distinct ‘Janus-like’ segregation between the Ni and Fe within the WI-prepared deposits (Fig. 2A) may stifle the potential synergy (Fig. S11Ai, ESI†). Fe decoration of the Ni for the DP-prepared deposits may invoke the potential synergy (Fig. S11Bi, ESI†) up to a point. Eventually, a loading is reached where the Fe presence begins to be detrimental to the Ni. At this point and beyond, the benefit of the Fe decoration is increasingly curbed by the loss of exposed Ni surface available for CO2 methanation. Ultimately, the Ni is encapsulated by the Fe at higher loadings whereby the capacity of Ni to reduce the additional CO generated by Fe is diminished with selectivity towards CO then favored.
3.3 Plasma-catalytic activity and selectivity
Plasma-catalytic activity and selectivity results for the various catalysts at 150 °C during CO2 methanation are displayed in Fig. 7 and S12 (ESI†). All WI samples (including the neat Al2O3 control) exhibit catalytic activity at 150 °C (Fig. 7A) and favor CH4 production. 10Fe is an exception in that, while slightly active, it offers high selectivity towards CO. The addition of Ni to the Al2O3 support boosts CO2 conversion. Low levels of Fe act to mildly suppress Ni activity and gradually decrease CH4 selectivity up to (and including) 10Ni5Fe. Conversely, an elevated Fe presence (10Ni10Fe) approximately doubles CO2 conversion (relative to 10Ni) while retaining high CH4 selectivity.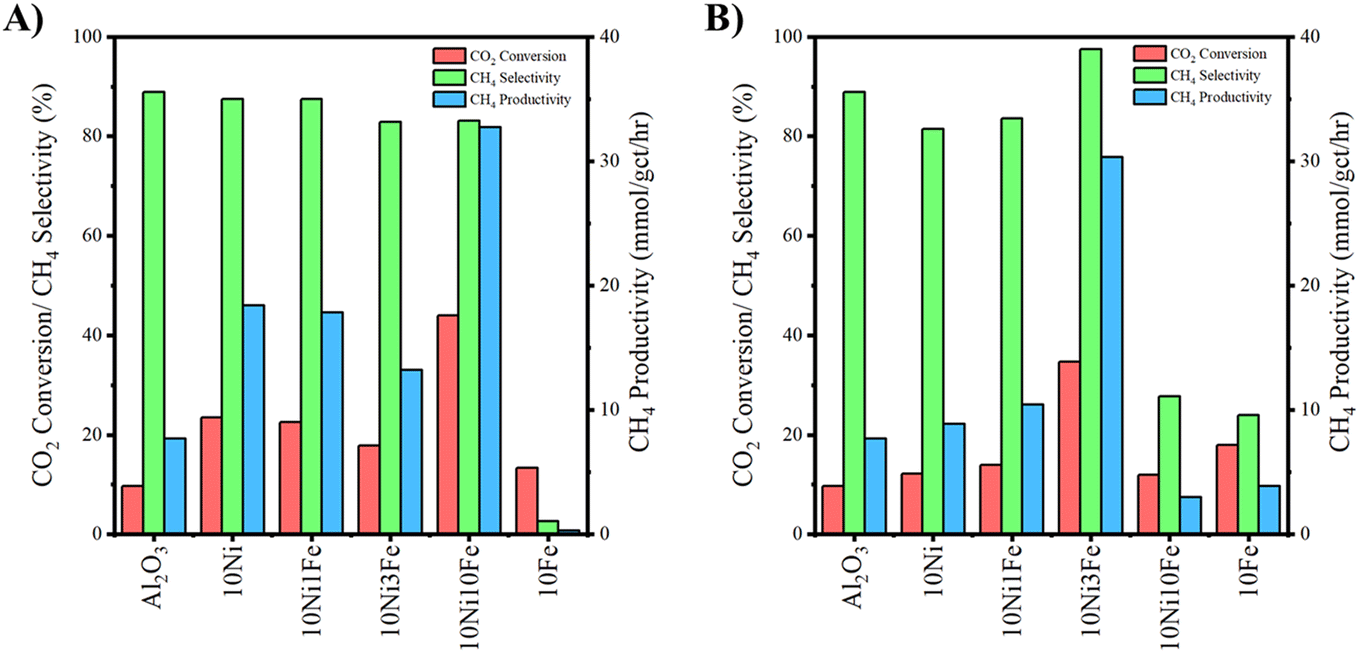 | ||
| Fig. 7 CO2 conversion and CH4 selectivity during plasma-catalytic CO2 methanation at 150 °C by 10Ni, 10Fe and 10NixFe (where x = 1, 3, 10) Al2O3-supported catalysts. Neat Al2O3 is included as a control. Where: A) WI; B) DP. Operating conditions: voltage = 150 V, discharge frequency = 850 Hz, resonance frequency = 60 kHz, duty cycle = 66 μs, power = ∼28 W. | ||
Similar to the WI samples, the DP samples (including the neat Al2O3 control) exhibit catalytic activity at 150 °C as shown in Fig. 7B and S12B (ESI†) and favor CH4 selectivity. 10Fe was again an exception offering high selectivity to CO, which was also the case for the 10Ni10Fe sample. Distinct from the WI samples, adding a small amount of Fe to the Ni boosts CO2 conversion relative to the 10Ni case up until 10Ni3Fe (Fig. S12B, ESI†). The 10Ni3Fe catalyst exhibits the best performance in the plasma environment for all the DP samples. Activity and CH4 selectivity are increasingly diminished beyond the 10Ni3Fe loading, likely due to excessive decoration of the Ni deposits by the Fe, ultimately leading to Ni encapsulation (Fig. 2B) and poor catalyst activity/methane selectivity. The similar activity/selectivity performance exhibited by the 10Ni10Fe and 10Fe catalysts supports this hypothesis.
Regarding the WI samples, where low levels of Fe (up to 10Ni3Fe) had little influence on the thermal catalytic activity of Ni (Fig. 6), under NTP conditions the Fe presence is increasingly detrimental to CO2 methanation activity up to (and including) 10Ni5Fe. Also apparent is the gradual shift towards CO selectivity with increasing Fe loading, which was not observable for the thermal-only case. The difference in performance between the thermal and NTP environments may derive from the plasma boosting the availability of active/reactant species such that the detrimental effect of the Fe presence at low loadings on catalyst performance was observable. In the thermal-only case, at low Fe loadings, the rate-controlling step may have been due to the availability of the reactants such that any negative effect on CO2 methanation activity/selectivity by the Fe was not clearly observable. Further, while the Fe component appears to cover a reasonable section of the Ni deposit for the 10Ni10Fe sample (Fig. 2A), sufficient active sites may have still been available on the exposed Ni to transform the CO2 into CH4 such that any negative effect was small.
Within the plasma environment, a greater presence of active reactant species is likely invoked by the plasma such that the availability of Ni sites on the catalyst becomes rate-limiting. In this circumstance, the potentially detrimental effect of Fe covering a section of the Ni deposits and reducing Ni active site availability for the WI samples may be more apparent, as is illustrated in Fig. S12A (ESI†). The increasing Fe loading up to 10Ni5Fe acts primarily to cover a portion of the Ni deposit surface, reducing CO2 methanation activity by the Ni. The Fe deposits convert CO2 into CO (via the RWGS) reaction (Fig. S12A, ESI†) although the rate at which this occurs is inferior to methanation by the Ni, lowering overall catalyst activity in the plasma environment.
Conversely, the elevated Fe presence in the 10Ni10Fe WI sample significantly boosted CO2 conversion during NTP methanation and shifted product selectivity back towards methane. XPS demonstrated that the Fe loading for this sample was sufficient to change the nature of the Ni species, boosting the presence of Ni(OH)2. The increased presence of Ni(OH)2 and corresponding enhanced activity may point towards the origin of the Ni–Fe synergy in the plasma environment, which is exhibited by this particular sample.
The NTP CO2 methanation activity/selectivity displayed by the DP samples follows a similar trend to the thermal-catalytic DP sample performance, with an optimum Fe loading for 10Ni3Fe. The enhancement introduced by Fe appears to be amplified by the plasma environment relative to the thermal-catalytic case. The increased availability of the active/reactant species in the plasma environment (relative to the thermal-only case) may account for the consistently boosted performance for all catalysts. The Ni–Fe methanation synergy is more consistently present across the bimetallic DP samples and may be attributable to an increased intimacy highlighted by Ni(OH)2 presence, induced by the Fe addition, as illustrated by the XPS (Fig. 4). The more intimate contact between the Fe and Ni for the DP samples provides more Ni(OH)2 which may be responsible for the synergism (akin to the 10Ni10Fe WI sample). At Fe loadings beyond 10Ni3Fe, increasingly excessive coverage of the Ni by the Fe supersedes the benefits of the greater intimacy and is detrimental to catalyst performance. Stability tests for the best performing and monometallic Ni catalysts were conducted over a duration of 2 h (duration constrained by reactor limitations preventing longer operation). Within the 2 h timeframe, CO2 conversion remained within ±10% of the original value, as shown in Fig. S13 of the ESI.†
3.4 Structural influence of catalyst deposit on reaction mechanics
In situ OES analysis of the plasma was performed on the 10Ni3Fe WI, 10Ni10Fe WI, 10Ni3Fe DP and 10Ni10Fe DP samples. Spectra over the wavelength range 430–640 nm, representing the CHO* species, are provided in Fig. 8. The spectral region from 200 nm to 430 nm, representing H2, CO, CO2+, N2 and CH+, can be found in Fig. S14 (ESI†). A control spectrum comprising glass beads alone is provided for comparison. Fig. S14† shows that the relative intensity of peaks representing H2, CO, CO2+, N2 and CH+ (ref. 27) remained consistent irrespective of the catalyst or glass bead control. In contrast, Fig. 8 indicates the intensity of the CHO*27 peaks vary between catalysts. Compared to the glass beads alone, the intensity of the CHO* peaks for 10Ni3Fe WI, 10Ni10Fe WI, 10Ni3Fe DP and 10Ni10Fe DP varies by approximately 29%, 188%, 6% and 2%, respectively. | ||
| Fig. 8 In situ OES spectra of selected WI and DP catalysts over the spectral range of 430 nm to 640 nm during plasma-catalytic CO2 methanation. The in situ OES spectrum for glass beads only is provided as a control. | ||
The in situ OES findings represent the reactive species present in the bulk plasma and may originate from the reactions between: (i) active species generated within the plasma; or (ii) reactants/active species on the catalyst (or glass bead surface), which then desorb into the gas phase. In scenario (i), reactive species can be generated through electron impact excitation and reactions involving excited species and radicals.36 In particular, CO2 and H2 activation can occur in plasma through collisions with electrons and other radicals (Fig. 9D). The activated species can then be further hydrogenated within the plasma leading to CHO* radical formation (Fig. 9D). In scenario (ii), plasma generated species can be altered through surface mediation, where the presence of Ni and Fe oxides can adsorb plasma generated species and promote subsequent hydrogenation into CHO*.
 | ||
| Fig. 9 Postulated influence of different bimetallic Ni–Fe configurations on the CO2 methanation pathways. A) Janus-like segregated Ni and Fe structure, B) Fe-decorated Ni structure C) Ni-core/Fe-shell structure, D) plausible plasma phase reactions, E) influence of bimetallic interactions in structures A and B on plasma methanation, and F) influence of structure C on CO production. | ||
The basicity and reducibility of the prepared catalysts provides additional context on the rate-determining step for the reaction pathway. The H2-TPR analysis for the 10Ni10Fe WI samples underscores the influence of Ni on the reduction of Fe3O4 and increases in peak intensities due to the reduction of both Ni and Fe oxides within the same temperature regions. The lack of peak shifts indicates minimal modification on the reducibility of the Ni, implying limited enhancements in H2 activation. Similarly, while the H2-TPR profiles for the DP samples portray significant peak shifts, the profiles demonstrate the encapsulation of Ni by Fe rather than an enhancement in Ni reducibility. Despite this, the plasma catalytic performance observed in the presence of Ni, relative to activity tests in the absence of Ni, highlights the essential role of Ni in H2 activation for subsequent CH4 production.
In terms of basicity, the relative CO2 desorption at temperatures above 200 °C for all samples was not significantly impacted by the addition of Fe (Table S4 and Fig. S3†). Large variations in the CO2 desorption were however observed in the temperature range of 50 °C to 200 °C. In the case of the WI samples, Fe addition significantly improved the basicity of the catalysts, as observed in the relative CO2 desorption values for the 10Ni3Fe (2.2) and 10Ni10Fe (2.2) samples (Table S4†). Given the segregated phases on Ni and Fe, the improved basicity could derive from the presence of the metals existing separately. In contrast, the DP sample exhibited improved basicity for those catalysts with lower amounts of Fe (10Ni1Fe), peaking at a relative CO2 desorption of 2.1 (refer Table S4†).
While the improvements in basicity are clear, the implications on reaction performance are not. Despite the 10Ni3Fe and 10Ni10Fe WI samples having similar relative CO2 desorption values, the 10Ni10Fe outperformed the 10Ni3Fe by a factor of 2.5 in terms of methane productivity. Similarly, while CO2 desorption was the greatest for 10Ni1Fe DP, the 10Ni3Fe DP sample (with slightly lower relative CO2 desorption) performed significantly better (2.9× methane productivity). This suggests that a balance between H2 and CO2 activation and bimetallic intimacy, more so than catalyst basicity, is required to invoke catalytic synergy.
Given the stark differences in the CHO* species presence in the plasma phase for the WI samples relative to the DP samples, the influence of Fe on the reaction mechanisms is postulated to derive from: i) Fe-promoted chemistry; and ii) Ni surface modification by Fe. The role of Fe and its impact on basicity typically correspond to its ability to convert CO2 into CO via the RWGS reaction.37 Specifically, FeOx catalysts have been reported elsewhere to drive the RWGS reaction.37 The plasma catalytic activity tests here support this observation, where the product selectivity shifts towards CO as more Fe is incorporated into the catalyst for both synthesis methods. Fe may also play a role in stabilizing formate species, which is a crucial intermediary for producing CO and CH4. Medium strength basic sights have been linked to the stabilization of formate species with improved CO2 adsorption.38,39 This may also explain the varying levels of CHO* present in the bulk plasma as formates can hydrogenate into CHO intermediaries (i.e., H* + COO* → HCOO* → CHO* + O*).
The surface modification by Fe, leading to an increased Ni(OH)2 presence, also has the potential to accelerate the formate reaction pathway.40 Beniwal et al.40 reported that Ni-hydroxide was responsible for splitting H2 during CO2 methanation by a NiFe–TiO2 catalyst. They found atomic Fe-oxide clusters and adjacent Ni-hydroxide domains combined to enhance CO2 and H2 activation, respectively. While the presence of Ni(OH)2 may accelerate the reaction pathway, it is more certain that the Ni exists in varying reduced states under reacting conditions. Zhang et al.41 observed that Ni(OH)2, as a precursor to metallic Ni, enhanced CO2 adsorption, attributing this to the increased formation of oxygen vacancies as the Ni was reduced to its metallic state. However, identifying a clear relationship between Ni–Fe catalyst synergy and CHO* production is difficult due to limitations with the characterization technique. Given the large uncertainties in the surface reactions and plasma-catalyst synergies, Fig. 9 summarizes the complexity of interactions and postulates fundamental plasma catalytic interactions for the different Ni–Fe configurations. In this system, plasma-phase reactions were postulated to activate H2 and CO2, which may lead to the subsequent formation of CHO*. Both Ni and Fe is suggested to facilitate CO2 activation, with Ni having the additional roles of activating H2, and the hydrogenation of plasma-activated species and Fe-derived intermediaries.
The Fe promotion of Ni in the current work demonstrated enhanced catalyst performance in the plasma environment. A comparison with other Ni-based bimetallic catalyst literature for the same reaction (Table S6, ESI†) shows that adding metals other than Fe (e.g., Co) to Ni can also boost CO2 methanation activity. While the Fe promotion has demonstrated enhanced performance in the plasma environment, direct comparisons with other studies are challenging due to the scarcity of comparative data.13,14 Furthermore, our system was designed to investigate bimetallic influences on plasma-catalytic methanation rather than to maximize performance. To address this, future research should focus on setting parameters to improve the lack of standardized benchmarks (i.e., varying reactor configurations such as dielectric barrier discharge, gliding arc plasma, microwave plasma, corona discharge plasma and spark plasma) in plasma-catalytic research. From an industrial application perspective, a techno-economic evaluation of plasma catalytic systems remains a challenge. Unlike thermal-catalytic methanation, where reactor configurations and operational conditions are well-defined, plasma-based methanation is highly dependent on reactor design, making cost–benefit analyses currently difficult. Additionally, enhancing the development of in situ and time-resolved characterization techniques will give deeper insight into surface and plasma phase reactions in real-time as conventional characterization methods are unable to effectively capture transient reactions. Furthermore, stability studies and deactivation pathways must be investigated to determine whether plasma-induces catalyst degradation. Unlike conventional thermal catalysis, plasma catalysis introduces additional complexities that require dedicated studies. With this, catalyst regeneration strategies could then be explored as plasma environments may introduce varying sources of deactivation compared to thermal systems.
4 Conclusion
The influence of bimetallic deposit configuration in a Ni–Fe/Al2O3 catalyst and its ability to invoke catalyst synergy for CO2 methanation in a thermal only and thermal-plasma catalytic system was examined. Bimetallic catalysts prepared by WI formed segregated Ni–Fe deposits akin to Janus-like particles. In contrast, bimetallic catalysts prepared by DP produced Fe-decorated Ni deposits at lower Fe loadings leading to Fe-encapsulated Ni deposits at higher Fe loadings. During thermal-catalytic methanation by the WI samples, the Fe presence had little effect on Ni–Fe catalyst performance, irrespective of the Fe loading. The lack of impact was attributed to sufficient availability of Ni active sites under the thermal-catalytic reaction conditions irrespective of the Fe loading. In contrast, the Fe loading influenced thermal-catalytic methanation by the DP samples whereby the intimate contact between Fe and Ni increased the Ni(OH)2 presence which improved catalyst activity. At higher Fe loadings in the DP samples the benefit of Fe inclusion was lost as excessive Fe decoration leading ultimately to encapsulation of the Ni deposits, which was detrimental to catalyst activity.In the plasma-catalytic environment, the effects of the Ni–Fe interaction in the bimetallic deposits were amplified, which was attributed to the greater availability of activated reactant species invoked by the plasma. Consequently, at lower loadings, the Fe was detrimental to plasma-catalytic methanation activity for the WI samples. In this instance, the increasingly larger loss of exposed Ni surface arising from the larger Fe component may account for the decreased activity. In contrast, the highest Fe loading for the WI samples significantly boosted catalyst activity. The boost was proposed to derive from the greater Ni(OH)2 presence in the deposit. The Fe loading in this instance was substantial enough to influence the nature of the Ni in the deposit and invoke the synergism. In the case of the DP samples, the effect of Fe loading on Ni catalyst activity in the plasma environment was similar to the thermal catalytic situation, reinforcing the competing effects of increasing Fe loading on catalyst performance.
Overall, the findings highlight the importance of bimetallic configuration within the catalyst deposits for harnessing any potential synergy between the metal components. Further, the synergism between the metal components in the thermal-catalytic environment was transferable to the NTP-catalytic environment for the Ni–Fe bimetallic catalyst during CO2 methanation. The work provides new insight into the capacity for capturing bimetallic catalyst synergy to further boost catalyst performance within a plasma environment.
Data availability
The data underlying this study is available on request and have been included as part of the ESI.†Author contributions
Ahmad Z. Md Azmi, Jason Scott, Emma Lovell, Yunxia Yang and Anthony B. Murphy conceptualized and designed the project and experiments. Ahmad Z. Md Azmi carried out the catalyst synthesis, characterizations, activity tests, and data analysis, with input from Jason Scott, Emma Lovell, Yunxia Yang, and Anthony B. Murphy. Rachelle Tay assisted with catalyst synthesis, characterizations, and activity testing. Aaron Seeber conducted the XRD analysis, and Jiajia Zhao performed the CO2-TPD experiments. Christopher D. Easton carried out the XPS analysis and contributed to the interpretation of results. Ahmad Z. Md Azmi wrote the manuscript, with feedback and revisions from Jason Scott, Emma Lovell, Yunxia Yang, and Anthony B. Murphy. The graphical abstract was prepared by Ahmad Z. Md Azmi.Conflicts of interest
The authors declare no conflict of interest.Acknowledgements
This work was supported by the Australian Research Council Industrial Transformation Research Program (ITRP) Training Centre for the Global Hydrogen Economy (GlobH2E) (Grant No. IC200100023), ARC Discovery Project (Grant No. DP230101861), Discovery Early Career Researcher Award (DECRA) (Grant No. DE230100789), Commonwealth Scientific and Industrial Research Organisation (CSIRO) – Chinese Academy of Science (CAS) Collaborative Research Fund (OD-222225) and CSIRO Scholarship. The authors also acknowledge the use of the facilities provided by the Mark Wainwright Analytical Centre (MWAC). HRTEM and EDS mapping analyses were conducted at the University of Wollongong by Dr. Lachlan Smillie.References
- Institute for Economics & Peace, Ecological Threat Register 2020: Understanding Ecological Threats, Resilience and Peace, Sydney, 2020 Search PubMed.
- C. Bonneuil, P.-L. Choquet and B. Franta, Glob. Environ. Change, 2021, 71, 102386 CrossRef.
- M. C. MacCracken, in Global Warming and Energy Policy, ed. B. N. Kursunoglu, S. L. Mintz and A. Perlmutter, Springer US, Boston, MA, 2001, pp. 151–159 Search PubMed.
- E. Liu, X. Lu and D. Wang, Energies, 2023, 16, 2865 CrossRef CAS.
- Commonwealth of Australia, in Australia's Long-Term Emissions Reduction Plan, Creative Commons, 2021 Search PubMed.
- K. Ghaib and F.-Z. Ben-Fares, Renewable Sustainable Energy Rev., 2018, 81, 433–446 CrossRef CAS.
- M. Romero-Sáez, A. B. Dongil, N. Benito, R. Espinoza-González, N. Escalona and F. Gracia, Appl. Catal., B, 2018, 237, 817–825 CrossRef.
- K. Stangeland, D. Kalai, H. Li and Z. Yu, Energy Procedia, 2017, 105, 2022–2027 CrossRef CAS.
- H. Wang, Y. Pei, M. Qiao and B. Zong, in Catalysis, Royal Society of Chemistry, 2017, vol. 29, pp. 1–28 Search PubMed.
- W. J. Lee, C. Li, H. Prajitno, J. Yoo, J. Patel, Y. Yang and S. Lim, Catal. Today, 2021, 368, 2–19 CrossRef CAS.
- T. Nozaki, D.-Y. Kim and X. Chen, Jpn. J. Appl. Phys., 2024, 63, 030101 CrossRef CAS.
- M. L. Carreon, Plasma Res. Express, 2019, 1, 043001 CrossRef CAS.
- R. Dębek, F. Azzolina-Jury, A. Travert and F. Maugé, Renewable Sustainable Energy Rev., 2019, 116, 109427 CrossRef.
- S. Ullah, Y. Gao, L. Dou, Y. Liu, T. Shao, Y. Yang and A. B. Murphy, Plasma Chem. Plasma Process., 2023, 43, 1335–1383 CrossRef CAS.
- E. Jwa, Y. S. Mok and S. B. Lee, in WIT Transactions on Ecology and the Environment, WIT Press, 2011, vol. 143, pp. 361–368 Search PubMed.
- M. Nizio, A. Albarazi, S. Cavadias, J. Amouroux, M. E. Galvez and P. Da Costa, Int. J. Hydrogen Energy, 2016, 41, 11584–11592 CrossRef CAS.
- Y. Pan, X. Han, X. Chang, H. Zhang, X. Zi, Z. Hao, J. Chen, Z. Lin, M. Li and X. Ma, Ind. Eng. Chem. Res., 2023, 62, 4344–4355 CrossRef CAS.
- H. Arandiyan, Y. Wang, J. Scott, S. Mesgari, H. Dai and R. Amal, ACS Appl. Mater. Interfaces, 2018, 10, 16352–16357 CrossRef CAS PubMed.
- P. Frontera, A. Macario, M. Ferraro and P. Antonucci, Catalysts, 2017, 7, 59 CrossRef.
- W. Li, H. Wang, X. Jiang, J. Zhu, Z. Liu, X. Guo and C. Song, RSC Adv., 2018, 8, 7651–7669 RSC.
- M.-A. Serrer, A. Gaur, J. Jelic, S. Weber, C. Fritsch, A. H. Clark, E. Saraçi, F. Studt and J.-D. Grunwaldt, Catal. Sci. Technol., 2020, 10, 7542–7554 RSC.
- Y. Gao, L. Dou, S. Zhang, L. Zong, J. Pan, X. Hu, H. Sun, K. Ostrikov and T. Shao, Chem. Eng. J., 2021, 420, 127693 CrossRef CAS.
- Y. Zhang, B. Wang, Z. Ji, Y. Jiao, Y. Shao, H. Chen and X. Fan, Chem. Eng. J., 2023, 465, 142855 CrossRef CAS.
- Micromeritics Instrument Corporation, AutoChem II 2920 Operator Manual (Rev A - Apr 2024), 2024.
- Micromeritics Instrument Corporation, AutoChem HP 2950 Operator Manual (Rev - Jan 2018), 2018.
- A. E. Hughes, C. D. Easton, T. R. Gengenbach, M. C. Biesinger and M. Laleh, J. Vac. Sci. Technol., A, 2024, 42(5) DOI:10.1116/6.0003804.
- F. Ahmad, E. C. Lovell, H. Masood, P. J. Cullen, K. K. Ostrikov, J. A. Scott and R. Amal, ACS Sustainable Chem. Eng., 2020, 8, 1888–1898 CrossRef CAS.
- J. H. Cho, S. H. An, T.-S. Chang and C.-H. Shin, Catal. Lett., 2016, 146, 811–819 CrossRef CAS.
- C. Li and Y.-W. Chen, Thermochim. Acta, 1995, 256, 457–465 CrossRef CAS.
- A. Fakeeha, W. Khan, A. Ibrahim, R. Al-Otaibi, A. Al-Fatesh, M. Soliman and A. Abasaeed, International Journal of Advances in Chemical Engineering and Biological Sciences, 2016, 2(2) DOI:10.15242/IJACEBS.U1215228.
- W. Liu, M. Ismail, M. T. Dunstan, W. Hu, Z. Zhang, P. S. Fennell, S. A. Scott and J. S. Dennis, RSC Adv., 2015, 5, 1759–1771 RSC.
- J. Ashok, S. Pati, P. Hongmanorom, Z. Tianxi, C. Junmei and S. Kawi, Catal. Today, 2020, 356, 471–489 CrossRef CAS.
- S. Rahmani, M. Rezaei and F. Meshkani, J. Ind. Eng. Chem., 2014, 20, 1346–1352 CrossRef CAS.
- A. I. Tsiotsias, N. D. Charisiou, I. V. Yentekakis and M. A. Goula, Nanomaterials, 2020, 11, 28 CrossRef PubMed.
- D. Pandey and G. Deo, J. Mol. Catal. A: Chem., 2014, 382, 23–30 CrossRef CAS.
- N. Wang, H. O. Otor, G. Rivera-Castro and J. C. Hicks, ACS Catal., 2024, 14, 6749–6798 CrossRef CAS PubMed.
- J. Kirchner, J. K. Anolleck, H. Lösch and S. Kureti, Appl. Catal., B, 2018, 223, 47–59 CrossRef CAS.
- D. Wierzbicki, R. Debek, M. Motak, T. Grzybek, M. E. Gálvez and P. Da Costa, Catal. Commun., 2016, 83, 5–8 CrossRef CAS.
- L. He, Q. Lin, Y. Liu and Y. Huang, J. Energy Chem., 2014, 23, 587–592 CrossRef.
- A. Beniwal, D. Bhalothia, Y.-R. Chen, J.-C. Kao, C. Yan, N. Hiraoka, H. Ishii, M. Cheng, Y.-C. Lo, X. Tu, Y.-W. Chiang, C.-H. Kuo, J.-P. Chou, C.-H. Wang and T.-Y. Chen, Chem. Eng. J., 2024, 493, 152834 CrossRef CAS.
- T. Zhang, F. He, J. Zhang and F. Gu, Int. J. Hydrogen Energy, 2023, 48, 5940–5952 CrossRef CAS.
Footnote |
| † Electronic supplementary information (ESI) available. See DOI: https://doi.org/10.1039/d5cy00036j |
| This journal is © The Royal Society of Chemistry 2025 |