
 Open Access Article
 This Open Access Article is licensed under a Creative Commons Attribution-Non Commercial 3.0 Unported Licence
A pH-dependent microkinetic modeling guided synthesis of porous dual-atom catalysts for efficient oxygen reduction in Zn–air batteries†
Tingting
Li‡
a,
Di
Zhang‡
 b,
Yun
Zhang
a,
Danli
Yang
a,
Runxin
Li
c,
Fuyun
Yu
d,
Kengqiang
Zhong
d,
Xiaozhi
Su
e,
Tianwei
Song
f,
Long
Jiao
f,
Hai-Long
Jiang
f,
Guo-Ping
Sheng
d,
Jie
Xu
*c,
Hao
Li
*b and
Zhen-Yu
Wu
*a
b,
Yun
Zhang
a,
Danli
Yang
a,
Runxin
Li
c,
Fuyun
Yu
d,
Kengqiang
Zhong
d,
Xiaozhi
Su
e,
Tianwei
Song
f,
Long
Jiao
f,
Hai-Long
Jiang
f,
Guo-Ping
Sheng
d,
Jie
Xu
*c,
Hao
Li
*b and
Zhen-Yu
Wu
*a
aDepartment of Chemistry, Institute of Innovative Material, Guangdong Provincial Key Laboratory of Sustainable Biomimetic Materials and Green Energy, Southern University of Science and Technology, Shenzhen 518055, China. E-mail: wuzy@sustech.edu.cn
bAdvanced Institute for Materials Research (WPI-AIMR), Tohoku University, Sendai, 980-8577, Japan. E-mail: li.hao.b8@tohoku.ac.jp
cCollege of Chemistry and Materials Engineering, Wenzhou University, Wenzhou, Zhejiang 325035, China. E-mail: jiexu@wzu.edu.cn
dCAS Key Laboratory of Urban Pollutant Conversion, Department of Environmental Science and Engineering, University of Science & Technology of China, Hefei 230026, China
eShanghai Synchrotron Radiation Facility, Shanghai Advanced Research Institute, Chinese Academy of Sciences, Shanghai 201210, China
fHefei National Research Center for Physical Sciences at the Microscale, Department of Chemistry, University of Science and Technology of China, Hefei 230026, China
First published on 28th April 2025
Abstract
The oxygen reduction reaction (ORR) plays a crucial role in diverse energy conversion devices, such as zinc–air batteries (ZABs). Highly-efficient screening, rational design and precise synthesis of active and stable ORR electrocatalysts will advance ZAB technology for practical applications but they remain very challenging. Herein, we utilized a pH-field coupled microkinetic model to identify Fe1Co1–N6 as the optimal dual-atom catalyst (DAC) for ORR in alkaline media. According to theoretical prediction, a Fe1Co1–N–C DAC with a hierarchically porous structure was synthesized by a hard-template method following a CO2 activation process. The prepared Fe1Co1–N–C DAC exhibits superior ORR activity and stability to the benchmark Pt/C catalyst. More impressively, the Fe1Co1–N–C based ZABs exhibit excellent performance including a high open-circuit voltage (1.51 V), a very high energy density (1079 W h kgZn−1), the best-ever rate capability (from 2 to 600 mA cm−2), and ultra-long ZAB lifespan (over 3600 h/7200 cycles under 5 mA cm−2). This work not only demonstrates that highly-efficient screening combined with rational design of DACs with optimal active sites and pore structures can boost their practical applications, but also presents a highly promising and effective way to synthesize different electrocatalysts for diverse applications.
Broader contextNon-noble dual-atom catalysts (DACs) containing two adjacent metal active sites, which can optimize adsorption energies and improve catalytic kinetics, are a class of highly promising ORR catalysts. However, the low efficiency in the development of optimal DACs and unsatisfactory performance in practical energy devices hinder them from practical applications. Here, using pH-field microkinetic models, we rapidly identified and rationally synthesized an efficient Fe1Co1–N–C ORR catalyst with desired Fe1Co1–N6 dual metal atomic sites and hierarchically porous structures. The designed porous Fe1Co1–N–C catalyst not only shows excellent ORR performance in a three-electrode system, but also exhibits outstanding performance in zinc–air batteries. This work provides insights for designing and constructing advanced catalysts for various high-performance energy conversion applications. |
Introduction
The growing challenges of energy scarcity and environmental pollution from traditional fossil fuels require advanced energy devices and technologies.1–3 Rechargeable zinc–air batteries (ZABs), with the merits of high theoretical energy density (1086 W h kg−1), low cost, intrinsic safety and environmentally friendly nature, are considered some of the most promising power devices.2,4–6 The oxygen reduction reaction (ORR) involving multiple proton electron transfer at the air cathode plays a vital role in ZAB performance, including discharge capabilities, cycling stabilities, and energy efficiencies; however, it suffers from sluggish kinetics.6–8 While platinum-based electrocatalysts, e.g., Pt/C, are widely used as the benchmark catalysts with high activity for the ORR, the high cost, natural scarcity, and impurity poisoning limit their feasibility for large-scale practical applications.4,6,8 Therefore, the development of low-cost and high-performance ORR electrocatalysts is of great interest and highly desired.During the past few decades, various non-noble metals/metal-free ORR electrocatalysts have been developed, including metal carbides,9 nitrides,10 oxides,11 sulfides,12 nitrogen doped carbon,13–15 and single-atom catalysts (SACs).7,16–18 Among them, SACs with atomically dispersed metal sites anchored on a substrate have attracted extensive attention, because of maximized atom utilization efficiency, unsaturated and tunable coordination environments, and unique electronic structures.19,20 In particular, metal–nitrogen–carbon (M–N–C, M = Fe, Co, Ni, Cu, and Mn) SACs have been widely reported as promising ORR catalysts with comparable catalytic activity to Pt-based materials.16,21–23 However, their performance is still lagging behind the apex of M–N4–C SACs’ Volcano plot, probably because their inherent electronic structures and symmetric electron distribution, as well as single-metal-atom active sites, have difficulty in breaking the linear scaling relationship among the adsorption energies of various ORR intermediates.24
Recent studies have demonstrated that the construction of dual-atom catalysts (DACs) containing two adjacent metal active sites can optimize adsorption energies, thus effectively improving catalytic kinetics and enhancing the ORR activity of M–N4–C SACs.25,26 DACs with diverse atom-pairs, such as Fe–Cu,27 Cu–Co,28 Fe–Ni,29 Fe–Co,24,30,31 Fe–Mn,32 Co–Ni,33 and Fe–Zn,34 have been reported and exhibit very impressive ORR performance, even surpassing the benchmark Pt/C catalyst. Despite the great progress achieved in the synthesis and applications of DACs during the past few years, there are still some problems that need to be addressed in this field before their practical application. First, current studies mainly rely on the conventional trial-and-error method and lack precise theoretical guidance, which results in low efficiency for the development of optimal DACs. Second, most studies focus on the construction of different dual atom-pairs for performance enhancement and always ignore the creation of hierarchical pore structures, which is highly important for the transport properties of catalysis relevant species and can further improve DACs’ catalytic performance in practical applications. Third, although some DACs exhibit superior ORR performance in traditional three-electrode tests, their performance in practical ZABs, such as rate performance and cycling stability, is still mediocre (stability time <1000 h and the maximum discharge rate <100 mA cm−2), which severely hinders them from practical applications.6,8,35 Therefore, it is highly desired but still very challenging to develop a highly-efficient strategy for the construction of high-performance ORR DACs with optimal active sites and hierarchical pore structures for high-performance ZAB applications.
Here, we report a pH-field coupled microkinetic modeling guided synthesis strategy to construct desired ORR DACs with great practical application potential for ZABs. We firstly conducted theoretical analysis through a comprehensive pH-field coupled microkinetic model to quickly screen optimal DACs for the ORR, which clearly suggests that a DAC with Fe1Co1–N6 structures as active sites is the most active ORR catalyst among SACs, transition metals (TMs), and DACs in alkaline media. Based on this theoretical understanding, we precisely synthesized DACs with Fe1Co1–N6 structures as active sites, specifically Fe1Co1–N–C, and importantly, also created hierarchical pore structures on the DACs by a hard-template method following an activation process. The prepared porous Fe1Co1–N–C DAC displays an outstanding ORR performance, outperforming the benchmark Pt/C catalyst and reference Fe1–N–C and Co1–N–C SACs in a three-electrode system. In situ DRIFTS and Raman studies successfully revealed the main intermediate species in the 4e− ORR process over Fe1Co1–N–C DAC. Furthermore, the Fe1Co1–N–C DAC based ZAB shows excellent performance: it affords a very high energy density of 1079 W h kgZn−1, the best-ever rate capability (from 2 to 600 mA cm−2) as far as we know, and ultra-long ZAB cycling stability of over 3600 h/7200 cycles (150 days) at 5 mA cm−2. The excellent ZAB performance of the Fe1Co1–N–C DAC demonstrates its great practical potential and the importance and advantages of the rational synthesis of DACs.
Results and discussion
pH-field coupled microkinetic modeling of DACs in the ORR
We first applied a pH-field coupled microkinetic model for theoretical analysis to enhance our mechanistic understanding and thereby guide the development of DACs. Fig. 1(a) presents the typical atomic configuration of SACs and DACs. The structure of a central metal atom bonded to four nitrogen atoms is widely recognized as an active and stable site for ORRs and is thus used as the typical configuration for SACs.3,7,19,20 As for DACs, previous studies by Yang et al.36 and Karmodak et al.37 have demonstrated that the M1M2–N–C catalysts depicted in Fig. 1(a) exhibit superior stability among various dual-atom structures. For this type of DAC, the metal atoms are similarly bonded to four nitrogen atoms, with two of these atoms shared between them. Next, we elucidated the reaction steps on M–N–C SACs and M1M2–N–C DACs (Fig. 1(b)). The conventional steps of the ORR proceed via a four-electron mechanism, involving the adsorption of O2*, the formation of HOO*, the cleavage of the O–O bond within HOO*, and the elimination of HO*. The inter-metallic distance in DACs is approximately 2.3 Å, nearly double the length of the O–O bond in O2 (1.24 Å) and HOO* (1.43 Å), suggesting that the cooperative effect of M1 and M2 may not directly facilitate the O–O bond cleavage in O2 and HOO*.38,39 Consequently, the ORR is proposed to transpire independently at the two metallic sites (Fig. 1(b)). To investigate whether the O–O bond in O2 and HOO* would break due to the presence of dual metal sites, we performed additional calculations using the Climbing Image Nudged Elastic Band (CI-NEB) method, as shown in Fig. S1, ESI.† For the adsorption of O2 on the Fe1–Co1–N–C diatomic catalyst, the energy barrier for O–O bond cleavage from the initial molecular state to the final dissociated state is approximately 1.3 eV (Fig. S1a, ESI†), which is not thermodynamically spontaneous. In the case of HOO*, the energy barrier for its transition from the initial to the final state is around 0.75 eV. Additionally, for HOO* adsorbed on Fe–N–C, proton-electron transfer leads to direct O–O bond cleavage with an almost negligible energy barrier.40 Based on these results, we conclude that O2 and HOO* do not undergo direct O–O bond cleavage on the diatomic surface. | ||
Fig. 1 pH-field coupled microkinetic modeling of DACs in the ORR. (a) The typical atomic configuration of SACs and DACs. The distance between the two metal atoms is approximately 2.3 Å in DACs. M = Mn, Fe, Co, Ni, or Cu. (b) ORR mechanisms on SACs and DACs. Both central atoms in DACs can concurrently undergo the ORR. The bond cutoff between metal atoms and oxygen was set to 2.2 Å. (c) EHO*vs. EO* scaling relationship on the above M–N–C catalysts. The slope of DACs is greater than that of SACs, mirroring the behavior observed with surfaces of TMs. (d) Universal scaling relationship of EHO*vs. EHOO* on SACs, DACs, and TMs. (e) EHO*vs. scaling relationship on SACs and DACs. (f) The work function of Fe1Co1–N6–C determined via an implicit solvation model. (g) PZCs for various DACs with distinct metal centers. (h) pH-field activity volcano for DACs, highlighting enhanced positioning of the Fe/Co atop site towards peak activity in alkaline solutions. The electric field from 1.0 to 2.0 V Å−1 corresponds to a pH from 13.4 to 1.3. scaling relationship on SACs and DACs. (f) The work function of Fe1Co1–N6–C determined via an implicit solvation model. (g) PZCs for various DACs with distinct metal centers. (h) pH-field activity volcano for DACs, highlighting enhanced positioning of the Fe/Co atop site towards peak activity in alkaline solutions. The electric field from 1.0 to 2.0 V Å−1 corresponds to a pH from 13.4 to 1.3. | ||
Next, to develop a microkinetic model, we initially calculated data to understand how the binding energies of different species (O*, HOO*, and O2*) correlate with HO* across various materials, including TMs, SACs, and DACs (Fig. 1(c)–(e) and Table S1, ESI†). The relationship between O* and HO* on TMs reveals a slope of 2, a phenomenon coherently elucidated by d-band theory.41 For SACs, this ratio slightly drops to 1.75, attributed to N coordination affecting d-electron states. Conversely, DACs exhibit a d-electron behavior very similar to that of TMs, with a ratio of 2, suggesting fundamentally different adsorption mechanisms between SACs and DACs. Another observed universal trend (HO* vs. HOO*) in DACs (Fig. 1(d)) shares a common intercept with TMs and SACs. In the case of O2* and HO*, we previously identified a linear correlation for strong-binding surfaces on SACs.42 However, for SACs with an EHO* above 1.5 eV, O2*'s binding energy stabilizes around 4.9 ± 0.2 eV, marking a shift from chemical to physical adsorption.42,43 This trend is similar to that observed in DACs. These correlations enable us to employ a single descriptor, EHO*, to create a more accurate activity volcano model, offering an advantage over traditional free energy diagrams.
We further calculated the potential of zero charge (PZC) for DACs to understand how pH levels affect the ORR performance of DACs (Fig. 1(f)). This step is crucial to theoretically determine the strength of the electric field around the catalyst. We used the vacuum level at a very low charge density (less than 1 × 10⁻⁵ e Å−2) to calculate the work function in a model that simulates the solvent environment (see the ESI† for more details). The PZCs stay around −0.70 V relative to the standard hydrogen electrode (SHE) (Fig. 1(g)). Using these PZC values and our established scaling relationships, we then modeled the ORR activity across different electric fields, ranging from 1.0 to 2.0 V Å−1 (Fig. 1(h)). This corresponds to pH levels from very acidic (1.3, shown with a red line) to very basic (13.4, shown with a blue line). The specific modeling approach can be found in the Methods section.
Our models show that in alkaline solutions, the turnover frequency (TOF) approaches the maximum ORR activity when the energy descriptor GHO* is about 1.65–1.70 eV. In all the DACs including Cu1Ni1–N6–C, Cu1Cu1–N6–C, Co1Ni1–N6–C, Cu1Fe1–N6–C, Ni1Ni1–N6–C, Fe1Co1–N6–C, Fe1Fe1–N6–C, Co1Co1–N6–C, Cu1Co1–N6–C, and Fe1Ni1–N6–C, the two metal sites in Fe1Co1–N6–C exhibit the most favorable binding free energies (Table S2, ESI†). This suggests that a Fe1Co1–N6–C catalyst performs better than SACs and other DACs in alkaline environments. To further understand the better performance of DACs, we analyzed the influence of metal atom proximities on the adsorption properties and charge transition. We find that the approaching of the M1 and M2 atoms significantly impacts the adsorption strength of the intermediates in the ORR. For instance, while the adsorption free energy GHO* on Fe1–N–C and Co1–N–C is calculated to be 0.61 and 0.94 eV, it significantly increases to approximately 1.56–1.66 eV on Fe1Co1–N–C. This dual-metal configuration reduces the adsorption strength, thus modifying the ORR catalytic performance. In addition, we also analyzed the activity of M-pyrrolic-N and graphite-N (Fig. S2, ESI†). The adsorption free energies of HO* on Fe-pyrrolic-N, Co-pyrrolic-N, and graphite-N are 0.67 eV, 0.87 eV, and 2.41 eV, respectively. According to the ORR volcano plot for M–N–C materials (Fig. 1(h)), the optimal adsorption free energy of HO* for the most active reaction sites is approximately 1.6 eV. This suggests that while Fe-pyrrolic-N and Co-pyrrolic-N exhibit some ORR activity, their performance is inferior to the active sites in Fe1–Co1–N–C. In contrast, the ORR activity of graphite-N is significantly lower. More analyses on the differential charge densities and Bader charges of the interaction of two metal atoms in DACs can be found in the ESI† (Fig. S3 and Table S3). In acidic environments, our model aligns well with experimental observations; for instance, Fe1Ru1–N6–C demonstrates a GHO* of approximately 1.0 eV, indicating high performance in both alkaline and acidic solutions.39 This underscores its reliability in screening DACs.
Additionally, we compared the binding strengths of metal atoms in Fe1–N–C and Co1–N–C SACs and Fe1Co1–N–C DACs (Fig. S4, ESI†); DACs containing Fe and Co atoms exhibit a significant trend in stability. The binding energy decreases from −10.0 to −10.5 eV for Co-based structures and from −11.5 to −12.2 eV for Fe-based structures when transitioning from SACs to DACs. This consistent enhancement in binding strength suggests that the introduction of a second metal atom significantly improves the structural stability of the catalyst. Based on all the observations above, a DAC with Fe1Co1–N6 structures as active sites is identified as the optimal choice for the ORR catalysts by our pH-field coupled microkinetic modeling, which not only possesses the best intrinsic ORR activity among TMs, SACs, and DACs, but also promises enhanced stability.
Synthesis and characterization of porous Fe1Co1–N–C DAC
ORR catalytic performance is not solely determined by the active sites. Pore structures, which determine the accessibility of active sites and the transport properties of ORR-relevant intermediates, play an equally important role as active sites for ORR performance.44,45 Based on this understanding and our theoretical prediction, a DAC with Fe1Co1–N6 structures as active sites and a porous structure for accessing of active sites is expected to possess an excellent ORR performance. Therefore, we developed a hard-template method following a CO2 activation process for the construction of a porous Fe1Co1–N–C DAC (Fig. 2(a), see the Methods section for details on the synthesis methods).46 Briefly, the SiO2 hard templates (that is, SiO2 nanopowders) were first added into an aqueous solution containing Fe and Co ions, and o-phenylenediamine (oPD). Then ammonium peroxydisulphate ((NH4)2S2O8) was used to polymerize oPD to obtain the SiO2@PoPD composite. Next, the composites underwent pyrolysis, NaOH and H2SO4 etching to afford primary Fe1Co1–N–C. Finally, the prepared primary Fe1Co1–N–C was subjected to a second heat treatment under CO2 to further enhance the porosity, affording the hierarchically porous DAC (denoted as Fe1Co1–N–C). The optimized pyrolysis temperature was found to be 800 °C, and the optimal CO2 activation time was 20 min (Fig. S5 and Tables S4, S5, ESI†). The loading amounts of Fe and Co in Fe1Co1–N–C were determined to be 1.0 and 1.4 wt%, respectively, by inductively coupled plasma-mass spectrometry (ICP-MS; Table S6, ESI†). | ||
| Fig. 2 Synthesis and characterization of Fe1Co1–N–C DAC. (a) Illustration of the preparation procedures of the Fe1Co1–N–C. (b) TEM and (c) HAADF-STEM image of Fe1Co1–N–C with dual atoms marked by red rectangles. (d) and (e) Upper parts are the randomly selected images in the red rectangles in (c), the lower parts are the intensity profiles of dual-atom sites. (f) Statistical distances in the dual-atom sites of Fe1Co1–N–C. (g) Statistical percentage of single atoms and dual atoms for at least 50 sites of Fe1Co1–N–C. (h) EDS mapping images of Fe1Co1–N–C. (i) XRD, (j) N2 adsorption/desorption isotherms, and (k) pore size distribution curves of Fe1Co1–N–C. Note: a. u. means arbitrary units unless otherwise specified. | ||
We first used transmission electron microscopy (TEM) to investigate microstructures of Fe1Co1–N–C, which displays an interconnected vesicular structure with well-defined mesopores originating from SiO2 nanotemplates (Fig. 2(b) and Fig. S6, ESI†). No nanoparticles or clusters can be observed for Fe1Co1–N–C. We further employed high-angular annular dark field scanning transmission electron microscopy (HAADF-STEM) to confirm the presence of atomically dispersed dual-atom sites within Fe1Co1–N–C. The high-resolution HAADF-STEM image (Fig. 2(c)) reveals the coexistence of a large number of dimers (marked by red rectangles) and a small number of single atoms. Statistical distances of adjacent dual-atom sites are about 2.3 Å (Fig. 2(d) and (e)), consistent with our modeled structure in Fig. 1(a). Considering that the distance of 2.3 Å is larger than that of direct bonding between dual-atom sites, it indicates that dual-atoms in Fe1Co1–N–C are adjacent but not bonded. Statistical analysis showed that the dual-atom pairs account for ca. 74% of all discernible bright spots (Fig. 2(d)–(g) and Fig. S7, S8, ESI†). The energy-dispersive X-ray spectroscopy (EDS) mapping images (Fig. 2(h)) show homogeneous distributions of Fe and Co sites over the whole nitrogen doped carbon (N–C) support, suggesting the formation of Fe–Co dual-atom pairs. Moreover, powder X-ray diffraction (PXRD; Fig. 2(i)) reveals the graphitic carbon structure for Fe1Co1–N–C, consistent with the Raman result (Fig. S9, ESI†). The PXRD pattern also confirms no obvious metallic particles or clusters in the Fe1Co1–N–C, which is also revealed by numerous TEM and HAADF-STEM observations. To demonstrate that our developed hard-template method following a CO2 activation process can create hierarchically porous structures within the Fe1Co1–N–C catalyst, we used the N2 sorption method to analyze its pore structures. Fe1Co1–N–C exhibits a type-IV isotherm characteristic for mesoporous materials (Fig. 2(j)); its Brunauer–Emmett–Teller (BET) surface area is 531.5 m2 g−1 (Table S7, ESI†). The pore size distribution curves clearly indicate that the Fe1Co1–N–C possesses abundant micropores and mesopores centered at 1.4 and 6.2 nm (Fig. 2(k)), respectively, suggesting that the hierarchical porous structure has formed within our Fe1Co1–N–C catalyst. In addition, we also synthesized Fe1–N–C, Co1–N–C, and N–C as control samples using the same method. All characterization techniques including TEM, HAADF-STEM, PXRD, Raman, EDS mapping, and N2 sorption demonstrate that they possess similar structure properties to Fe1Co1–N–C (Fig. S10–S18, Tables S6, S7 and Note S1, ESI†).
Atomic and electronic structural characterization of Fe1Co1–N–C catalysts
We conducted X-ray photoelectron spectroscopy (XPS) and X-ray absorption spectroscopy (XAS) analysis to further reveal the atomic structures of our catalyst and explore the compositions and chemical states of the surface elements (Fig. 3). In the XPS results (Fig. 3(a) and Fig. S19a, ESI†), the high-resolution Fe 2p spectra at 711.3, 722.5 eV and 713.9, 725.6 eV for Fe1Co1–N–C and Fe1–N–C can be assigned to Fe2+ and Fe3+, respectively. Two peaks at 718.2 and 731.1 eV are the satellite peaks.30,32,47 Similarly, the prominent peaks of Co 2p3/2 (∼780.9 eV) and Co 2p1/2 (∼796.2 eV) with the corresponding satellite peaks (∼786.2 and ∼803.5 eV) appear in the Fe1Co1–N–C and Co1–N–C (Fig. 3(b)) spectra.32,48 XPS results suggest that both Fe and Co elements are in the oxidative states in these catalysts. No obvious Si 2p XPS signal was detected for all the catalysts, suggesting that the SiO2 templates had been completely removed (Fig. S19b, ESI†).49 Meanwhile, the N 1s spectra of all the catalysts show the presence of pyridinic N (397.8 eV), pyrrolic N (399.5 eV), graphitic N (400.9 eV), and oxidized N (404.1 eV) species (Fig. 3(c)).22,28,50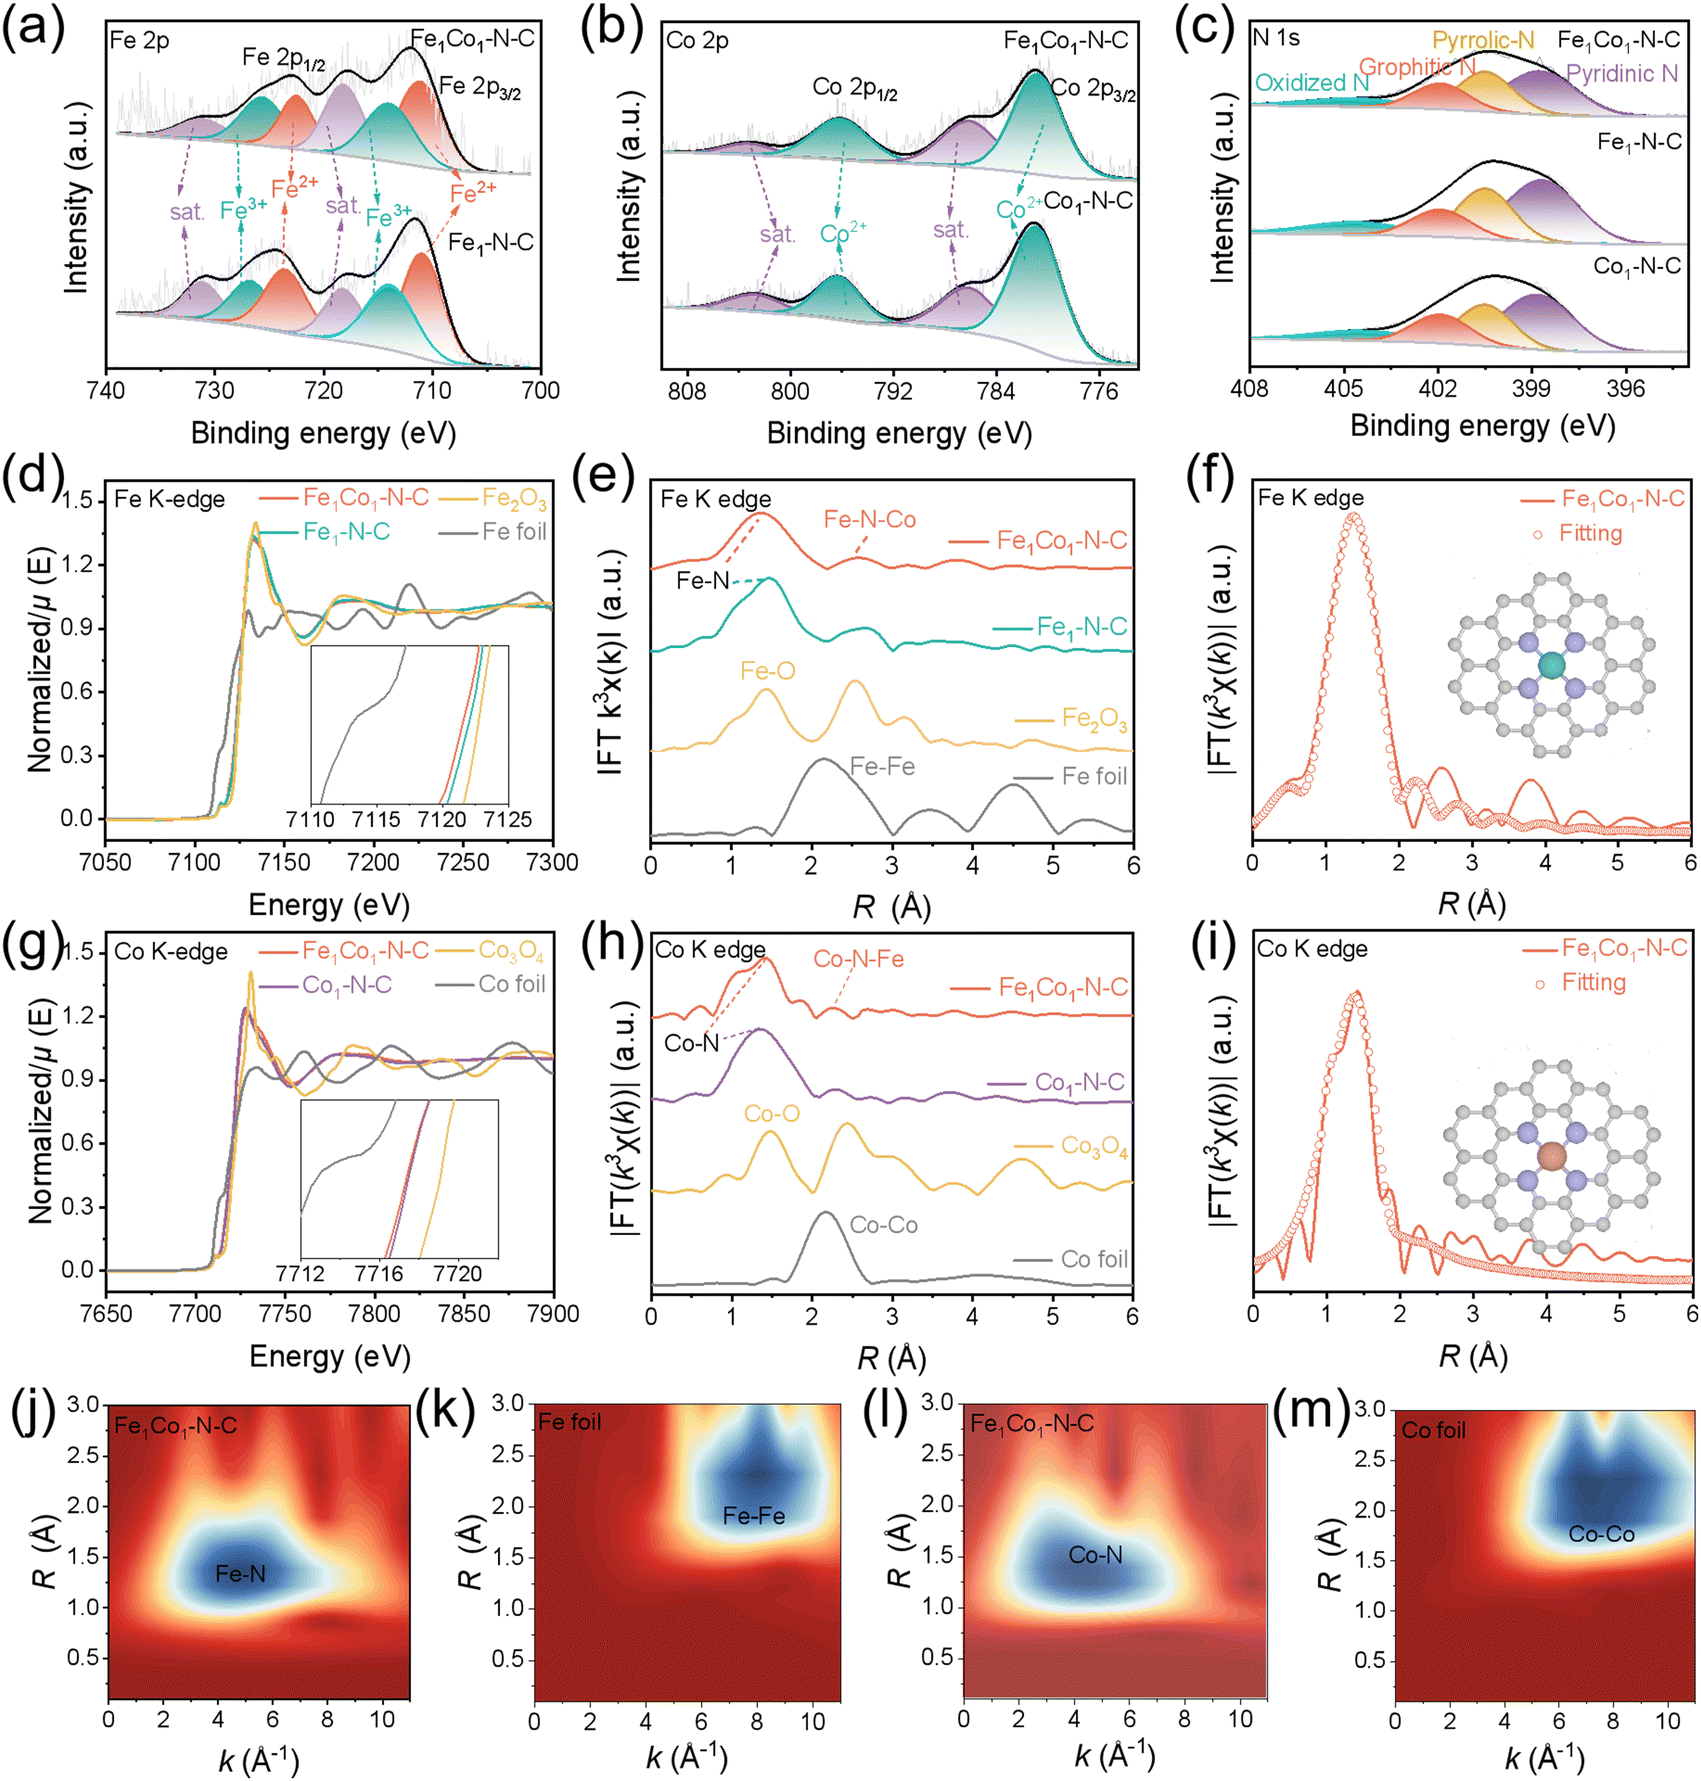 | ||
| Fig. 3 Surface properties, atomic and electronic states of Fe1Co1–N–C and reference catalysts. High-resolution XPS spectra of (a) Fe 2p, (b) Co 2p, and (c) N 1 s for Fe1Co1–N–C, Fe1–N–C, and Co1–N–C. (d) Fe K-edge XANES spectra of Fe1Co1–N–C, Fe1–N–C, Fe2O3, and Fe foil. (g) Co K-edge XANES spectra of Fe1Co1–N–C, Co1–N–C, Co3O4, and Co foil. FT EXAFS spectra at the R space of (e) Fe and (h) Co. (f) and (i) FT EXAFS spectra and the corresponding curve-fitting results of the Fe1Co1–N–C. Inset: Schematic models: Fe (green), Co (orange), N (purple), and C (gray), respectively. (j)–(m) WT of χ(k) of Fe and Co for Fe1Co1–N–C, Fe foil, and Co foil. R is the bond length; FT means Fourier transform; WT is Wavelet transform. In the Fe1Co1–N–C DAC, FeN4 and CoN4 sites mainly exist in the form of the Fe1Co1–N6 model with a non-bonding Fe–Co path; in Fe1–N–C and Co1–N–C SACs, FeN4 and CoN4 structures are the metal active sites, respectively. | ||
In the Fe K-edge X-ray absorption near-edge structure (XANES) spectra, the near-edge absorption of Fe1Co1–N–C is located between Fe foil and Fe2O3 and is lower than Fe1–N–C (Fig. 3(d)). The valence states of Fe in the Fe1Co1–N–C and Fe1–N–C samples are between Fe0 and Fe3+.21,24,51,52 Furthermore, the Co K-edge XANES spectra (Fig. 3(g)) show the white line intensity and the pre-edge energy of Fe1Co1–N–C and Co1–N–C are located between Co foil and Co3O4, suggesting the Co valence state is also positive.16,24,31,53 The XANES spectra results are consistent with the XPS analysis.
Fourier transformed (FT) R-spaced extended X-ray absorption fine structure (EXAFS) spectra of Fe1Co1–N–C show the prominent peaks at around 1.42 and 2.50 Å attributed to the first shell Fe–N and Fe–N–Co coordination scattering in Fe1Co1–N–C (Fig. 3(e)).54,55 No Fe–Fe scattering paths were found at 2.22 Å in Fe1Co1–N–C and Fe1–N–C, indicating the absence of Fe clusters or nanoparticles in Fe1Co1–N–C and Fe1–N–C. In the FT R-spaced EXAFS spectra at the Co K-edge (Fig. 3(h)), Fe1Co1–N–C and Co1–N–C both exhibit the Co–N peak at around 1.48 Å with no Co–Co peak (2.1 Å), confirming the atomic-scale dispersion of Co species. Additionally, there is a small peak at 2.25 Å in the Co K-edge EXAFS of Fe1Co1–N–C, which can be attributed to Co–N–Fe.54–56 Considering the EXAFS results and HADDF-STEM observations, Fe1Co1–N–C with Fe–Co dual-atom pairs was successfully synthesized. To reveal the atomic structures of Fe1Co1–N–C DAC, Fe1–N–C, and Co1–N–C SACs, we performed fitting for the EXAFS spectra. The fitting of the Fe configuration for Fe1Co1–N–C, Fe1–N–C, Fe foil, and Fe2O3 is shown in Fig. 3(f), Fig. S20a, S21a–c, S22a, b, S23a–c, and Table S8, ESI.† The coordinated numbers are both about 4, and the bond lengths between Fe and N are around 2.0 Å for both Fe-containing catalysts (the inset in Fig. 3(f)). Co K-edge EXAFS fitting results show that the Co site is also bonded with four contiguous N atoms to form a Co–N4 structure in Fe1Co1–N–C and Co1–N–C, and the average bond lengths of Co–N are 1.93 and 1.97 Å, respectively (Fig. 3(i), Fig. S20b, S21d–f, S22c–d, S23d–f, and Table S9, ESI†). Wavelet transform (WT) analysis was further performed to investigate the Fe, Co K-edge EXAFS oscillations of Fe1Co1–N–C (Fig. 3(j) and (k)). Fe1Co1–N–C demonstrates an intensity maximum at (4.80 Å−1, 1.34 Å) with much smaller wave vector k and bond length R than Fe foil (8.02 Å−1, 2.32 Å), indicating a lower coordinated atomic number and shorter bond length for Fe atoms in Fe1Co1–N–C. This could be attributed to the Fe–N bonding. Similar results for Co atoms were obtained from Co K-edge WT analysis (Fig. 3(l) and (m)). We also calculated the ratio of DACs and SACs by using the EXAFS spectrum and the peak fitting results from the XANES spectrum (Fig. S24, ESI†).57 Combining the above HAADF-STEM observations and XAFS analysis, we can conclude that FeN4 and CoN4 sites mainly exist in the form of a Fe1Co1–N6 model with a non-bonding Fe–Co path in Fe1Co1–N–C, which agrees well with our predicted structures with optimal performance. Additionally, FeN4 and CoN4 structures represent the metal active sites for Fe1–N–C and Co1–N–C, respectively.
ORR performance
With desirable Fe1Co1–N6 active sites and porous structures, Fe1Co1–N–C DAC is expected to exhibit excellent ORR performance. Therefore, we carried out rotating disk electrode (RDE) tests in 0.1 M KOH to investigate its ORR performance. The reference catalysts including Fe1–N–C, Co1–N–C, and N–C as well as the benchmark Pt/C catalyst were also tested under the same conditions for comparison. The cyclic voltammetry (CV) curves in Ar- or O2-saturated electrolyte were recorded in the potential range from 0 to 1.2 V (Fig. S25, ESI†). The cathodic peak occurring on Fe1Co1–N–C is more positive than those of Fe1–N–C, Co1–N–C, N–C, and Pt/C catalysts, which indicated that the Fe1Co1–N–C DAC exhibits the best catalytic capability for the ORR among all the tested catalysts. We further evaluated the ORR catalytic activity by linear sweep voltammetry (LSV) (Fig. 4(a)). The Fe1Co1–N–C catalyst exhibits a more positive onset potential (Eonset, 1.00 V) and half-wave potential (E1/2, 0.882 V) than those of benchmark Pt/C (Eonset, 0.97 V; E1/2, 0.851 V), Fe1–N–C (Eonset, 0.98 V; E1/2, 0.847 V), Co1–N–C (Eonset, 0.94 V; E1/2, 0.848 V), and N–C (Eonset, 0.88 V; E1/2, 0.772 V). Additionally, the kinetic current density (Jk) of Fe1Co1–N–C at 0.85 V (13.0 mA cm−2) is superior to Pt/C (3.88 mA cm−2), and also higher than Fe1–N–C (4.6 mA cm−2), Co1–N–C (4.5 mA cm−2), and N–C (0.1 mA cm−2) (Fig. 4(b)). The better ORR activity of Fe1Co1–N–C than those of SACs and TMs can be attributed to the fact that the Fe1Co1–N6 dual metal sites in Fe1Co1–N–C exhibit the most favorable binding free energies for intermediates in the ORR process. Moreover, the fitted Tafel slope for Fe1Co1–N–C (60 mV dec−1) is much lower than Fe1–N–C (76 mV dec−1), Co1–N–C (79 mV dec−1), and Pt/C (85 mV dec−1), evidencing the Fe1Co1–N–C DAC has the most efficient ORR kinetics among all of the tested catalysts (Fig. 4(c)). In addition, the electrical double layer capacitance (Cdl) of Fe1Co1–N–C is up to 90.0 mF cm−2, higher than SACs (Fe1–N–C: 82.7 mF cm−2, Co1–N–C: 78.5 mF cm−2) and N–C (35.6 mF cm−2), indicating that the Fe1Co1–N–C has the largest accessible electrochemical surface area (ECSA, 884.1 cm2) (Fig. S26, ESI†). Of note, the ECSA normalized LSV curves show Fe1Co1–N–C still exhibits the best activity, which indicates its intrinsically highest activity,58,59 agreeing well with our simulation results (Fig. S27, ESI†). | ||
| Fig. 4 Electrochemical ORR performance evaluated by RDE and RRDE tests. (a) LSV curves, (b) comparison of E1/2 and Jk at 0.85 V, and (c) Tafel plots for Fe1Co1–N–C and reference samples (Fe1–N–C, Co1–N–C, and Pt/C). (d) Polarization curves of Fe1Co1–N–C at different rotation rates and (e) the K–L fitting lines at different potentials. (f) H2O2 yield and the electron transfer number (n) values for Fe1Co1–N–C and Pt/C. (g) Normalized chronoamperometric curves of the ORR for Fe1Co1–N–C and Pt/C during 48 h stability tests. (h) Chronoamperometric methanol resistance tests of Fe1Co1–N–C and Pt/C. (i) Activity comparison of Fe1Co1–N–C with other reported ORR catalysts. The Fe1Co1–N–C exhibits a high ORR catalytic activity and excellent stability in the three-electrode system. | ||
The Koutecky–Levich (K–L) equation was used to further elucidate the ORR process. According to the K–L plots, the electron transfer number (n) is determined to be 3.9 for Fe1Co1–N–C (Fig. 4(d) and (e)), which is higher than other reference catalysts (Fe1–N–C: n = 3.8; Co1–N–C: n = 3.8; N–C: n = 3.3; Fig. S28, ESI†), demonstrating a four-electron pathway and high selectivity for reducing O2 to OH− over Fe1Co1–N–C. Moreover, we employed rotation ring-disk electrode (RRDE) tests to assess hydrogen peroxide (H2O2) production and determine the number of electrons transferred (n) during the ORR process (Fig. 4(f) and Fig. S29, ESI†). The H2O2 yield of Fe1Co1–N–C is less than 7% over wide potentials (0.2 to 0.8 V). The value of n is 3.9 and very close to commercial Pt/C (n ≈ 4.0), suggesting once again that Fe1Co1–N–C shows a high-efficiency 4e− ORR pathway.
The stability plays a crucial role in practical applications. We thus investigated the stability of Fe1Co1–N–C for the ORR by chronoamperometry (i–t) and CV cycling tests. The i–t measurements (Fig. 4(g) and Fig. S30, ESI†) show that Fe1Co1–N–C well retains its pristine catalytic activity even with a slight increase after a 48 h test (at 0.6 V, in an O2-saturated electrolyte, at 1600 rpm). The slight improvement in ORR performance for the Fe1Co1–N–C catalyst after the stability test should be attributed to the surface activation process during the stability test. The prepared Fe1Co1–N–C catalyst is a highly porous material. During the stability test process, more active sites were gradually exposed to O2 dissolved in the electrolyte, resulting in improved catalytic activity. This performance surpasses that of commercial Pt/C (88% retention) as well as SACs (Fe1–N–C with 96% retention; Co1–N–C with 98% retention). The poor stability of Pt/C catalysts in alkaline ORR is mainly due to three main factors: (1) surface reconstruction and dissolution of Pt; (2) agglomeration of Pt nanoparticles during prolonged operation; and (3) corrosion of the carbon support. In addition, the excellent stability of Fe1Co1–N–C was also confirmed by CV cycling tests; only a 2 mV negative shift on E1/2 is observed for Fe1Co1–N–C after 5000 continuous cycles (Fig. S31, ESI†), much lower than that of commercial Pt/C (20 mV). Importantly, we found the chemical properties of Fe1Co1–N–C were well retained (Fig. S32, ESI†) after the stability test, further suggesting its excellent stability toward the ORR. In addition, Fe1Co1–N–C also exhibits excellent methanol-poisoning resistance with negligible decay in the current density after injecting 3 M methanol (Fig. 4(h)), superior to the Pt/C catalyst. Impressively, the ORR performance in terms of Eonset and E1/2 of our Fe1Co1–N–C is among the best of recently reported carbon-based SACs, DACs and other catalysts (Fig. 4(i) and Table S10, ESI;† all these literature data are also available in the Digital Catalysis Platform database for reliable comparison: https://www.digcat.org/).60 Briefly, using the pH-field coupled microkinetic model, the Fe1Co1–N–C DAC was synthesized with desired Fe1Co1–N6 dual metal atomic sites and porous structures, which exhibits high ORR catalytic activity and excellent stability in a three-electrode system.
In situ studies
To reveal the ORR mechanism over the Fe1Co1–N–C DAC, we first carried out in situ attenuated total reflection surface-enhanced infrared adsorption spectrum (ATR-SEIRAS) testing during the ORR process (Fig. 5(a)). Three sets of in situ DRIFTS spectra are observed under different potentials (Fig. 5(b)–(d)). A characteristic C–N stretching vibration of Fe1Co1–N–C is observed at 1338 cm−1 (Fig. 5(b)).61 During the negative potential scan, the intensity and frequency of the C–N peak remains nearly constant until 0.9 V; subsequently, the intensity begins to decrease, while the frequency shifts to a higher wavenumber until reaching 0.7 V; ultimately, both the intensity and frequency stay constant below 0.4 V. The meaningful transformations in intensity and frequency of the C–N peak during the ORR process matches very well with the electrochemical conversion behavior of O2, indicating a strong electronic interaction between O2 and the Fe1Co1–N–C during the ORR process.61,62 The peaks at 1440 and 1230 cm−1 belong to surface-adsorbed O2* and HOO* species, respectively (Fig. 5(c) and (d)).63,64 To better illustrate the spectroscopic variations of intermediates during the negative potential scan, the area of 1440 and 1230 cm−1 peaks were plotted as functions of the potential (Fig. 5(e)). With the decreased potentials, the kinetics of the ORR is accelerated and the absorption peak of O2* begins to intensify until 0.8 V, after which the peak gradually diminishes; simultaneously, the HOO* peak area is observed to weaken as the potential becomes more negative-going (Fig. 5(c)–(e)). This suggests the robust binding of *OOH to the electrode surface destabilizes the O–O bond, ultimately resulting in the complete reduction of O2. Furthermore, we also performed in situ Raman spectroscopy tests during electrochemical experiments (Fig. 5(f) and Fig. S33, ESI†). The peaks of O2* and HO* adsorbed on the catalyst surface are found in 1112 and 714 cm−1 (Fig. 5(g)).65–67 As the potential decreases from 1.0 to 0.8 V, the peak area of the O2* increases (Fig. 5(h) and Fig. S34, ESI†), which indicates that the adsorption of O2 on the Fe1Co1–N–C surface gradually reaches the maximum; after that, it diminishes gradually. Simultaneously, the peak area of the HO* increases, reaching its peak at 0.6 V, and then gradually diminishes until it disappears completely. These experimental observations agree well with our theoretical model: at higher potentials, the rate-limiting step shifts from the reaction of O2* to HOO*. However, as the potential decreases, the rate-limiting step transitions to the reaction from HOO* to O*. Consequently, in experiments, we observe that O2* and HOO* progressively accumulate on the electrode surface as the electrode potential decreases and eventually form OH−. Based on electron transfer number measurements and in situ tests, we can conclude that the Fe1Co1–N–C catalyst participates in the typical 4e− ORR pathways involving the adsorption of O2*, the formation of HOO*, the cleavage of the O–O bond within HOO*, and the elimination of HO*, consistent with our proposed ORR mechanism (Fig. 1(b)). | ||
| Fig. 5 In situ ATR-SEIRAS and in situ Raman studies for the ORR mechanism. (a) and (f) Scheme of the in situ ATR-SEIRAS and in situ Raman spectroscopy equipment. The working electrode, reference electrode, and counter electrode are abbreviated as WE, RE, and CE, respectively. (b)–(d) and (g) In situ ATR-SEIRAS and Raman spectra were recorded at different potentials for the Fe1Co1–N–C catalyst during the ORR process. Peak area variations were taken from in situ (e) ATR-SEIRAS and (h) Raman spectra for Fe1Co1–N–C. Potential dependence of the normalized peak area of (e) in situ ATR-SEIRAS for O2* (1400 cm−1) and HOO* (1230 cm−1), and (h) in situ Raman for O2* (1112 cm−1) and HO* (714 cm−1). | ||
ZAB performance
To evaluate the application potential of Fe1Co1–N–C in energy conversion devices, a ZAB was assembled by applying Fe1Co1–N–C as the catalyst for the air cathode and zinc foil as the anode with 6 M KOH + 0.2 M Zn(Ac)2 solution as the electrolyte (Fig. 6(a)). The Fe1Co1–N–C based ZAB exhibits a higher open-circuit voltage (1.51 V) and a larger maximum peak power density (234 mW cm−2, Fig. 6(b) and (c), Fig. S35, and Table S11, ESI†) than the ZABs based on Pt/C (1.47 V and 163 mW cm−2, respectively). When normalized to the mass of zinc consumed, the specific capacity of the Fe1Co1–N–C based ZAB is over 836.5 mA h gZn−1 (corresponding to an energy density of ca. 1079 W h kgZn−1) at a current density of 10 mA cm−2, which corresponds to ca. 99.4% utilization of the theoretical energy density (ca. 1086 W h kgZn−1). When the current density was increased to 20, 50, and 100 mA cm−2, the specific capacity of the battery is 794.2, 750.1, and 436.4 mA h gZn−1 (corresponding to an energy density of ca. 976.9, 817.6, and 405.9 W h kgZn−1), respectively (Fig. 6(d)), indicating that the Fe1Co1–N–C catalyst possesses outstanding ORR activity performance. In addition, we further tested the rate capability of the Fe1Co1–N–C based ZAB from 2 to 5, 10, 20, 50, 100, 300, 500, and 600 mA cm−2, which has very high discharge voltages of 1.38, 1.34, 1.31, 1.27, 1.18, 1.07, 0.85, 0.63, and 0.40 V, exhibiting superior rate performance. Importantly, it also displays a superb reversibility for 11 cycles, which is much better than Fe1–N–C, Co1–N–C, N–C, and Pt/C based ZABs (Fig. 6(e) and (f), and Fig. S36 and S37, ESI†). As far as we know, the rate capability is the best one reported for ZABs to date (Table S12, ESI†). Impressively, the Fe1Co1–N–C based ZAB can power a phone and light-emitting diodes (LEDs), affirming the great application potential of Fe1Co1–N–C in energy devices (Fig. 6(g) and (h), and Video S1, ESI†). In order to further carry out long-term galvanostatic discharge–charge cycling, Fe1Co1–N–C was mixed with RuO2,68 a typical oxygen evolution reaction (OER) catalyst, and used as the catalyst for the air cathode. Two independent ZABs were assembled simultaneously and both demonstrate excellent and repeatable cycling stability over 3200 h (Fig. 6(i) and Fig. S38, ESI†). In particular, one ZAB displays an ultra-long stability for over 3600 h/7200 cycles with a 30 min per cycle period, which represents one of the most stable ZABs reported in the literature (Fig. 6(j) and Table S12, ESI†). The charge–discharge curves and battery round-trip energy efficiencies at 1000 cycles, 3600 cycles, and 7200 cycles are presented in the inset of Fig. 6(i). When the ZAB was cycled for 1000 cycles, the discharge and charge segment voltages were 1.26 and 1.90 V with a voltage gap of 0.64 V, and the related round-trip energy efficiency is calculated as 66.5%. When it was cycled to the end (7200 cycles), the discharge and charge voltages were 1.23 V and 1.92 V with a voltage gap of 0.69 V, and the corresponding round-trip energy efficiency is 64%. The mean capacity decay rate is only ca. 0.0003% per cycle. However, the Pt/C + RuO2 based ZAB only cycled for less than 360 cycles (180 h) (Fig. S39, ESI†), and the charge–discharge voltage gap was more than 0.76 V after 180 h (initial: 66.0%; final: 58.2%; capacity decay rate of ca. 0.02% per cycle). All the ZAB performances strongly demonstrate that Fe1Co1–N–C is a very promising candidate as an ORR electrocatalyst in ZABs and highlight the great potential of our Fe1Co1–N–C DACs for future practical applications. | ||
| Fig. 6 ZAB performance. (a) Schematic illustration of a ZAB. (b) The OCV plots of the ZABs based on Fe1Co1–N–C and reference catalysts (Fe1–N–C, Co1–N–C, N–C, and Pt/C). (c) Discharge polarization plots and corresponding power density plots of the ZABs. (d) Specific capacities of the ZAB based on Fe1Co1–N–C at various current densities (10, 20, 50, and 100 mA cm−2). (e) and (f) Discharge curves at current densities from 2 to 5, 10, 20, 50, 100, 300, 500, and 600 mA cm−2 for the Fe1Co1–N–C based ZAB, and voltage values corresponding to each current density. (g) and (h) Optical images of a phone and an LED light powered by the Fe1Co1–N–C based ZAB. (i) Cyclic stability at a current density of 5 mA cm−2 for the Fe1Co1–N–C based ZAB. (j) Recently reported ZAB performances in terms of their corresponding maximum discharge current density and cycle time. | ||
Conclusion
In summary, using a pH-field microkinetic model, we have rapidly identified and rationally synthesized an efficient Fe1Co1–N–C ORR catalyst with desired Fe1Co1–N6 dual metal atomic sites and hierarchically porous structures. Benefiting from the synergistic effect of neighboring Fe and Co dual-active centers and unique porous structures, the Fe1Co1–N–C ORR DAC exhibits excellent performance in alkaline electrolyte and great practical application potential in ZABs. In situ DRIFTS and in situ Raman spectroscopy confirm the ORR pathway used in our pH-field microkinetic model. This work not only presents a highly efficient and rational strategy for the synthesis of high-performance ORR DACs with great practical potential, but also paves the way for designing and constructing advanced catalysts for various high-performance energy conversion applications.Author contributions
Tingting Li: catalyst synthesis, conducted the catalytic tests, catalyst characterization, the related data processing and writing. Di Zhang: DFT calculations, theoretical modelling, and writing. Yun Zhang: catalytic tests, catalyst characterization and the related data processing. Danli Yang: validated catalyst synthesis and ORR performance data. Runxin Li: TEM and HAADF-STEM tests. Fuyun Yu: catalytic tests, catalyst characterization and the related data processing. Kengqiang Zhong: catalytic tests, catalyst characterization and the related data processing. Xiaozhi Su: XAS tests. Tianwei Song: catalytic tests, catalyst characterization and the related data processing. Long Jiao: helped in catalyst characterization. Hai-Long Jiang: helped in catalyst characterization. Guo-Ping Sheng: helped in catalyst characterization. Jie Xu: TEM and HAADF-STEM tests. Hao Li: supervised the project, performed the DFT calculations, theoretical modelling, and writing. Zhen-Yu Wu: supervised the project and writing.Data availability
The data supporting this article have been included as part of the ESI.† The key results of the data, all the computational structures, and the pH-dependent microkinetic model are also available in our Digital Catalysis Platform (DigCat: https://www.digcat.org/).Conflicts of interest
There are no conflicts to declare.Acknowledgements
Zhen-Yu Wu acknowledges the support from the Excellent Young Scientists Fund (overseas) and the startup research funding of SUSTech. Hao Li acknowledges the funding support from JSPS KAKENHI (no. JP23K13703) and the Iwatani Naoji Foundation. Di Zhang acknowledges the support from JSPS KAKENHI (no. JP24K23068) and the National Natural Science Foundation of China (no. 22309109). Di Zhang gratefully acknowledges the support provided by the Shanghai Jiao Tong University Outstanding Doctoral Student Development Fund and Siyuan-1 cluster supported by the Center for High Performance Computing at Shanghai Jiao Tong University. Hao Li and Di Zhang acknowledge the Hirose Foundation and Center for Computational Materials Science, Institute for Materials Research, Tohoku University for the use of MASAMUNE-IMR (202312-SCKXX-0203, 202312-SCKXX-0207, 202412-SCKXX-0209) and the Institute for Solid State Physics (ISSP) at the University of Tokyo for the use of their supercomputers.References
- M. Armand and J.-M. Tarascon, Nature, 2008, 451, 652–657 CrossRef CAS PubMed.
- R. F. Service, Science, 2021, 372, 890–891 CrossRef CAS PubMed.
- H. T. Chung, D. A. Cullen, D. Higgins, B. T. Sneed, E. F. Holby, K. L. More and P. Zelenay, Science, 2017, 357, 479–484 CrossRef CAS PubMed.
- J.-N. Liu, C.-X. Zhao, J. Wang, D. Ren, B.-Q. Li and Q. Zhang, Energy Environ. Sci., 2022, 15, 4542 RSC.
- S. S. Shinde, J. Y. Jung, N. K. Wagh, C. H. Lee, D.-H. Kim, S.-H. Kim, S. U. Lee and J. H. Lee, Nat. Energy, 2021, 6, 592–604 CrossRef CAS.
- Q. Wang, S. Kaushik, X. Xiao and Q. Xu, Chem. Soc. Rev., 2023, 52, 6139–6190 RSC.
- G. Wu and P. Zelenay, Nat. Rev. Mater, 2024, 9, 643–656 CrossRef CAS.
- P. Zhang, K. Chen, J. Li, M. Wang, M. Li, Y. Liu and Y. Pan, Adv. Mater., 2023, 35, 2303243 CrossRef CAS PubMed.
- Y. Yu, J. Zhou and Z. Sun, Adv. Funct. Mater., 2020, 30, 2000570 CrossRef CAS.
- R. Zeng, Y. Yang, X. Feng, H. Li, L. M. Gibbs, F. J. Disalvo and H. D. Abruña, Sci. Adv., 2022, 8, eabj1584 CrossRef CAS PubMed.
- Y. Liang, Y. Li, H. Wang, J. Zhou, J. Wang, T. Regier and H. Dai, Nat. Mater., 2011, 10, 780–786 CrossRef CAS PubMed.
- B. Yan, D. Krishnamurthy, C. H. Hendon, S. Deshpande, Y. Surendranath and V. Viswanathan, Joule, 2017, 1, 600–612 CrossRef CAS.
- W. Wei, H. Liang, H. Parvez, X. Zhuang, X. Feng and K. Müllen, Angew. Chem., Int. Ed., 2014, 126, 1596–1600 CrossRef.
- X. Feng, G. Chen, Z. Cui, R. Qin, W. Jiao, Z. Huang, Z. Shang, C. Ma, X. Zheng, Y. Han and W. Huang, Angew. Chem., Int. Ed., 2024, 63, e202316314 CrossRef CAS PubMed.
- K. Gong, F. Du, Z. Xia, M. Durstock and L. Dai, Science, 2009, 323, 760–764 CrossRef CAS PubMed.
- P. Yin, T. Yao, Y. Wu, L. Zheng, Y. Lin, W. Liu, H. Ju, J. Zhu, X. Hong, Z. Deng, G. Zhou, S. Wei and Y. Li, Angew. Chem., Int. Ed., 2016, 55, 10800–10805 CrossRef CAS PubMed.
- M. Dan, X. Zhang, Y. Yang, J. Yang, F. Wu, S. Zhao and Z.-Q. Li, Proc. Natl. Acad. Sci. U. S. A., 2024, 121, e2318174121 CrossRef CAS PubMed.
- X. Liang, N. Fu, S. Yao, Z. Li and Y. Li, J. Am. Chem. Soc., 2022, 144, 18155–18174 CrossRef CAS PubMed.
- X.-F. Yang, A. Wang, B. Qiao, J. Li, J. Liu and T. Zhang, Acc. Chem. Res., 2013, 46, 1740–1748 CrossRef CAS PubMed.
- A. Wang, J. Li and T. Zhang, Nat. Rev. Chem., 2018, 2, 65–81 CrossRef CAS.
- Y. Zeng, C. Li, B. Li, J. Liang, M. J. Zachman, D. A. Cullen, R. P. Hermann, E. E. Alp, B. Lavina, S. Karakalos, M. Lucero, B. Zhang, M. Wang, Z. Feng, G. Wang, J. Xie, D. J. Myers, J.-P. Dodelet and G. Wu, Nat. Catal., 2023, 6, 1215–1227 CrossRef CAS.
- J. Yang, J. Yang, W. Liu, M. Xu, X. Liu, H. Qi, L. Zhang, X. Yang, S. Niu, D. Zhou, Y. Liu, Y. Su, J.-F. Li, Z.-Q. Tian, W. Zhou, A. Wang and T. Zhang, J. Am. Chem. Soc., 2021, 143, 14530–14539 CrossRef CAS PubMed.
- J. Li, M. Chen, D. A. Cullen, S. Hwang, M. Wang, B. Li, K. Liu, S. Karakalos, M. Lucero, H. Zhang, C. Lei, H. Xu, G. E. Sterbinsky, Z. Feng, D. Su, K. L. More, G. F. Wang, Z. Wang and G. Wu, Nat. Catal., 2018, 1, 935–945 CrossRef CAS.
- Z. Wang, X. Jin, C. Zhu, Y. Liu, H. Tan, R. Ku, Y. Zhang, L. Zhou, Z. Liu, S.-J. Hwang and H. J. Fan, Adv. Mater., 2021, 33, 2104718 CrossRef CAS PubMed.
- W. Xu, R. Zeng, M. Rebarchik, A. Posada-Borbón, H. Li, C. J. Pollock, M. Mavrikakis and H. D. Abruña, J. Am. Chem. Soc., 2024, 146, 2593–2603 CrossRef CAS PubMed.
- J. Wang, C.-X. Zhao, J.-N. Liu, Y.-W. Song, J.-Q. Huang and B.-Q. Li, Nano Energy, 2022, 104, 107927 CrossRef CAS.
- Y. Liu, S. Yuan, C. Sun, C. Wang, X. Liu, Z. Lv, R. Liu, Y. Meng, W. Yang, X. Feng and B. Wang, Adv. Energy Mater., 2023, 13, 2302719 CrossRef CAS.
- Z. Li, S. Ji, C. Wang, H. Liu, L. Leng, L. Du, J. Gao, M. Qiao, J. H. Horton and Y. Wang, Adv. Mater., 2023, 35, 2300905 Search PubMed.
- W. Wan, Y. Zhao, S. Wei, C. A. Triana, J. Li, A. Arcifa, C. S. Allen, R. Cao and G. R. Patzke, Nat. Commun., 2021, 12, 5589 Search PubMed.
- B. Tang, Y. Zhou, Q. Ji, Z. Zhuang, L. Zhang, C. Wang, H. Hu, H. Wang, B. Mei, F. Song, S. Yang, B. M. Weckhuysen, H. Tan, D. Wang and W. Yan, Nat. Synth., 2024, 3, 878–890 Search PubMed.
- L. Wu, Y. Chen, C. Shao, L. Wang and B. Li, Adv. Funct. Mater., 2024, 34, 2408257 Search PubMed.
- C. Hu, G. Xing, W. Han, Y. Hao, C. Zhang, Y. Zhang, C.-H. Kuo, H.-Y. Chen, F. Hu, L. Li and S. Peng, Adv. Mater., 2024, 36, 2405763 CrossRef CAS PubMed.
- B. Hu, A. Huang, X. Zhang, Z. Chen, R. Tu, W. Zhu, Z. Zhuang, C. Chen, Q. Peng and Y. Li, Nano Res., 2021, 14, 3482–3488 CrossRef CAS.
- X. Shu, D. Tan, Y. Wang, J. Ma and J. Zhang, Angew. Chem., Int. Ed., 2024, 63, e202316005 CrossRef CAS PubMed.
- H. Liu, F. Yu, K. Wu, G. Xu, C. Wu, H.-K. Liu and S.-X. Dou, Small, 2022, 18, 2106635 CrossRef CAS PubMed.
- W. Yang, Z. Jia, L. Chen, B. Zhou, D. Zhang, Y. Han, Z. Gao and H. Li, Chem. Commun., 2023, 59, 10761–10764 RSC.
- N. Karmodak and J. K. Nørskov, Angew. Chem., Int. Ed., 2023, 62, e202311113 CrossRef CAS PubMed.
- J. Liu, H. Xu, J. Zhu and D. Cheng, J. Am. Chem. Soc. Au, 2023, 3, 3031–3044 CAS.
- P. Guo, B. Liu, F. Tu, Y. Dai, Z. Zhang, Y. Xia, M. Ma, Y. Zhang, L. Zhao and Z. Wang, Energy Environ. Sci., 2024, 17, 3077–3087 RSC.
- D. Zhang, F. She, J. Chen, L. Wei and H. Li, J. Am. Chem. Soc., 2025, 147, 6076–6086 CrossRef CAS PubMed.
- J. K. Nørskov, J. Rossmeisl, A. Logadottir, L. Lindqvist, J. R. Kitchin, T. Bligaard and H. Jónsson, J. Phys. Chem. B, 2004, 108, 17886–17892 CrossRef PubMed.
- D. Zhang, Z. Wang, F. Liu, P. Yi, L. Peng, Y. Chen, L. Wei and H. Li, J. Am. Chem. Soc., 2024, 146, 3210–3219 CrossRef CAS PubMed.
- D. Zhang, F. She, J. Chen, L. Wei and H. Li, arXiv, 2024, preprint, arXiv:2402.05405 DOI:10.48550/arXiv.2402.05405.
- H.-W. Liang, W. Wei, Z.-S. Wu, X. Feng and K. Müllen, J. Am. Chem. Soc., 2013, 135, 16002–16005 CrossRef CAS PubMed.
- H.-W. Liang, X. Zhuang, S. Brüller, X. Feng and K. Müllen, Nat. Commun., 2014, 5, 4973 CrossRef CAS PubMed.
- Z.-Y. Wu, P. Zhu, D. A. Cullen, Y. Hu, Q.-Q. Yan, S. Shen, F.-Y. Chen, H. Yu, M. Shakouri, J. D. Arregui-Mena, A. Ziabari, A. Paterson, H.-W. Liang and H. Wang, Nat. Synth., 2022, 1, 658–667 CrossRef CAS.
- C.-F. Li, L.-J. Xie, J.-W. Zhao, L.-F. Gu, H.-B. Tang, L. Zheng and G.-R. Li, Angew. Chem., Int. Ed., 2022, 61, e202116934 CrossRef CAS PubMed.
- L. Wang, H. Su, Z. Zhang, J. Xin, H. Liu, X. Wang, C. Yang, X. Liang, S. Wang, H. Liu, Y. Yin, T. Zhang, Y. Tian, Y. Li, Q. Liu, X. Sun, J. Sun, D. Wang and Y. Li, Angew. Chem., Int. Ed., 2023, 62, e202314185 CrossRef CAS PubMed.
- Z.-Y. Wu, M. Karamad, X. Yong, Q. Huang, D. A. Cullen, P. Zhu, C. Xia, Q. Xiao, M. Shakouri, F.-Y. Chen, J. Y. Kim, Y. Xia, K. Heck, Y. Hu, M. S. Wong, Q. Li, I. Gates, S. Siahrostami and H. Wang, Nat. Commun., 2021, 12, 2870 CrossRef CAS PubMed.
- Y. Yang, B. Li, Y. Liang, W. Ni, X. Li, G. Shen, L. Xu, Z. Chenm, C. Zhu, J.-X. Liang and S. Zhang, Adv. Sci., 2024, 11, e2310231 CrossRef PubMed.
- P. Chen, T. Zhou, L. Xing, K. Xu, Y. Tong, H. Xie, L. Zhang, W. Yan, W. Chu, C. Wu and Y. Xie, Angew. Chem., Int. Ed., 2017, 129, 625–629 CrossRef.
- L. Jiao, G. Wan, R. Zhang, H. Zhou, S.-H. Yu and H.-L. Jiang, Angew. Chem., Int. Ed., 2018, 130, 8661–8665 CrossRef.
- M. Liu, J. Zhang, H. Su, Y. Jiang, W. Zhou, C. Yang, S. Bo, J. Pan and Q. Liu, Nat. Commun., 2024, 15, 1675 CrossRef CAS PubMed.
- X. Li, J. Qin, Q. Lin, X. Yi, C. Yan, J. Zhang, J. Dong, K. Yu, S. Zhang, C. Xie, H. Yang, W. Xiao, W. Li, J. Wang and X. Li, Adv. Sci., 2024, 11, e2401187 CrossRef PubMed.
- G. Yasin, S. Ali, S. Ibraheem, A. Kumar, M. Tabish, A. Mushtaq, S. Ajmal, M. Arif, M. A. Khan, A. Saad, L. Qiao and W. Zhao, ACS Catal., 2023, 13, 2314–2325 Search PubMed.
- Z. Wang, Z. Yi, L. W. Wong, X. Tang, H. Wang, H. Wang, C. Zhou, Y. He, W. Xiong, G. Wang, G. Zeng, J. Zhao and P. Xu, Adv. Mater., 2024, 36, 2404278 Search PubMed.
- J. Zhu, L. Xia, R. Yu, R. Lu, J. Li, R. He, Y. Wu, W. Zhang, X. Hong, W. Chen, Y. Zhao, L. Zhou, L. Mai and Z. Wang, J. Am. Chem. Soc., 2022, 144, 15529–15538 CrossRef CAS PubMed.
- Y. Li, Z. Li, K. Shi, L. Luo, H. Jiang, Y. He, Y. Zhao, J. He, L. Lin, Z. Sun and G. Su, Small, 2024, 20, 2309727 CrossRef CAS PubMed.
- J. Pei, H. Shang, J. Mao, Z. Chen, X. Zhang, D. Zhou, Y. Wang, F. Zhang, W. Zhu, T. Wang, W. Chen and Z. Zhuang, Nat. Commun., 2024, 15, 416 CrossRef CAS PubMed.
- D. Zhang and H. Li, ChemRxiv, 2024, preprint DOI:10.26434/chemrxiv-2024-9lpb9.
- Z. Sun, X. Lu, X. Wang, D. Wang, J. Luan, Y. Liu and W. Qi, J. Mater. Chem. A, 2024, 12, 4788–4795 RSC.
- Y. He, Y. Wei, Z. Wang, T. Xia, F. Rao, Z. Song and R. Yu, Adv. Funct. Mater., 2024, 34, 2314654 CrossRef CAS.
- Y. Dai, B. Liu, Z. Zhang, P. Guo, C. Liu, Y. Zhang, L. Zhao and Z. Wang, Adv. Mater., 2023, 35, 2210757 CrossRef CAS PubMed.
- S. Mondal, D. Bagchi, M. Riyaz, S. Sarkar, A. K. Singh, C. P. Vinod and S. C. Peter, J. Am. Chem. Soc., 2022, 144, 11859–11869 Search PubMed.
- J. Wei, D. Xia, Y. Wei, X. Zhu, J. Li and L. Gan, ACS Catal., 2022, 12, 7811–7820 CrossRef CAS.
- M. Jiang, C. Fu, R. Cheng, W. Zhang, T. Liu, R. Wang, J. Zhang and B. Sun, Adv. Sci., 2020, 7, 2000747 CrossRef CAS PubMed.
- H.-Q. Chen, H. Ze, M.-F. Yue, D.-Y. Wei, Y.-L. A, Y.-F. Wu, J.-C. Dong, Y.-J. Zhang, H. Zhang, Z.-Q. Tian and J.-F. Li, Angew. Chem., Int. Ed., 2022, 61, e202117834 CrossRef CAS PubMed.
- Z.-Y. Wu, F.-Y. Chen, B. Li, S.-W. Yu, Y. Z. Finfrock, D. M. Meira, Q.-Q. Yan, P. Zhu, M.-X. Chen, T.-W. Song, Z. Yin, H.-W. Liang, S. Zhang, G. Wang and H. Wang, Nat. Mater., 2022, 22, 100–108 CrossRef PubMed.
Footnotes |
| † Electronic supplementary information (ESI) available. See DOI: https://doi.org/10.1039/d5ee00215j |
| ‡ These authors contributed equally. |
| This journal is © The Royal Society of Chemistry 2025 |