
 Open Access Article
 This Open Access Article is licensed under a Creative Commons Attribution-Non Commercial 3.0 Unported Licence
Influence of ethylene thermal decomposition on carbon nanotube growth: insights from a two-zone reactor study†
Sangsoo Shin‡
a,
Huijeong Jeong‡b,
Jiwoo Kima,
Byeong Jin Kim a,
Jin Hong Leeac,
Sungyup Jung
*b and
Jaegeun Lee*acd
a,
Jin Hong Leeac,
Sungyup Jung
*b and
Jaegeun Lee*acd
aSchool of Chemical Engineering, Pusan National University, Busan 46241, Republic of Korea. E-mail: jglee@pusan.ac.kr
bDepartment of Environmental Engineering, Kyungpook National University, Daegu 41566, Republic of Korea. E-mail: sjung001@knu.ac.kr
cDepartment of Organic Material Science and Engineering, Pusan National University, Busan 46241, Republic of Korea
dInstitute of Advanced Organic Materials, Pusan National University, Busan 46241, Republic of Korea
First published on 18th July 2025
Abstract
Gas-phase decomposition of the carbon precursor is a critical yet not fully understood step in the catalytic chemical vapor deposition growth of carbon nanotubes (CNTs). Here, we present a systematic investigation of how the thermal decomposition of C2H4 influences CNT growth. Using a custom-designed two-zone reactor with independently controlled preheating (decomposition) and CNT growth zones, we decoupled the effects of gas-phase decomposition from the growth temperature. Standard synthesis conditions were first established using Bayesian optimization, with the CNT growth zone temperature (Tg) fixed at 700 °C. CNTs were then synthesized at preheating zone temperatures (Tp) of 500, 600, 700, 800, and 900 °C while maintaining Tg at 700 °C under standard conditions. Carbon yield and IG/ID remained stable at 500, 600, and 700 °C but showed significant changes at 800 and 900 °C. To elucidate these variations, we analyzed the gas-phase composition at various temperatures using micro-GC. Significant changes in the gas-phase composition were observed above 700 °C, correlating with changes in carbon yield and crystallinity. Based on these results, we propose a mechanism by which differences in gas-phase chemistry lead to changes in the carbon yield and the IG/ID ratio. This study provides valuable insight into the role of gas-phase decomposition in CNT growth and highlights the potential of tuning gas-phase chemistry for controlled growth of CNTs.
 Sungyup Jung | Dr Sungyup Jung joined the Department of Environmental Engineering at Kyungpook National University (KNU) in 2022 and is now an Associate Professor, working on the development of new materials and greener processes for waste management and valorization. He received his PhD degree from the City College of New York at CUNY, USA. Prior to joining KNU, he was a postdoctoral fellow at Simon Fraser University (2019), Canada, and a research professor at Hanyang University (2022), Korea. |
1. Introduction
Carbon nanotubes (CNTs) have received considerable attention across various applications due to their outstanding mechanical,1 electrical,2 and thermal properties,3 combined with low density. However, in the early stages of CNT development, their high cost and limited production capacity restricted their practical use. In recent years, significant progress has been made in the mass production of CNTs, particularly multi-walled CNTs (MWCNTs), via catalytic chemical vapor deposition (CCVD) in fluidized bed reactors,4–8 using impregnated catalysts such as Fe/Al2O3,9 Co/MgO,10 and Co–Mo/Al2O3.11 Furthermore, the CNT market has grown rapidly following the realization that CNTs can serve as more effective conductive additives than conventional conductive additives such as carbon black.12 This improvement is mainly attributed to their superior ability to form an electrical percolation network.The next major challenge in expanding the CNT market is achieving mass production of CNTs with high crystallinity. This focus is driven by the well-established correlation between CNT crystallinity and their key properties, as well as overall application performance. For instance, higher crystallinity enhances thermal stability,13 increases the Young's modulus of individual CNTs,14 improves the electrical conductivity of CNT fibers,15 bucky paper,16 and films,17 and elevates the tensile strength of CNT fibers.15,18 While CNT crystallinity is known to increase with growth temperature,19 this approach presents trade-offs. Increasing the growth temperature often leads to decreased yield, likely due to shortened catalyst lifetime and nucleation efficiency.20 In addition, higher growth temperature requires higher energy consumption. Therefore, developing alternative strategies to improve CNT crystallinity without raising the growth temperature is essential for scalable and energy-efficient production.
To enhance CNT crystallinity, extensive research has been conducted on how various synthesis parameters influence their crystalline structure. Lee et al.21 reported variations in CNT crystallinity depending on the type of metal species, while Kimura et al.22 demonstrated changes based on the type of carbon precursor. Abbaslou et al.23 investigated how the concentration of the carbon precursor affects crystallinity, and Moon et al.24 showed that using Ar as an additional carrier gas can further improve CNT crystallinity. In addition, Shen et al.25 introduced a defect-healing strategy via thermal treatment in the presence of air, which effectively improved the crystallinity of CNTs. Despite these efforts, no universally effective method—aside from increasing the growth temperature—has been established across general CNT synthesis systems. As a result, the scalable production of high-crystallinity CNTs still remains a significant challenge.
Here, we investigated how the thermal decomposition of C2H4, used as a carbon precursor, influences the crystallinity and carbon yield of CNTs grown on a Co/MgO catalyst prepared via wet impregnation. In a typical CVD reactor for CNT growth, it is difficult to have different temperatures for the gas-phase decomposition of the carbon precursor and the catalytic growth of CNTs.26–29 To decouple these temperatures, we employed a customized two-zone reactor consisting of a preheating zone and a CNT growth zone, allowing independent temperature control in each zone. Before assessing the impact of decomposition by varying the preheating zone temperature (Tp), we optimized the CNT growth conditions for carbon yield using Bayesian optimization (BO), maintaining the CNT growth temperature (Tg) at 700 °C to establish standard synthesis conditions. We then synthesized CNTs at Tp values of 500, 600, 700, 800, and 900 °C under these standard conditions and measured the carbon yield and IG/ID ratio. The carbon yield and IG/ID ratio remained consistent at Tp of 500, 600, and 700 °C, but varied at 800 and 900 °C. To elucidate these variations, we analyzed the composition and concentration of the gases formed by C2H4 decomposition in the preheating zone using micro-gas chromatography (micro-GC). Based on the gas analysis data, we propose a mechanism by which differences in gas chemistry lead to changes in the carbon yield and the IG/ID ratio.
2. Experimental
2.1. Catalyst preparation
The Co/MgO catalysts were prepared via the wet impregnation method. First, porous MgO powder (98%, average particle diameter ∼93 μm, measured by particle size analysis, Thermo Fisher Scientific) was stirred in an aqueous solution at room temperature for one hour. To achieve a 25 wt% cobalt loading, the necessary amount of cobalt nitrate hexahydrate (98.0%, Matsugaki Chemical Industries) was then added to the suspension, followed by stirring for one additional hour at room temperature. The resulting mixture was dried at 170 °C for 20 hours under continuous stirring. The dried sample was subsequently ground and calcined in air at 700 °C for two hours.2.2. CNT synthesis
CNT synthesis was carried out in a customized two-zone reactor consisting of a preheating zone and a CNT growth zone, allowing independent temperature control in each (Fig. 1a). We used a quartz tube with an inner diameter of 5.5 cm and a length of 1.3 m. For each run, we utilized 0.02 g of Co/MgO catalyst to synthesize CNTs. We used three types of gases: C2H4 as a carbon precursor, H2, and N2. The growth process was run by a programmed recipe using a computer to precisely control experimental conditions and eliminate human error (Fig. 1b and Fig. S1†). We synthesized CNTs at Tp of 500, 600, 700, 800, and 900 °C, maintaining Tg at 700 °C for 20 minutes. The ramping rate in both zones was approximately 15 °C min−1. The total flow rate, C2H4 concentration, and H2 concentration were determined as recommended by BO, and the N2 flow rate was decided by subtracting the C2H4 and H2 flow rates from the total flow rate. | ||
| Fig. 1 (a) Scheme of the customized two-zone reactor consisting of a preheating zone and a CNT growth zone, operating under a computer-controlled, programmed recipe for CNT growth. (b) An example of a decoupled growth recipe at a Tp of 900 °C and a Tg of 700 °C. | ||
After synthesis, we measured the carbon yield, which is defined as the mass of carbon produced during CNT synthesis per unit mass of catalyst, and measured the mass of the final product. The carbon yield can be expressed using the following equation:
2.3. Bayesian optimization
We used BoTorch as the library.30 We employed the Matern 5/2 kernel function for the Gaussian process and used Expected Improvement (EI) as the acquisition function. The BO process began by building an initial experimental database, which was then fed into the BO algorithm to generate a new set of input variables for further investigation. Next, the experiment was performed with the newly generated variables, and the resulting data were added to the database. This iterative cycle continued until the variables were optimized.2.4. Characterization
We characterized the as-synthesized CNT samples using several analytical techniques, including scanning electron microscopy (SEM), transmission electron microscopy (TEM), Raman spectroscopy, and thermogravimetric analysis (TGA). The SEM analysis was conducted using a SUPRA 25 microscope from Carl Zeiss AG in Oberkochen, Germany. For TEM analysis, we employed an FEI-Titan Cubed 60–300 microscope equipped with a Cs-corrector and monochromator, operating at 80 kV. To assess the ratio of the intensity of the D-band (ID) to the G-band (IG) in the Raman spectra, we utilized an NS240-F Raman spectrometer from Nanoscope Systems in Daejeon, Republic of Korea. The laser excitation wavelength was set to 532 nm. Finally, we investigated the purity of the CNT samples using TGA with a Discovery TGA 55 instrument from TA Instruments in New Castle, DE, USA, which was conducted in air from 30 °C to 950 °C with a heating rate of 5 °C min−1.3. Results and discussion
3.1. Maximizing carbon yield using Bayesian optimization
Before assessing the impact of decomposition of C2H4 by varying Tp, it was necessary to first establish standard CNT growth conditions. For this, we optimized the CNT growth conditions to maximize carbon yield using BO. We selected three input variables in the CNT synthesis process: total flow rate, percentage of C2H4 in the total flow rate, and percentage of H2 in the total flow rate. We designated the ranges for these variables: 500–1000 sccm, 10.0–30.0%, and 6.0–30.0%. These ranges were experimentally determined based on the physical limitations of the system. The flow rate of N2 was decided by subtracting the flow rates of C2H4 and H2 from the total flow rate. We fixed the temperature of the CNT growth zone at 700 °C.To initiate BO, we constructed an initial database using the Sobol sequence, a quasi-random number generator that generates evenly distributed points within the input variable space, thereby reducing the clustering often seen with purely random sampling.31 Having an evenly distributed initial set of points helps build a robust surrogate model, guides the acquisition function more effectively, and ultimately leads to a more efficient and successful optimization process. Therefore, we generated 10 points within the input space using the Sobol sequence (Fig. 2a) and conducted two repeated experiments at each point. The maximum carbon yield observed in the initial database was 137.0% (Table 1).
 | ||
| Fig. 2 (a) Three-dimensional plot illustrating the points generated by the Sobol sequence for the initial database (gray) and (b) the points recommended by BO (red) within the input variable space. (c) The predicted and measured carbon yields for each iteration, along with the initial database. | ||
| Number | Total flow rate [sccm] | C2H4 flow rate [sccm] | H2 flow rate [sccm] | N2 flow rate [sccm] | Carbon yield [%] |
|---|---|---|---|---|---|
| 1 | 910 | 220 | 153 | 537 | 115.5 ± 0.7 |
| 2 | 597 | 95 | 143 | 359 | 116.8 ± 15.9 |
| 3 | 734 | 208 | 87 | 439 | 135.8 ± 12.2 |
| 4 | 797 | 92 | 153 | 552 | 111.4 ± 10.2 |
| 5 | 850 | 221 | 247 | 382 | 122.3 ± 25.4 |
| 6 | 661 | 92 | 83 | 486 | 110.0 ± 32.1 |
| 7 | 540 | 116 | 127 | 297 | 118.5 ± 9.8 |
| 8 | 978 | 182 | 67 | 729 | 137.0 ± 6.0 |
| 9 | 950 | 273 | 205 | 472 | 136.7 ± 21.0 |
| 10 | 514 | 57 | 41 | 416 | 130.0 ± 5.2 |
After building the initial database, we performed 20 iterations with two repeated experiments per iteration (Fig. 2c and Table 2). Through BO, we successfully optimized the CNT growth conditions to increase the carbon yield, ultimately establishing the standard conditions. We achieved a maximum carbon yield of 150.9% at the 12th iteration and noted a general upward trend in carbon yield as the iterations progressed. During the optimization, we observed the acquisition function's struggle in balancing exploration (sampling points with high uncertainty) and exploitation (sampling points with high predicted values) to find the global optimum. In the 11th iteration, the measured value significantly exceeded the model's prediction. This unexpected result led the acquisition function to recommend sampling points near the input variable region where the measured value had sharply risen. This behavior exemplified the function's exploitation strategy.
| Iteration number | Total flow rate [sccm] | C2H4 flow rate [sccm] | H2 flow rate [sccm] | N2 flow rate [sccm] | Predicted value [%] | Carbon yield [%] |
|---|---|---|---|---|---|---|
| 1 | 867 | 195 | 52 | 620 | 132.6 ± 8.2 | 123.0 ± 15.3 |
| 2 | 1000 | 138 | 60 | 802 | 132.6 ± 7.1 | 128.0 ± 1.3 |
| 3 | 1000 | 233 | 62 | 705 | 132.1 ± 6.3 | 138.5 ± 20.5 |
| 4 | 1000 | 245 | 64 | 691 | 132.6 ± 6.2 | 130.7 ± 8.9 |
| 5 | 717 | 177 | 55 | 485 | 129.1 ± 7.2 | 136.6 ± 15.4 |
| 6 | 778 | 161 | 58 | 559 | 131.8 ± 6.0 | 127.4 ± 6.5 |
| 7 | 627 | 188 | 53 | 386 | 128.8 ± 6.8 | 121.1 ± 20.6 |
| 8 | 858 | 258 | 64 | 536 | 128.5 ± 6.2 | 110.1 ± 4.9 |
| 9 | 1000 | 203 | 60 | 737 | 134.2 ± 4.4 | 139.6 ± 2.8 |
| 10 | 955 | 193 | 57 | 705 | 136.9 ± 3.8 | 135.6 ± 7.7 |
| 11 | 1000 | 202 | 81 | 717 | 136.3 ± 4.0 | 143.4 ± 5.6 |
| 12 | 1000 | 196 | 103 | 701 | 137.4 ± 4.7 | 150.9 ± 1.5 |
| 13 | 1000 | 185 | 118 | 697 | 148.9 ± 4.3 | 148.8 ± 3.0 |
| 14 | 1000 | 204 | 116 | 680 | 149.5 ± 3.1 | 137.9 ± 11.4 |
| 15 | 1000 | 183 | 103 | 714 | 149.9 ± 2.4 | 130.4 ± 7.3 |
| 16 | 1000 | 193 | 130 | 677 | 151.4 ± 3.9 | 144.6 ± 1.5 |
| 17 | 956 | 187 | 102 | 667 | 147.9 ± 3.5 | 123.0 ± 19.5 |
| 18 | 1000 | 205 | 103 | 692 | 149.1 ± 2.3 | 132.5 ± 12.9 |
| 19 | 1000 | 193 | 104 | 703 | 150.4 ± 1.6 | 133.3 ± 10.5 |
| 20 | 954 | 184 | 102 | 668 | 146.5 ± 3.6 | 139.2 ± 2.4 |
3.2. Influence of carbon precursor decomposition on CNT growth
To identify the influence of carbon precursor decomposition on CNT growth, we synthesized CNTs at different Tp of 500, 600, 700, 800, and 900 °C under the standard synthesis conditions and measured the carbon yield and IG/ID ratio (Fig. 3, Table S1, and Fig. S2†). The IG/ID ratio represents the intensity ratio of the G peak (around 1580 cm−1) to the D peak (around 1350 cm−1) in the Raman spectra. Specifically, the G peak indicates the ordered sp2 networks of carbon atoms in CNTs, whereas the D peak arises from structural defects and disorder. Consequently, a higher IG/ID ratio signifies a greater proportion of graphitic (ordered) structures relative to non-graphitic (disordered or defective) structures in the CNTs. To obtain reliable data for carbon yield and IG/ID ratio, we performed five repeated CNT syntheses at each Tp. For each CNT sample synthesized in a single run, we collected samples at three different locations and measured the Raman spectrum at five different spots per sample. Consequently, we synthesized a total of 25 CNT samples and obtained 15 Raman spectra per sample, yielding a total of 375 Raman spectra.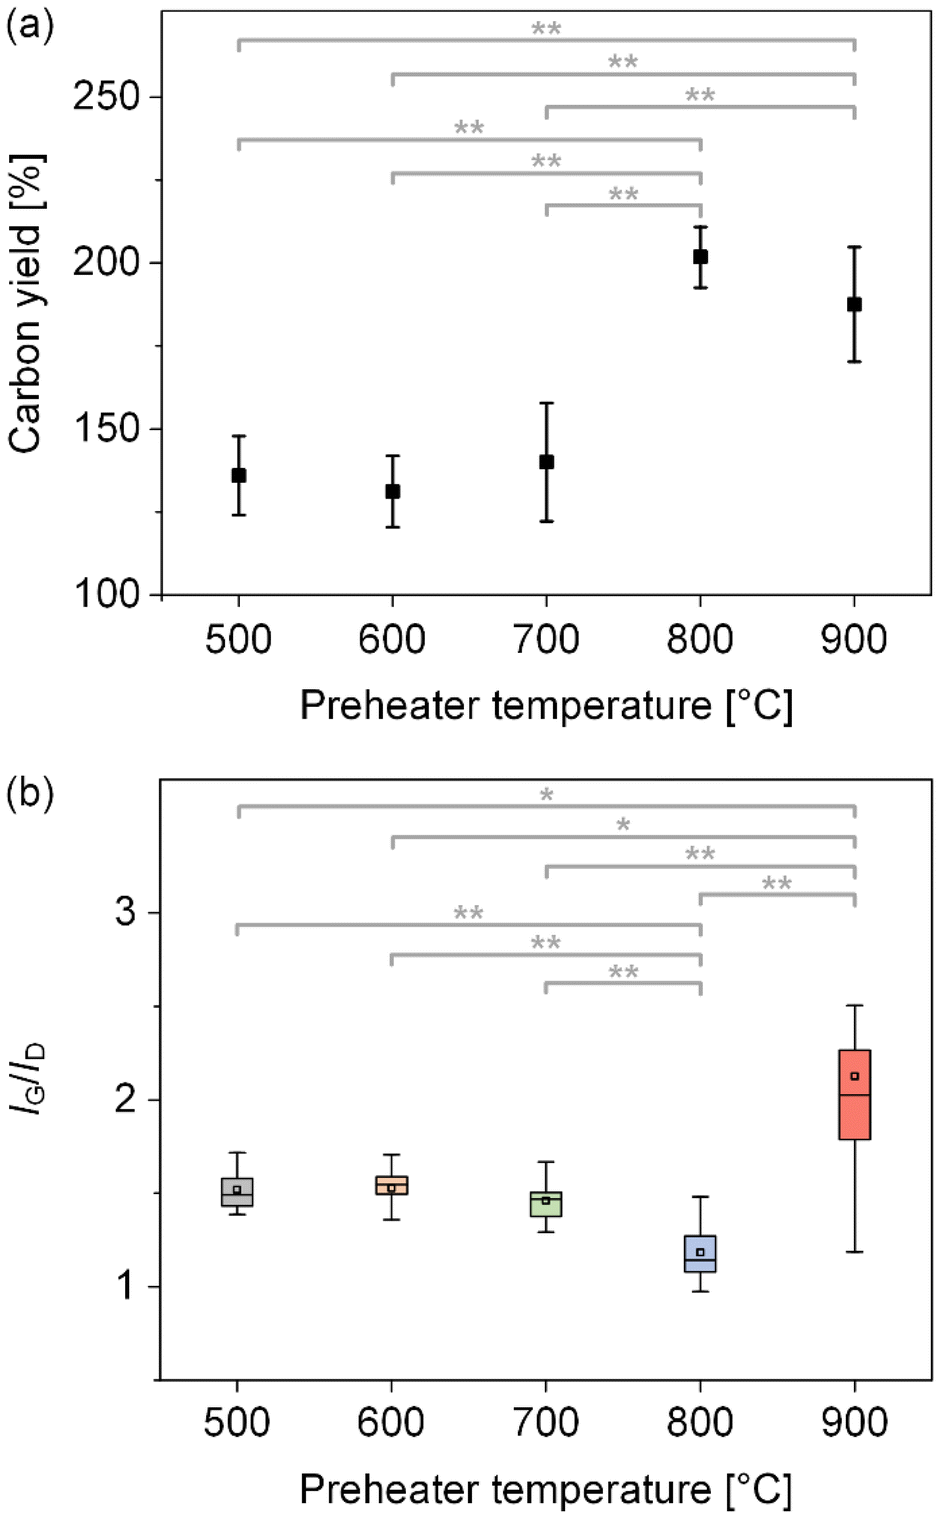 | ||
| Fig. 3 (a) Carbon yield and (b) IG/ID ratio as a function of Tp. * p-value < 0.05, ** p-value < 0.01. | ||
We investigated how the carbon yield and IG/ID ratio varied with Tp using Student's t-test. Student's t-test is a statistical method commonly employed to determine whether the difference between the means of two groups is statistically significant. This process begins by formulating a null hypothesis (assuming no difference between group means) and an alternative hypothesis (assuming a significant difference). A t-statistic is calculated based on the means, standard deviations, and sample sizes of the two groups. Using this t-statistic and the corresponding degrees of freedom, a p-value is obtained from the t-distribution. If the p-value is below a predefined significance level (usually 0.05), the null hypothesis is rejected, indicating a statistically significant difference between the groups; otherwise, the null hypothesis is retained, suggesting no significant difference. In this study, we performed a two-sided t-test with a significance level of 0.05.
We first compared the mean carbon yield and found significant differences between the following Tp pairs: 500 and 800 °C, 500 and 900 °C, 600 and 800 °C, 600 and 900 °C, 700 and 800 °C, and 700 and 900 °C, with each p-value less than 0.01 (Fig. 3a). That is, the carbon yield remained consistent at 500, 600, and 700 °C, then increased at 800 °C, and showed no significant difference between 800 and 900 °C. Consistent with this trend, TGA of samples synthesized at 700, 800, and 900 °C (Fig. S3†) reveals a final weight of about 45.0 wt% at 700 °C, and approximately 32 wt% at both 800 °C and 900 °C—further implying that the carbon yields at 800 °C and 900 °C are comparable and higher than at 700 °C. Additionally, we observed that the residual mass after TGA correlated closely with the carbon yield. Next, we compared the mean IG/ID ratio and found significant differences between the following Tp pairs: 500 and 800 °C, 500 and 900 °C, 600 and 800 °C, 600 and 900 °C, 700 and 800 °C, 700 and 900 °C, and 800 and 900 °C. This indicates that the IG/ID ratio remained consistent at 500, 600, and 700 °C, decreased at 800 °C, and rose sharply at 900 °C.
Generally, it is known that the IG/ID ratio increases with higher Tg. An interesting point in our synthesis results is that the IG/ID ratio varied with Tp, despite maintaining Tg at 700 °C. Although there are a few studies on the synthesis of CNTs using a preheater, this behavior has not been reported in previous studies. Meshot et al. used a cold-walled CNT forest synthesis system and observed that the IG/ID ratio decreased linearly with increasing Tp (900–1120 °C) when the growth substrate was held at 825 °C.32 In contrast, Nessim et al. observed a more crystalline structure in MWCNTs (as seen in TEM images) with increasing Tp (730–770 °C) under a hot-walled synthesis system, with Tg set at 475 °C; however, they did not provide the IG/ID ratio.33 Similarly, Sugime et al. presented Raman spectra of CNT forests synthesized at Tp of 800, 900, and 1000 °C, maintaining the temperature of the growth substrate at 800 °C. Although the IG/ID ratio was not explicitly reported, no significant differences were observed in the intensities of the G and D peaks.34
To understand why the IG/ID ratio varied with Tp, we analyzed the composition and concentration of gases passing through the preheater at 25, 500, 600, 700, 800, and 900 °C using a micro-GC (Fig. 4a and Table S2†). Micro-GC, which is a gas chromatography equipped with packed columns and a thermal conductivity detector, enables real-time quantitative analysis of gas components. The detectable gas species included C2H4, H2, CH4, C2H6, C2H2, N2, CO, and CO2; however, CO and CO2 were not observed under our synthesis processes. The temperature of the gaseous products may drop from the heater to the micro-GC instrument. The volume of each gas could change depending on the temperature, but all the gaseous compounds were passed through the same temperature gradient. Therefore, the relative distribution of gaseous compounds from the heater to the micro-GC instrument should not be changed. The GC analysis of gaseous compounds produced in the high-temperature reactors is a widely accepted method. As Tp increased, we observed tar compounds formed by the decomposition of carbon precursors on the quartz tube wall, which can block the reactor outlet or reduce the analytical sensitivity of the micro-GC if introduced into the system. To prevent tar from entering the micro-GC and ensure accurate gas analysis, we installed a cold trap and a filter upstream of the GC inlet to capture condensable tar components and particulates (Fig. S4†).
 | ||
| Fig. 4 (a) Gas evolution profiles resulting from feedstock gas decomposition at various Tp values, and (b–g) gas evolution profiles over time at Tp = 25, 500, 600, 700, 800, and 900 °C. | ||
The decomposition of carbon precursors rarely occurred at Tp of 25, 500, and 600 °C, and slightly appeared at 700 °C. At 800 and 900 °C, active decomposition was observed, along with the formation of CH4, C2H6, and C2H2, and an increasing concentration of H2. Notably, a significant amount of CH4 was generated, and the concentration of H2 leapt at 900 °C. Because the ethylene decomposition is an endothermic reaction, higher temperatures promote the ethylene decomposition reaction further, with more formation of decomposed products. It is also known that ethylene decomposition and the simultaneous formation of other compounds start from slightly higher than 700 °C without a catalyst.35 Additionally, we monitored the composition and concentration of these gases over time at each Tp (Fig. 4b–g) and found that they remained nearly constant. Therefore, we concluded reasonably that the decomposition of the carbon precursor occurred under steady-state conditions.
One notable result was that the concentration of H2 increased with Tp. Since reducing the catalyst from its oxide form to a crystalline metallic state is a critical step in CNT synthesis—and the metallic state is considered the active site for CNT growth36—we hypothesized that the intensity of Co peaks in the XRD patterns would increase with Tp, potentially reaching a maximum at 900 °C. To investigate the effect of H2 concentration on catalyst reduction, we performed XRD on the catalyst particles in each CNT sample synthesized at Tp of 700, 800, and 900 °C (Fig. 5a). The XRD patterns revealed the same set of characteristic peaks for Co (00-015-0806), CoO (01-075-0418), MgO (01-074-1225), and CNT (01-075-1621), with metallic cobalt reflections typically appearing at 44.2°, 51.5°, and 75.9°; CoO peaks around 36.5°, 42.4°, 61.5°, and 73°; MgO peaks near 42.9°, 62.3°, and 74.7°; and a broad peak from CNTs around 26°. Surprisingly, however, there was no significant difference in the relative intensity of these Co peaks among the three samples, indicating that—even at elevated Tp—the degree of Co reduction in the catalyst was broadly similar under all conditions.
 | ||
| Fig. 5 (a) XRD patterns, and (b) Co 2p1/2 and Co 2p3/2 XPS spectra of the catalyst particles from each CNT sample synthesized at Tp of 700, 800, and 900 °C. | ||
To explore potential subtle differences in Co peak intensity in the XRD spectra, we conducted XPS analysis of the Co 2p1/2 and Co 2p3/2 regions on the catalyst particles from each CNT sample synthesized at Tp = 700, 800, and 900 °C (Fig. 5b). XPS peak deconvolution revealed both metallic Co (Co0) and Co2+, indicating almost no difference in their relative proportions among the three samples. Specifically, the CNTs synthesized at 700 °C contained 44.5% Co0 and 55.5% Co2+, those at 800 °C contained 44.4% Co0 and 55.6% Co2+, and those at 900 °C contained 44.2% Co0 and 55.8% Co2+. Based on the combined XRD and XPS data, we rejected our initial hypothesis and reasonably concluded that the catalyst contributed equally to CNT growth at Tp = 700, 800, and 900 °C.
3.3. Model explaining CNT synthesis dependence on Tp
To explain the observed variations in the IG/ID ratio and carbon yield as Tp increases, except for the catalyst's influence, we needed to consider the gas-phase chemistry of the carbon and hydrogen radicals generated by the decomposition of the carbon precursor. Although many researchers emphasize non-dissociative hydrocarbon molecules as the primary precursor for CNT growth, carbon and hydrogen radicals are rarely included in conventional growth models. Here, we propose a model that incorporates these radicals. As discussed earlier, we postulated that the decomposition of the carbon precursor occurs under steady-state conditions and the catalysts contribute equally to CNT growth at Tp = 700, 800, and 900 °C.Our gas analysis (Fig. 4) revealed that the extent of carbon precursor decomposition depends strongly on Tp, with notable consequences for CNT growth. Typically, CNT formation follows a vapor–liquid–solid mechanism, where vapor-phase carbon precursors dissolve into liquid-phase metallic catalyst nanoparticles and then precipitate as solid CNTs.37 As a result, the rate at which carbon precursors feed the catalyst must be carefully balanced with the precipitation rate. If this feed rate is too low, the carbon yield remains limited; if it is too high, it can encapsulate the catalyst particles in carbon. Thus, an optimal feed rate of carbon precursors is critical for efficient CNT growth.
At 700 °C, only about 12% of the injected C2H4 decomposed, generating a low concentration of carbon radicals and limiting the overall carbon yield (Fig. 6a). Because the feed rate is insufficient relative to the catalyst's precipitation rate, the overall CNT growth remains restricted. At 800 °C, however, around 50% of C2H4 decomposed, significantly increasing both carbon and hydrogen radical concentrations and boosting the carbon yield (Fig. 6b). This improvement can be attributed to an increased precipitation rate enabled by the sufficient supply of carbon radicals to the catalyst. The excess carbon radicals, however, accumulate on CNT surfaces to form amorphous carbon, as a relatively lower IG/ID ratio is shown at preheating of 800 °C compared to those at 700 and 900 °C (Fig. 3b). Meanwhile, most hydrogen radicals are consumed in forming other hydrocarbons—as evidenced by only a slight (about 2%) rise in H2 concentration—thus leaving fewer hydrogen radicals to etch away the amorphous carbon at 800 °C. In contrast, at 900 °C, about 90% of the injected C2H4 decomposes, producing abundant carbon and hydrogen radicals and nearly doubling the hydrogen concentration relative to the initial feed (Fig. 6c). Similar to the conditions at 800 °C, the carbon yield improved substantially due to the enhanced precipitation rate from the abundant supply of carbon radicals. This surplus of hydrogen radicals effectively etches amorphous carbon from CNT surfaces, resulting in cleaner, higher-quality CNTs. As a result, the increased CNT crystallinity (higher IG/ID) was shown at 900 °C compared to the crystallinity of CNTs produced at 800 °C (Fig. 3b).
 | ||
| Fig. 6 Schematic illustration of the proposed CNT growth model at different Tp: (a) 700, (b) 800, and (c) 900 °C. Carbon and hydrogen radicals form in the preheating zone and migrate to the growth zone (Tg = 700 °C), where they interact with catalyst nanoparticles. As Tp increases, higher concentrations of radicals influence both the carbon yield and the IG/ID ratio, leading to the varying growth outcomes depicted. | ||
To test the validity of the proposed CNT growth model, we used TEM to analyze the amorphous carbon deposited on CNT surfaces synthesized at Tp of 700, 800, and 900 °C, comparing their relative amounts (Fig. 7). At 700 °C, a moderate amount of amorphous carbon was observed. At 800 °C, a significant increase in amorphous carbon was detected, resulting from the higher concentration of carbon radicals. In contrast, at 900 °C, the CNT surfaces appeared visibly clean, attributed to the strong etching effect of hydrogen radicals. These findings align well with our proposed model. We further confirmed that the D peak intensity correlates with the amount of surface-deposited amorphous carbon, supporting the corresponding changes in the IG/ID ratio.
 | ||
| Fig. 7 TEM images of the synthesized CNTs at Tp of (a) 700, (b) 800, and (c) 900 °C (scale bars: 10 nm). | ||
4. Conclusions
We investigated how the thermal decomposition of C2H4 influences crystallinity and carbon yield. Prior to evaluating the influence of thermal decomposition by adjusting Tp, we optimized the CNT growth conditions for maximizing carbon yield using BO, fixing the growth zone at 700 °C to define our standard synthesis conditions. Under these standard conditions, we then synthesized CNTs at Tp of 500, 600, 700, 800, and 900 °C, measuring both the carbon yield and the IG/ID ratio in each case. While these metrics remained stable at 500, 600, and 700 °C, notable variations emerged at 800 and 900 °C. To elucidate these differences, we conducted micro-GC analysis on the gases produced by the decomposition of C2H4 in the preheating zone. Based on the gas analysis data, we proposed a mechanism illustrating how changes in gas-phase chemistry can influence both the carbon yield and the IG/ID ratio. This study highlights the practical importance of Tp in controlling CNT synthesis and provides valuable insight into the gas-phase dynamics underlying CNT growth.Conflicts of interest
There is no conflict of interest to declare in this study.Data availability
The authors confirm that the data supporting the findings of this study are available within the article and its ESI.† The raw datasets generated supporting the current study are available from the corresponding author on reasonable request.Acknowledgements
This work was supported by the Development Project for High-Performance Carbon Nanotube Composite Fiber Manufacturing Technology (RS-2023-00258521), Ministry of Trade, Industry & Energy (MOTIE) of the Republic of Korea. This work was also supported by a National Research Foundation of Korea (NRF) grant funded by the Korean government (MSIT) (No. RS-2024-00344059). The authors thank the Core Research Facilities of Pusan National University of Korea for their technical assistance.References
- Y. Bai, R. Zhang, X. Ye, Z. Zhu, H. Xie, B. Shen, D. Cai, B. Liu, C. Zhang, Z. Jia, S. Zhang, X. Li and F. Wei, Nat. Nanotechnol., 2018, 13, 589–595 CrossRef CAS PubMed.
- T. W. Ebbesen, H. J. Lezec, H. Hiura, J. W. Bennett, H. F. Ghaemi and T. Thio, Nature, 1996, 382, 54–56 CrossRef CAS.
- S. Berber, Y. K. Kwon and D. Tománek, Phys. Rev. Lett., 2000, 84, 4613–4616 CrossRef CAS PubMed.
- F. Wei, Q. Zhang, W. Z. Qian, H. Yu, Y. Wang, G. H. Luo, G. H. Xu and D. Z. Wang, Powder Technol., 2008, 183, 10–20 CrossRef CAS.
- Q. Zhang, M. Q. Zhao, J. Q. Huang, J. Q. Nie and F. Wei, Carbon, 2010, 48, 1196–1209 CrossRef CAS.
- M. Corrias, B. Caussat, A. Ayral, J. Durand, Y. Kihn, P. Kalck and P. Serp, Chem. Eng. Sci., 2003, 58, 4475–4482 CrossRef CAS.
- M. Li, S. Hachiya, Z. Chen, T. Osawa, H. Sugime and S. Noda, Carbon, 2021, 182, 23–31 CrossRef CAS.
- W. Bai, D. Chu and Y. He, Chem. Eng. J., 2021, 407, 126792 CrossRef CAS.
- H. Song, D. H. Kim, C. W. Park, J. Jae, S. Hong and J. Lee, Carbon Lett., 2023, 33, 921–929 CAS.
- D. H. Kim, E. Oh, S. Kim and J. Lee, Carbon Lett., 2025, 35, 199–209 CrossRef CAS.
- S. Shin, H. Song, Y. S. Shin, J. Lee and T. H. Seo, Nanomaterials, 2024, 14, 75 CrossRef CAS PubMed.
- B. J. Landi, M. J. Ganter, C. D. Cress, R. A. DiLeo and R. P. Raffaelle, Energy Environ. Sci., 2009, 2, 638–654 RSC.
- T. Tsuji, G. Chen, M. Yamada, J. He, Y. Shimizu, H. Sakakita, K. Hata, D. N. Futaba and S. Sakurai, Mater. Today Chem., 2025, 44, 102576 CrossRef CAS.
- K. Enomoto, S. Kitakata, T. Yasuhara, N. Ohtake, T. Kuzumaki and Y. Mitsuda, Appl. Phys. Lett., 2006, 88, 153115 CrossRef.
- D. E. Tsentalovich, R. J. Headrick, F. Mirri, J. Hao, N. Behabtu, C. C. Young and M. Pasquali, ACS Appl. Mater. Interfaces, 2017, 9, 36189–36198 CrossRef CAS PubMed.
- N. Matsumoto, A. Oshima, G. Chen, M. Yudasaka, M. Yumura, K. Hata and D. N. Futaba, Carbon, 2015, 87, 239–245 CrossRef CAS.
- P. E. Lyons, S. De, F. Blighe, V. Nicolosi, L. F. C. Pereira, M. S. Ferreira and J. N. Coleman, J. Appl. Phys., 2008, 104, 044302 CrossRef.
- J. Lee, D. M. Lee, Y. Jung, J. Park, H. S. Lee, Y. K. Kim, C. R. Park, H. S. Jeong and S. M. Kim, Nat. Commun., 2019, 10, 1–10 CrossRef PubMed.
- C. J. Lee, J. Park, Y. Huh and J. Yong Lee, Chem. Phys. Lett., 2001, 343, 33–38 CrossRef.
- W. Z. Li, J. G. Wen and Z. F. Ren, Appl. Phys. A: Mater. Sci. Process., 2002, 74, 397–402 CrossRef CAS.
- C. J. Lee, J. Park and J. A. Yu, Chem. Phys. Lett., 2002, 360, 250–255 CrossRef CAS.
- H. Kimura, J. Goto, S. Yasuda, S. Sakurai, M. Yumura, D. N. Futaba and K. Hata, Sci. Rep., 2013, 3, 1–6 Search PubMed.
- R. M. Malek Abbaslou, J. Soltan and A. K. Dalai, Appl. Catal., A, 2010, 372, 147–152 CrossRef CAS.
- S. Y. Moon, B. R. Kim, C. W. Park, S. H. Lee and S. M. Kim, Chem. Eng. J. Adv., 2022, 10, 100261 CrossRef CAS.
- M. Shen, T. Inoue, M. Wang, Y. Liu and Y. Kobayashi, ACS Appl. Mater. Interfaces, 2025, 17, 20105–20115 CrossRef CAS PubMed.
- J. Lee, M. Abdulhafez and M. Bedewy, J. Phys. Chem. C, 2019, 123, 28726–28738 CrossRef CAS.
- J. Lee, M. Abdulhafez and M. Bedewy, Ind. Eng. Chem. Res., 2019, 58, 11999–12009 CrossRef CAS.
- J. Lee, M. Abdulhafez and M. Bedewy, J. Manuf. Sci. Eng., 2019, 141, 1–8 Search PubMed.
- J. Lee, G. N. Tomaraei, M. Abdulhafez and M. Bedewy, Chem. Mater., 2021, 33, 6277–6289 CrossRef CAS.
- M. Balandat, B. Karrer, D. R. Jiang, S. Daulton, B. Letham, A. G. Wilson and E. Bakshy, Adv. Neural Inf. Process. Syst., 2020, 33, 21524–21538 Search PubMed.
- S. Burhenne, D. Jacob and G. P. Henze, Proc. Build. Simul. 2011 12th Conf. Int. Build. Perform. Simul. Assoc., 2011, pp. 1816–1823.
- E. R. Meshot, D. L. Plata, S. Tawfick, Y. Zhang, E. A. Verploegen and A. J. Hart, ACS Nano, 2009, 3, 2477–2486 CrossRef CAS PubMed.
- G. D. Nessim, M. Seita, D. L. Plata, K. P. Obrien, A. John Hart, E. R. Meshot, C. M. Reddy, P. M. Gschwend and C. V. Thompson, Carbon, 2011, 49, 804–810 CrossRef CAS.
- H. Sugime and S. Noda, Carbon, 2012, 50, 2953–2960 CrossRef CAS.
- F. E. Frey and D. F. Smith, Ind. Eng. Chem., 1928, 20, 948–951 CrossRef CAS.
- S. Hofmann, R. Blume, C. T. Wirth, M. Cantoro, R. Sharma, C. Ducati, M. Hävecker, S. Zafeiratos, P. Schnoerch, A. Oestereich, D. Teschner, M. Albrecht, A. Knop-Gericke, R. Schlögl and J. Robertson, J. Phys. Chem. C, 2009, 113, 1648–1656 CrossRef CAS.
- S. B. Sinnott, R. Andrews, D. Qian, A. M. Rao, Z. Mao, E. C. Dickey and F. Derbyshire, Chem. Phys. Lett., 1999, 315, 25–30 CrossRef CAS.
Footnotes |
| † Electronic supplementary information (ESI) available. See DOI: https://doi.org/10.1039/d5nr02143j |
| ‡ These authors contributed equally to this work. |
| This journal is © The Royal Society of Chemistry 2025 |