
 Open Access Article
 This Open Access Article is licensed under a
 Creative Commons Attribution 3.0 Unported Licence
Molecular mobility of thin films and the adsorbed layer of poly(2-vinylpyridine)
Marcel Gaweka,
Paulina Szymoniaka,
Deniz Hülagüa,
Andreas Hertwiga and
Andreas Schönhals *ab
*ab
aBundesanstalt fuer Materialforschung und -prüfung (BAM), Unter den Eichen 87, 12205 Berlin, Germany. E-mail: Andreas.Schoenhals@bam.de; Fax: +49 30/8104-73384; Tel: +49 30/8104-3384
bInstitut für Chemie, Technische Universität Berlin, Straße des 17. Juni 135, 10623 Berlin, Germany
First published on 11th July 2025
Abstract
The molecular dynamics of thin films and the adsorbed layer of poly(2-vinylpyridine) (P2VP) were investigated using broadband dielectric spectroscopy (BDS) and spectroscopic ellipsometry. Thin films of P2VP were prepared on silicon substrates and characterized to understand the influence of film thickness on the thermal glass transition temperature (Tg) and molecular mobility. The ellipsometric study revealed a decrease in Tg with decreasing film thickness, attributed to the enhanced mobility at the polymer/air interface. The adsorbed layer, prepared via the solvent leaching approach, exhibited a higher Tg compared to the bulk, indicating reduced molecular mobility due to strong polymer substrate interactions. The dielectric measurements were carried out in two different electrode configurations, crossed electrode capacitors (CEC) and nanostructured electrodes (NSE), where the latter allows for a free surface layer at the polymer/air interface. The relaxation rates of the α-relaxation measured in the CEC geometry collapse into one chart independent from the film thickness. For the thin films measured in the NSE arrangement the relaxation rates slow down with decreasing film thickness which was discussed as related to a stronger interaction of the P2VP segments with the native SiO2 at the surface of the silicon substrate compared to aluminum. It is worth noting that the effect of the enhanced mobility at the polymer/air interface is not observed in the dielectric measurements. BDS measurements in NSE geometry identified an additional relaxation process (α*-relaxation) in thin films, which was more pronounced in the adsorbed layer. This process is hypothesized to be related to molecular fluctuations within the adsorbed layer including the adsorption/desorption dynamics of segments or to a slow Arrhenius process (SAP) related to the equilibration dynamics deep in the glassy state.
Introduction
Glasses have been used in many ways since ancient times. Researchers are interested in investigating and understanding their dynamical, thermal, and rheological properties which are still pending and topical problems in physics as well as material science as they are not fully understood up to now (see for instance ref. 1–4). The glass transition plays a central role in that research because it determines the temperature range of the applications of glass forming materials including polymers. In addition to bulk polymer samples4,5 polymer nanocomposites6–9 and (semi-)isolated macromolecules,10 the research is focused also on thin polymer films with thicknesses from a few nanometers up to ca. 100 nm (see ref. 4 and 11 for overviews). The study of glass transition phenomena in thin polymer films is important for both fundamental polymer research as well as technological applications. While bulk polymers have been extensively studied, thin films exhibit unique confinement and effects that alter their behavior and molecular mobility. From the perspective of fundamental research thin films can be considered as model systems to study confinement and finite size effects in polymers science especially at solid interfaces. From the application point of view, thin polymer films are used or can be used in various technological areas such as coatings, membranes, sensors and (opto-)electronic components to mention just a few. Moreover, thin films can serve as model systems for nanocomposites and further hybrid materials.Supported thin polymer films exhibit a complex interplay of free surface and substrate interactions as well as confinement effects (see for instance ref. 12–17). The three-layer model is commonly used to describe their behavior, consisting of an adsorbed layer at the polymer–substrate interface, a bulk-like region, and a mobile free surface layer.11 Interactions between the substrate and adjacent polymer segments can lead to its adsorption, reducing molecular mobility within the formed adsorbed layer in comparison to the bulk.15,17,18 In some cases, this adsorption process may completely immobilize the adsorbed segments. The adsorbed layer is considered as irreversibly bound, as desorption requires a simultaneous detachment of multiple segments, resulting in a high activation energy.18 Nevertheless, desorption of the adsorbed layer has been detected employing fast scanning calorimetry avoiding the degradation of the polymer.19 Additionally, supported films have a free surface at the polymer–air interface, making the influence of both the polymer/air and polymer–substrate interfaces essential.11 The interaction between segments at the air/polymer interface is reduced due to missing segment/segment interactions, leading to higher mobility in the free surface layer compared to the bulk.11,20,21 The thickness of this free surface layer was found to be between 5 and 15 nm for relatively thick films with a thickness of ca. 200 nm.22,23 The part of the film between these two boundary layers is expected to have bulk-like properties (bulk-like layer).
Such kind of layered structure was also evidenced by temperature modulated scanning calorimetry investigations on poly(vinyl acetate) adsorbed on silica nanoparticles.24,25 The thermal response show three distinct ranges of the signal with can be assigned to the adsorbed layer, the bulk-like layer and the free surface layer. Therefore, the properties of a thin polymer film can be approximately discussed within an idealized 3-layer model.11 Of course gradients exist between the idealized layers. The properties of the whole film result as a complicated average of the different effects of these layers. For instance, this 3-layer model is used to explain the thickness dependence of the thermal glass transition temperature Tg. An increase or decrease of Tg with decreasing thickness, depending on the dominating influence of the free surface or the adsorbed layer, is reported (see for example ref. 4, 11, 15, 16, 26–38 and references cited therein). Here, term thermal glass transition temperature means that it is measured with so-called static methods like for instance calorimetry, dielectric expansion spectroscopy or ellipsometry. Here term static means that besides an underlying heating or cooling rate no frequency change is involved. The important point is that due to the temperature change in the measurement a transition from the equilibrium to a non-equilibrium takes place as the time scale of the molecular fluctuations become too slow to be observed in the experimental time scale defined by the cooling rate. The thermal glass transition temperature can have a different dependence on film thickness compared to a dynamic one which is measured in the framework of the linear response theory in equilibrium at temperatures above Tg for instance by dielectric or specific heat spectroscopy.39
Recently, the adsorbed layer has been of particular interest in the research (see for instance ref. 15 and 40–44). This interest is partly due to the correlation between the number of adsorbed segments and the material properties. After the pioneering work of de Gennes45 for instance Guiselin discussed the adsorption process of macromolecules at solid surfaces from a solution.46 It is worth to mention that the earlier studies considered equilibrium adsorption from dilute solutions, whereas Guiselin's contribution was to describe irreversible adsorption leading to a non-equilibrium structure with a universal density profile after solvent swelling. Later the adsorption process was studied further by O’Shaughness et al. from the theoretical point of view.47 The growth kinetics of the adsorbed layer formed from a melt on a silicon substrate was then first investigated for polystyrene by Housmans et al. which showed that the growth kinetics obey a two-step time dependence.48 For short annealing times, the growth kinetics obeys a linear time dependence. This means the thickness of the adsorbed layer increases linearly with the annealing time. In this growth regime, as many segments as possible are pined directly to the substrate. This process can be described by a first order kinetics where its rate is related to the time needed for the attachment of one segment.49 The direct pinning of the segments to the substrate is controlled by the cost of energy in the order of magnitude of kBT (kB is Boltzmann's constant). During the linear growth regime, mainly trains (successive segments in direct contact with the substrate) are formed, giving rise to a tightly adsorbed layer with a higher density than characteristic for the bulk.50 The direct pinning process leads to a crowding of segments at the solid/polymer interface at a given time tc. Therefore, the time dependence of the growth process changes from a linear to a logarithmic one where a different growth mechanism for the adsorbed layer is established. Here the adsorbed layer growth further by a diffusion of segments through the already existing adsorbed layer. Therefore, a less dense, loosely bounded adsorbed structure is formed than the strongly adsorbed layer which will allow for some molecular mobility. The structure of it consists mainly of loops and tails. In that stage the growth process takes place at a cost of entropy. It was revealed that the growth kinetics depends on several factors including the molecular weight, the annealing time and packing frustrations as wells as further processing conditions.51 Reviews about the adsorbed layer, also summarizing the behavior of different polymers, can be found elsewhere.52,53 Recently it was shown that for the main chain polymers polycarbonate and polysulfone an additional pre-growth step was observed which was assigned to the stacking of phenyl rings.54,55
To our best knowledge no investigations about the molecular dynamics in the adsorbed layer of poly(2-vinyl pyridine) (P2VP) are present in the literature. Therefore, in this work, the molecular dynamics of the adsorbed layer of P2VP prepared by a leaching approach was investigated. The behavior of thin films of P2VP in dependence on the film thickness was studied in the literature elsewhere (for example, see ref. 56–64 and the references cited there). In addition, the behavior of semi-isolated P2VP chains was also investigated by dielectric spectroscopy.65 In ref. 56 the glass transition temperature of P2VP was investigated by Glor et al. in dependence on the cooling rate employing ellipsometry. It was found that for high cooling rates, the glass transition temperature increases with decreasing film thickness whereas for low cooing rates Tg decreases with decreasing film thickness. The glass transition of thin films of poly(2-vinyl pyridine) were also investigated by specific heat spectroscopy based on adiabatic chip calorimetry by Madkour et al.66 These experiments reveal a slight decrease of the dynamic glass transition temperature with decreasing film thickness. Also experiments on nanocomposites based on P2VP and silica nanoparticles, show the existence of an adsorbed layer of P2VP on the nanoparticles.8,67 Therefore, recently the growth kinetics of the adsorbed layer of P2VP was investigated in detail.68 This investigation leads to the conclusion that the adsorbed layer grows linearly with time followed by a logarithmic growth at longer times as discussed above. It was revealed that the structure of the adsorbed changes with the annealing temperature. In addition, desorption effects have been detected for higher temperatures and longer annealing times.
In this work, the molecular mobility of the adsorbed layer of P2VP was investigated, including studies on thin films. The adsorbed layer of the polymer films was prepared by solvent-leaching experiments, while broadband dielectric spectroscopy and spectroscopic ellipsometry were employed as experimental methods. The obtained results are compared to previous works. Using advanced experimental techniques, including broadband dielectric spectroscopy and spectroscopic ellipsometry, this work aims to elucidate the molecular mobility of the adsorbed layer. The resulting insights contribute to the development of improved predictive models for polymer film behavior and enhance the performance of polymer-based materials in various applications. This research also aims to address the existing gaps in understanding the glass transition and molecular dynamics in thin polymer films, providing new perspectives into how these systems can be tailored.
Experimental part
P2VP was purchased from PSS Polymer Standards Service GmbH (Mainz, Germany). The weight and number averaged molecular weight given by the supplier are Mw = 1020 kg mol−1 and Mn = 766 kg mol−1 (PDI = 1.33). The polymer is identical to that used in ref. 68 by us. P2VP is used as received. Differential scanning calorimetry was employed to measure the glass transition temperature and found to be 371 K (98 °C, second heating run, 10 K min−1).Broadband dielectric spectroscopy (BDS)
The dielectric properties of the samples were measured by a high-resolution ALPHA analyzer (Novocontrol, Montabaur, Germany) including a sample holder with an active head. The complex dielectric permittivity ε*(f) = ε′(f) − iε′′(f) is measured at frequencies between 10−1 and 106 Hz. Here ε′ and ε′′ are the real and imaginary (loss) part of the complex dielectric function as well as f is the frequency. denotes the imaginary unit. The voltage for the dielectric measurement was adopted to the film thickness to ensure a measurement in the linear regime. A Quatro cryosystem (Novocontrol) was interfaced to the cryostat to control the sample temperature (temperature stability <0.1 K). The sample was purged with dry nitrogen during the whole measurement. The samples were prepared in two different electrode configurations as discussed in the next sections.
Preparation of the adsorbed layer
The adsorbed layer was prepared by a so-called leaching approach.69 A polymer film with a thickness of ca. 200 nm was spin-coated (3000 rpm for 60 s) on a silicon wafer and then the sample was annealed at Tg + 32 K for three days. After that, the solvent leaching procedure is applied. The samples were soaked in chloroform for 30 minute to remove all polymer chains which could be removed. This step was followed by an annealing of the sample again at the same temperature for 30 minutes to remove residual solvent. Before spin coating the silicon wafer was clean as described above.The samples for the ellipsometric measurements were prepared on SiO2 wafers cleaned in the same way. The silicon substrate for these measurements was purchased from CrysTec (Berlin, Germany).
Atomic force microscopy (AFM)
To measure the thicknesses of the films including that of the adsorbed layer and to check the topology of the films atomic force microscopy was employed. The measurements were carried out with an Asylum Research Cypher AFM (Asylum Research, Santa Barbara, CA, USA). It was equipped by a silicon cantilever with a reflective aluminum coating (AC160TS, Oxford Instruments, UK). To determine the thickness of the films and that of the adsorbed layer, the films were scratched with a sharp scalpel. After that, the step height of the scratch was measured by AFM. Per sample three scratches were prepared and measured. The obtained thicknesses are arithmetically averaged leading to an error of around 1 nm.Spectroscopic ellipsometry
The thin films for the ellipsometric measurements were prepared as described above. It is worth to mention again that for the ellipsometric measurement a less doped silicon substrate was used purchased from purchased from CrysTec (Berlin, Germany) than that for the NSE experiments. The quite different doping levels might yield a different interaction energy to P2VP.Ellipsometric measurements were carried out with a Woollam M2000DI spectroscopic ellipsometer (J.A. Woollam, Lincoln, NE, USA)70 which enables data acquisition across the ultraviolet to near infrared (UV-VIS-NIR) range, covering wavelengths from 192 nm to 1697 nm. The measurement principle of the instrument is rotating compensator ellipsometry (RCE) with a PCrSA configuration (polarizer – rotating compensator – sample – analyzer). In this study, only the wavelength range above 420 nm was considered to avoid any degradation of the polymer. The sample temperature was controlled using an INSTEC heating stage, employing a heating rate of 2 K min−1.
Ellipsometry is an indirect technique that requires constructing an optical model, incorporating parameters for the substrate, layers, and their thicknesses. To investigate the layer and develop the most suitable model to describe it, measurements were first performed at room temperature at multiple angles of incidence (AOI) values of 65°, 70°, and 75°. Ellipsometric transfer quantities Ψ and Δ were measured as functions of wavelength λ. The measured data were analyzed optimizing root-mean square deviation (DRMS) as the figure of merit. A two-layer optical model was employed, comprising a silicon substrate with a 2 nm thick native SiO2 layer (layer 1) and a P2VP polymer layer (layer 2). To avoid confusions, it is worth nothing that the optical model used for analysis of the ellipsometric measurements is different from the 3-layer model employed in the introduction for the interpretation of the data from a physical point of view. The Cauchy dispersion model was found to be suitable to fit the measured data and determine the refractive index n and thickness d of the polymer film. Based on this, additional measurements for the thermal analysis were conducted at a single angle of incidence (70°). Using the developed Cauchy dispersion model, the refractive index n and thickness d of the polymer were determined as functions of temperature. Data acquisition and model development were performed using the CompleteEASE Software (J.A. Woollam, Lincoln, NE, USA).
Results and discussion
Spectroscopic ellipsometry
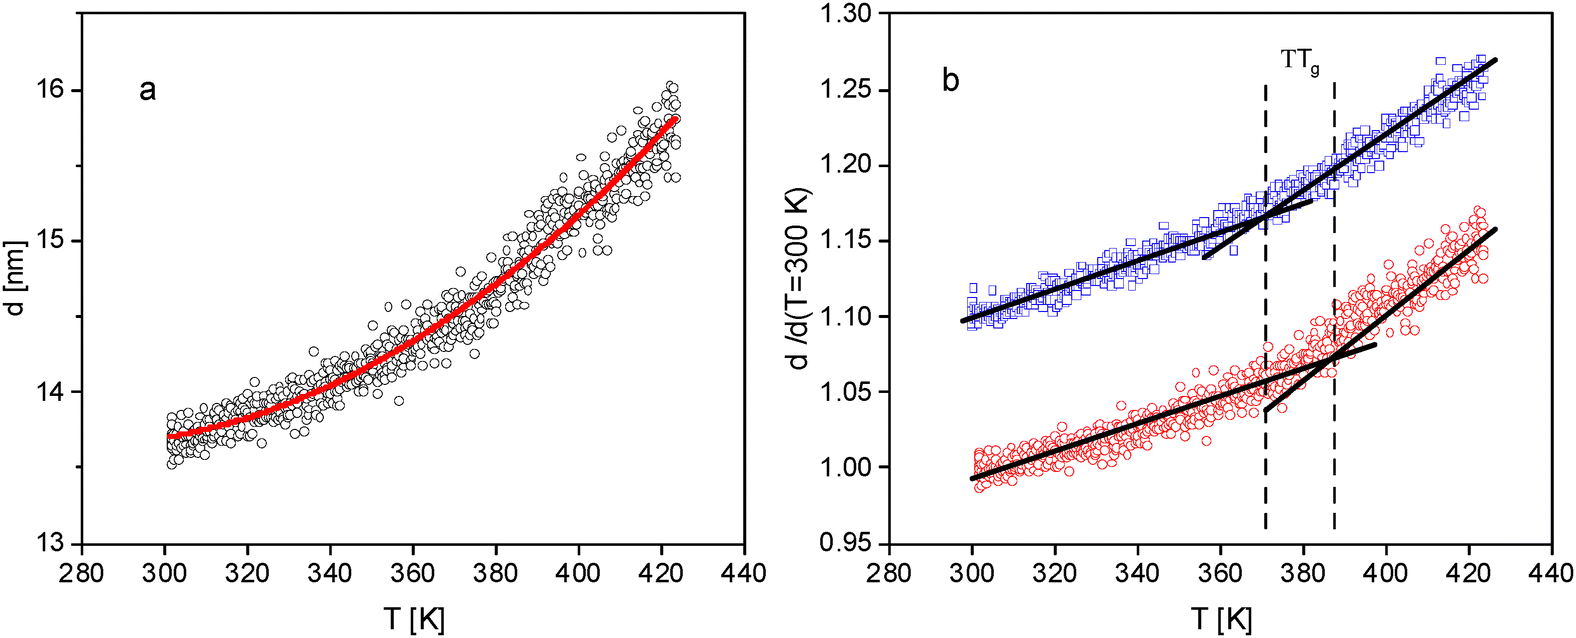
Fig. 1 displays the temperature dependence of the thickness of two films with different thicknesses at room temperature. The film thickness increases with increasing temperature with a change of d(T). This change of the thickness indicates the glass transition of the thin P2VP films characterized by the thermal glass transition temperature Tg. At this point it is worth noting, that in ref. 56 an indication of two glass transition is observed for P2VP. A similar result is discussed for polystyrene in ref. 71 Although the width of the glass transition range increases with decreasing film thickness indications for a second glass transition are not observed here. | ||
| Fig. 1 Film thickness versus temperature for two different film thicknesses at room temperature: (a) – 300 nm; (b) – 30 nm. The red solid line is a fit of eqn (1) to the data. | ||
By fitting the empirical function
 | (1) |
The estimated glass transition temperatures are plotted against film thickness in Fig. 2. For the employed heating rate Tg decreases with decreasing film thickness. To compare the results obtained by ellipsometry in this study with those from the literature, ellipsometric data from Glor et al.56 was included to Fig. 2. As shown by Glor et al. in ref. 56, the thickness dependence of the glass transition temperature depends on the employed heating rate. Therefore, a comparable rate was selected to ensure a meaningful comparison. Fig. 2 reveals that the data taken from Glor et al. follow a similar thickness dependence as the Tg values measured in this work.
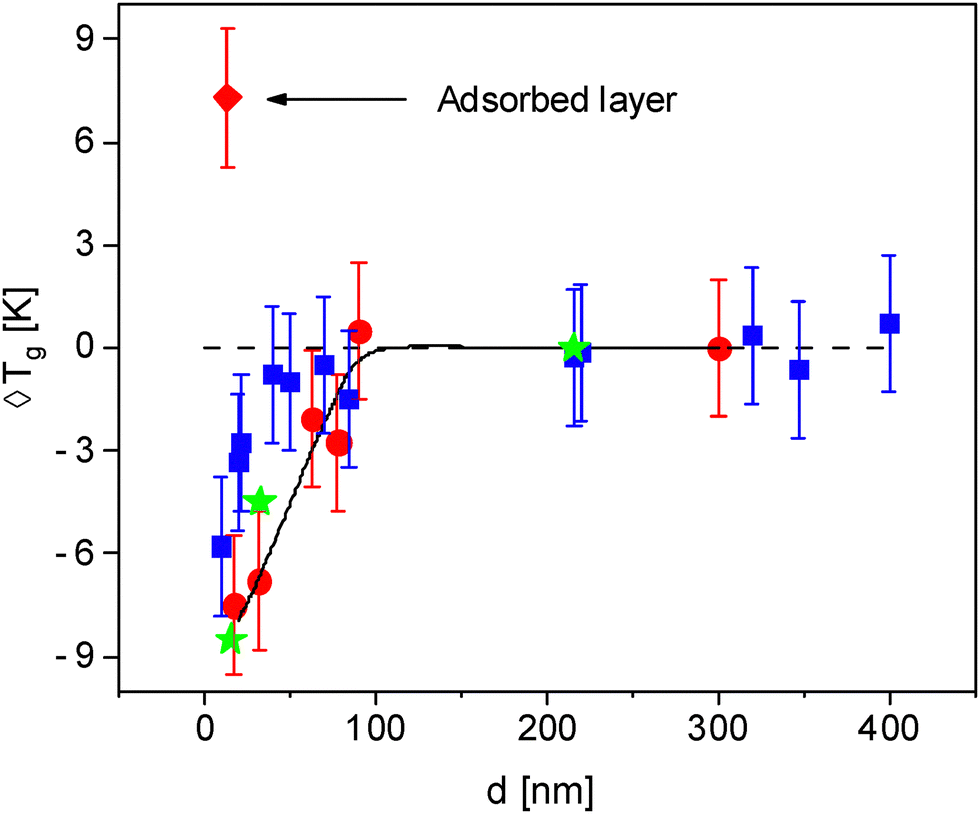 | ||
| Fig. 2 Glass transition temperature versus film thickness d: red data points obtained by spectroscopic ellipsometry, circles – thin films; diamond – adsorbed layer. The solid line is a guide to the eyes for the ellipsometric data of the thin films. Blue data points are dynamic glass transition temperatures obtained by AC chip calorimetry for P2VP taken from ref. 61. Green asterisks are ellipsometric data for P2VP taken from ref. 56 for a cooling rate of 1 K min−1. | ||
Although, the thermal Tg measured by ellipsometry and the dynamic Tg measured by AC chip calorimetry are conceptually different, Fig. 2 compares the data obtained by ellipsometry with the dynamic Tg values measured by AC chip calorimetry.61 The thickness dependence of the dynamic Tg determined by AC chip calorimetry seems to be a bit weaker compared to that obtained by ellipsometry but the difference are in the framework of errors of both measurements. It is worth nothing that the sample preparation and heating rate were similar for both measurements. With decreasing thickness, the thermal glass transition temperature decreases by ca. 8 K for the thinnest sample with a film thickness of 17 nm compared to the value of the bulk sample. For the discussion of this behavior, the 3-layer model introduced in the Introduction section is applied. As discussed above thin films can be discussed by an adsorbed layer with a reduced molecular mobility, followed by a bulk-like layer in the middle of the film and finally a mobile surface layer with an increased molecular mobility at the polymer air interface. Based on that, the obtained results suggest that the free surface layer with an enhanced molecular mobility dominates the ellipsometric response of the thin P2VP films. Several studies in the literature report a partial increase in the glass transition temperature as the film thickness decreases.54–59 The difference in thickness dependence between the data obtained here and that reported in the literature might be attributed to the different sample preparation used in the different research groups.
Besides thin films, also the adsorbed layer of P2VP on silicon is also investigated with ellipsometry. As described above the adsorbed were prepared by leaching a film with a thickness of ca. 200 nm. An example for such measurement is given in Fig. 3a. The temperature dependence of the thickness of the adsorbed layer reveals like for the thin films a glass transition is observed with a glass transition temperature of 373 K which is ca. 7 K higher than the Tg of the bulk sample (see Fig. 2). To determine whether this is a fitting artifact or a result from the thickness dependence of the adsorbed layer, in Fig. 3b the temperature dependence of the reduced thickness of the adsorbed layer is compared to that of thinnest investigated film (thickness 18 nm). This comparison reveals that the glass transition of the adsorbed layer is shifted by ca. 16 K to higher temperatures compared to that of the thin film, although thicknesses of both samples is not that different. The depression of the glass transition temperature of the thin films of P2VP is discussed above by the dominating influence of the mobile free surface layer. During the leaching process, both the bulk-like and the mobile surface layer are removed. Therefore, only the adsorbed layer is sensed which has a decreased molecular mobility corresponding to a higher glass transition temperature.
 | ||
| Fig. 3 (a) Thickness of the adsorbed layer versus temperature. The red solid line is a fit of eqn (1) to the data. (b) Comparison of the temperature dependence of the reduced thickness of the adsorbed layer (red circles) with that of a thin film with a thickness of 18 nm (blue squares). The latter data are shifted by 0.1 for sake of clearness. The lines are guides to the eyes. | ||
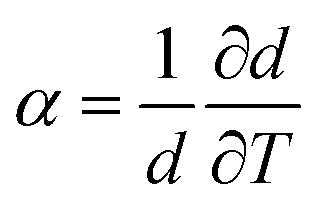
From the ellipsometry measurements the linear thermal expansion of the films in the glassy state is estimated. First the change of the thickness with temperature  is considered. 〈β〉 is estimated by fitting a linear regression to d(T) in the glassy state. 〈β〉 is plotted versus film thickness in the inset of Fig. 4. For the films with larges thicknesses 〈β〉 decreases almost linearly with decreasing film thickness (see Fig. 4), followed by a kind of plateau for thicknesses in the range from 70 to 30 nm. As the film thickness is further decreased, the thermal expansion coefficient decreases, reaching nearly zero for the adsorbed layer.
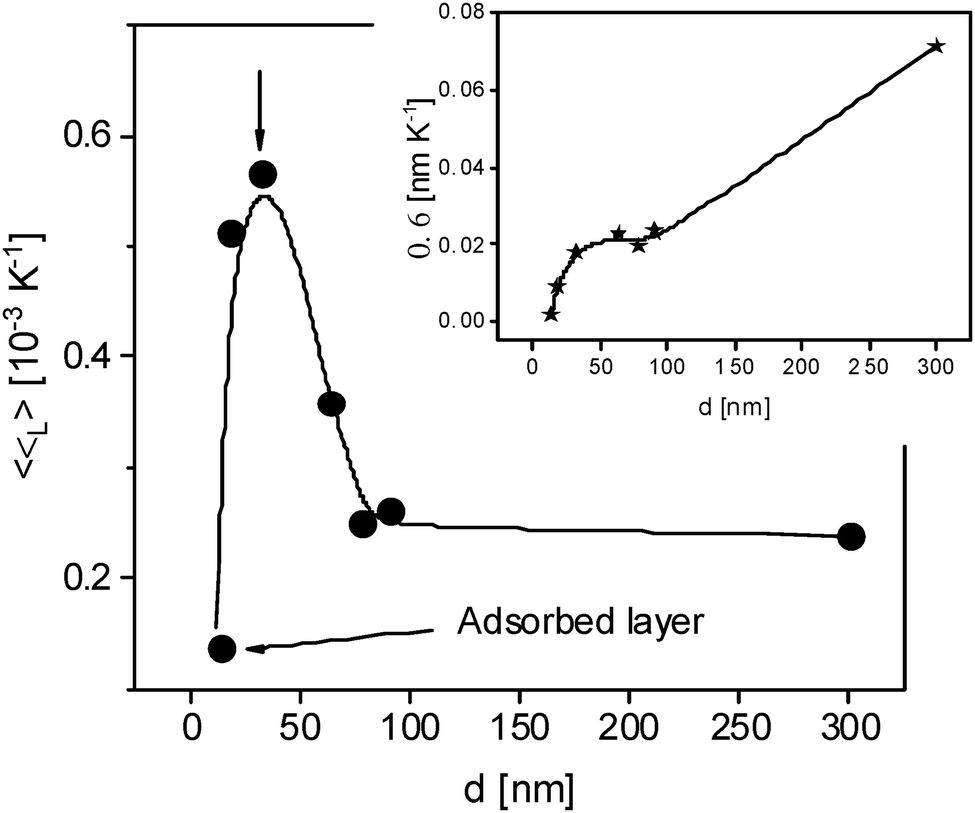 | ||
| Fig. 4 Specific linear thermal expansion coefficient 〈βL〉 versus film thickness. The line is a guide to the eyes. The inset gives the linear thermal expansion coefficient 〈β〉 versus film thickness. The line is a guide to the eyes. | ||
For a more detailed discussion, the linear specific thermal expansion coefficient 〈βL〉 = 〈β〉/dT=300K is considered in Fig. 4.73 〈βL〉 remains almost constant for film thicknesses down to 75 nm. Below ca. 75 nm, 〈βL〉 is increasing, reaching a maximum at ca. 30 nm. With a further decrease of the film thickness, the specific thermal expansion coefficient decreases strongly down to that of the adsorbed layer. This behavior resembles the thickness dependence of the dynamic glass transition temperature observed for thin films of a miscible polymer blend, which was discussed by competing effects of the free surface and the adsorbed layer.74,75 This thickness dependence of the thin blend films was attributed to the increasing influence of the mobile surface layer compared to the adsorbed layer of thin films till film thicknesses of ca. 30 nm. Here, a similar approach is used for the discussion of the thickness dependence of the specific thermal expansion coefficient. For film thicknesses larger than 75 nm the value 〈βL〉 is determined by the bulk-like layer. As the film thickness is decreased, the thickness of the bulk-like layer reduces, and influence of the mobile free surface layer becomes increasingly significant. The structure of the free surface layer is due to missing of segment/segment interactions different from that of the bulk-like layer which might lead to a higher linear specific expansion coefficient. Therefore 〈βL〉 increases with decreasing film thickness. With a further decrease of the film thickness the thermal expansion becomes increasingly dominated by that of the adsorbed layer. As the adsorbed layer exhibits a reduced molecular mobility, its expansion coefficient is expected to be lower. The opposite influences of the free surface layer and the adsorbed layer led to an increase of 〈βL〉 with decreasing film thickness. For thickness values below this maximum, 〈βL〉 decreases with further reduction in film thickness, approaching the characteristic value of the adsorbed layer. It is worth noting that the maximum value of the specific thermal expansion coefficient is observed for a film thickness of 25 to 30 nm. This critical thickness can be interpreted as the point at which the influence of the adsorbed layer percolates through the entire film.
Broadband dielectric spectroscopy
Besides the ellipsometric measurements, several thin film samples of P2VP are investigated by dielectric spectroscopy. The thin films are measured with two different electrode configurations, CEC and NSC, while the solvent leached sample could only be measured with the NSC arrangement. Fig. 5a compares the dielectric loss for thin films measured in CEC geometry with that of the bulk sample. The dielectric spectra of the bulk sample show one relaxation process within the investigated temperature range, indicated by a peak. This relaxation process corresponds to the α-relaxation or the dynamic glass transition (glassy dynamics). The increase of the dielectric loss at low frequencies is due to conductivity effects related to the drift motion of charge carriers like ions. For thin films, an α-relaxation related to a glass transition is also observed as expected. The position of the glassy dynamics seems to be independent of the film thickness for films measured in the CEC configuration. Furthermore, in addition to the conductivity observed low frequencies, an increase in dielectric loss at high frequencies is also observed, which is called electrode contribution. This increase of the dielectric loss is a parasitic effect, which is due to the limited conductivity of the electrodes (aluminum strips for the CEC or doped silicon for the NSE). More detailed discussion can be found by Yin et al.35 | ||
| Fig. 5 (a) Dielectric loss versus frequency for bulk P2VP (blue squares), thin films with thicknesses of 80 nm (brown asterisks) and 23 nm (purple triangles) measured with CEC electrodes at 427 K. The curves are shifted a long the y-scale for sake of clarity. (b) Dielectric loss versus frequency for the bulk P2VP (blue squares), a thin film measured by NSE with a thickness of 60 nm (red circles) and the adsorbed layer (green diamonds) measured at T = 413 K. | ||
Examples for the dielectric spectra of a thin film measured with NSE configuration are given in Fig. 5b. Similarly, an α-relaxation is observed for the thin films measured in CEC. At the first glance, the position of the α-relaxation of the thin film seems to be similar to that for the bulk at the temperature considered in Fig. 5b. Moreover, the dielectric strength of the α-relaxation is reduced. This result points to the formation of an adsorbed layer. For the thin film measured in NSE geometry, in addition to the α-relaxation, a further relaxation process is observed at lower frequencies than characteristic for the α-relaxation (see Fig. 5b). This process is denoted here as α*-relaxation. Notably, a similar process is observed for thin films of poly(vinyl methyl ether).16 For the thin films measured in CEC geometry, no α*-relaxation is observed. This process might be hidden by conductivity related effects. A detailed discussion for the assignment of α*-relaxation is given below.
In addition to the data measured by NSE for a thin film, the dielectric spectra obtained for the adsorbed layer is included in Fig. 5b. Firstly, like for the thin film the spectra for the adsorbed layer show two relaxation processes: the α-relaxation at higher frequencies observed as shoulder of the electrode peak and the α*-relaxation at lower frequencies. The observation of an α-relaxation in the adsorbed layer is consistent with ellipsometric data, which also indicates the presence of a glass transition (see Fig. 3a). The frequency position of the α-relaxation of the adsorbed layer appears to be similar to that of the bulk for the considered temperature. Secondly, the dielectric loss of the adsorbed layer, especially in the frequency range of the α-relaxation, is essentially lower than that measured for the thin film. Therefore, one can conclude that most of the segments in the adsorbed layer are immobilized with respect to the dynamic glass transition. The α*-relaxation of the adsorbed layer is shifted to higher frequencies compared to that of the thin films. Like for the thin film a conductivity contribution at lower frequencies as well as parasitic loss contribution due to the limited conductivity of the electrodes is observed in the dielectric spectra of the adsorbed layer.
The dielectric spectra were analyzed by fitting the Havriliak–Negami-function (HN-function) to the data. The HN-function reads76
 | (2) |
Here Δε and τHN are the dielectric strength and the characteristic relaxation time, respectively, where τHN is related to the position of the maximum of the dielectric loss fp (relaxation rate). β and γ are the shape parameters (0 < β ≤ 1 and 0 < βγ ≤ 1) which describe the symmetric and asymmetric broadening of the dielectric spectra compared to the Debye process. If more than one peak is observed in the available frequency a sum of HN-functions is fitted to the data.76 The contribution of the conductivity to the dielectric loss at low frequencies is modelled by the additional term  to the dielectric loss where σ is related to the DC conductivity. The parameter s ≤ 1 describes (non-)ohmic effects in the conductivity where s = 1 correspond to a pure ohmic conductivity contribution. The contribution due to the limited conductivity of the electrodes at high frequencies is considered by the term Aω. It can be considered as the first term of a Taylor series expansion of the Debye function.36 In that approach A is a fitting parameter which is mainly due to the time constant of this parasitic process. From the analysis of the dielectric spectra the relaxation rate fp is obtained in its temperature dependence.
The relaxation rates for the thin films measured with the CEC configuration are plotted in Fig. 6a for different film thickness in the relaxation map. As expected, the temperature dependence of the relaxation rates is curved for a dynamic glass transition when plotted versus 1/T. The Vogel/Fulcher/Tammann (VFT) equation can be employed to describe the temperature dependence of the relaxation rates. It reads77–79
 | (3) |
 | ||
| Fig. 6 Relaxation rates versus 1/T. (a) Relaxation rates of the α-relaxation for the thin films measured in the CEC: squares – bulk; circles – 287 nm; up directed triangles – 187 nm; asterisk – 80 nm: right directed triangles – 74 nm; left directed triangles – 60 nm; hexagons – 23 nm; down directed triangles – 19 nm. The solid line is a common fit of the VFT equation to all data points. (b) Relaxation rates for the thin films measured in NSE. Solid symbols α-relaxation: squares – bulk; circles – 60 nm; triangles – 34 nm and open asterisk – adsorbed layer. The solid lines are fits of the VFT equation to the corresponding data. Open symbols α*-relaxation: circles – 60 nm; triangles – 34 nm and solid asterisk-adsorbed layer. Dashed lines are fits of the Arrhenius equation to the data. The violet cross-diamonds are the relaxation rates for the SAP taken from ref. 62. The violet solid line is a fit of the Arrhenius equation to the rates of the SAP. | ||
Fig. 6b gives the temperature dependence of the relaxation rates obtained for the thin films measured in the NSE configuration. With decreasing film thickness there appears to be a slight slowing down of the of the α-relaxation. This slowing down becomes more obvious when the VFT equation is fitted to the data (see Fig. 6b). This slowing down of the dynamic glass transition with decreasing film thickness can be discussed by an interaction of the polymer segments with the substrate forming an irreversibly adsorbed layer. As the film thickness decreases, the adsorbed layer has an increasing influence on the α-relaxation of the whole thin film. The different thickness dependence observed for the thin films measured in the CEC arrangement between aluminum strips and those measured by NSE on silicon can be attributed to the different interaction of the polymer segments with aluminum and silicon. Recently, a similar behavior has been found for thin films of polycarbonate measured also in both electrode configurations.80
At first glance, there also appears to be also a discrepancy between the ellipsometry results, which show a decrease of the thermal glass transition temperature with decreasing film thickness (see Fig. 2), and the dielectric results obtained using the NSE arrangement, which indicate an increase of the dynamic Tg (see Fig. 6b). Besides consideration of the conceptually difference of the thermal and dynamic Tg in this respect it must be noted that the silicon substrates used for ellipsometry and that for the dielectric measurements employing the NSE configurations are different. As discussed in the experimental section the SiO2 substrates used for ellipsometry are undoped where silicon substrates employed for the NSE measurements are highly doped to ensure electrical conductivity. The difference in the thickness dependence of thermal Tg measured with ellipsometry and the dynamic glass transition temperature might be understood by the different interactions arising from the use of the different silicon substrates. The highly doped silicon substrate used as bottom electrode in the dielectric experiments should provide a stronger interaction with the P2VP segments than the undoped substrate employed in the ellipsometric measurements.
The temperature dependence of the relaxation rates of the α*-relaxation (Fig. 6b) is linear when plotted versus 1/T and can be described by the Arrhenius equation which reads
 | (4) |
On the one hand, in the study of Madkour,16 the α*-relaxation was assigned for poly(vinyl methyl ether) either to molecular fluctuations in the adsorbed layer or to dynamics of adsorption/desorption of segments at the substrate. On the other hand, a slow Arrhenius process (SAP) was found for a variety of polymers and molecular glass-forming materials in other reported studies.81,82 The SAP was considered as a process to be responsible on a molecular level for the equilibration of glassy systems at temperatures lower than the glass temperature.83 This means that the SAP might be important to understand physical aging where a molecular relaxation process is needed, which is faster than the glassy dynamics at temperature below the glass transition temperature measured by DSC.84
Based on these findings, it remains unclear whether the observed α*-process corresponds to a SAP or is instead related to the adsorbed layer. The experimental results, showing that the α*-relaxation is faster in the adsorbed layer compared to the thin film and exhibits a lower activation energy, support the latter interpretation. Additionally, a SAP process was found P2VP by Papadopoulos et al. in ref. 62. These data were included in Fig. 6b. The fitting of the Arrhenius equation to the temperature dependence of the relaxation rates of the SAP process yield an activation energy of ca. 130 kJ mol−1. This value is essentially lower than the values found for the α*-relaxation discussed here. Napolitano et al. developed the so-called “collective small displacements model” for the SAP process.63 In the framework of this model a criterium was derived to identify a relaxation process as a SAP. Applying the criteria to the activation energy of the α*-process it becomes obvious that is cannot be considered as a SAP. So most probably the α*-process is related to the adsorbed layer as discussed above.
Conclusion
In this study, an investigation on thin films of poly(2-vinyl pyridine) is reported. As experimental methods, spectroscopic ellipsometry and broadband dielectric spectroscopy are employed. For the ellipsometric measurements, the samples were prepared on undoped silicon by spin-coating. The thermal glass transition temperature deduced from the ellipsometric data decreases slightly as the film thickness decreases. The experimental results presented here agree with ellipsometric data from the literature measured at a comparable heating rate. Moreover, the obtained thickness dependence of the thermal glass transition estimated by ellipsometry are also in agreement with the thickness dependence of the dynamic glass transition temperature measured by AC chip calorimetry. Besides thin films, the adsorbed layer could also be directly investigated by ellipsometry. The measurement shows a glass transition for the adsorbed layer, where the value of the glass transition temperature is found to be ca. 7 K higher than that for the bulk. This is attributed to the missing free surface layer. Beside the glass transition temperature, the thickness dependence of the specific linear thermal expansion coefficient in the glassy state is considered. The specific thermal expansion coefficient shows a maximum with decreasing film thickness which was discussed by the interplay of effects resulting of the free surface layer at the air/polymer interface and the adsorbed layer at the substrate.For the dielectric experiments, two different electrode configurations are employed. First, the films were prepared in between two crossed Al electrodes (CEC). These films can be considered as capped films where no free surface of the polymer at the polymer/air interface is present. The second electrode configuration uses nanostructured electrodes (NSE) where the films have one free surface at the polymer/air interface. For the thin films measured in the CEC geometry, one relaxation process is observed, which is the dynamic glass transition (α-relaxation). Results reveal that position of the dynamic glass transition is independent of the film thickness. For the thin films measured in the NSE configuration, the α-relaxation was also observed. Contrary to the films measured in the CEC arrangement, a shift of the α-relaxation to lower frequencies (higher temperatures) is observed. The different behavior in comparison to that measured in the CEC is attributed to the different interaction of the P2VP segments with aluminum and the highly doped silicon, as it was recently reported for polycarbonate.
For the thin films measured by the NSE approach, an additional process referred to as the α*-relaxation, was observed alongside the α-relaxation. The temperature dependence of the relaxation rates of the α*-relaxation follows the Arrhenius equation. This process is discussed with two approaches. Firstly, it can be speculated that the α*-relaxation is related to molecular fluctuations taking place in the adsorbed layer. These molecular fluctuations might include processes related to adsorption and desorption of segments from the substrate. Secondly, this relaxation mode can be considered as slow Arrhenius process which is discussed to be responsible for the equilibration of glassy systems at temperatures lower than the glass temperature and for physical aging. At this stage, both interpretations remain plausible. Nevertheless, there are some arguments from theoretical considerations of the SAP that the α*-relaxation is due to the adsorbed layer.
The NSE configuration allows the investigation of the adsorbed layer by dielectric spectroscopy. The dielectric spectra for the adsorbed layer show an α-relaxation in agreement with the ellipsometry. Moreover, an α*-relaxation was also observed for the adsorbed layer. Compared to the thin films, the α*-relaxation is shifted to higher relaxation rates for the adsorbed layer and has a lower activation energy.
Conflicts of interest
There are no conflicting interests.Data availability
Data will be available from the corresponding author upon reasonable request.Acknowledgements
We thank Ms G. Hidde for experimental help.References
- P. G. Debenedetti and F. H. Stillinger, Supercooled liquids and the glass transition, Nature, 2001, 410, 259–267 CrossRef CAS PubMed.
- P. W. Anderson, Through the Glass Lightly, Science, 1995, 267, 1615–1616 CrossRef CAS PubMed.
- M. Ediger and P. Horrowell, Perspective: Supercooled liquids and glasses, J. Chem. Phys., 2012, 137, 080901 CrossRef CAS PubMed.
- S. Napolitano, E. Glynos and N. B. Tito, Glass transition of polymers in bulk, confined geometries, and near interfaces, Rep. Prog. Phys., 2017, 80, 036602 CrossRef PubMed.
- P. Papadopoulos, D. Peristeraki, G. Floudas, G. Koutalas and N. Hadjichristidis, Origin of Glass Transition of Poly(2-vinylpyridine). A Temperature- and Pressure-Dependent Dielectric Spectroscopy Study, Macromolecules, 2004, 37, 8116–8122 CrossRef CAS.
- K. J. Johnson, E. Glynos, S.-D. Maroulas, S. Narayanan, G. Sakellariou and P. F. Green, Confinement Effects on Host Chain Dynamics in Polymer Nanocomposite Thin Films, Macromolecules, 2017, 50(18), 7241–7248 CrossRef CAS.
- S. Cheng, A. P. Holt, H. Wang, F. Fan, V. Bocharova, H. Martin, T. Etampawala, T. White, T. Saito, N. Kang, M. D. Dadmun, J. W. Mays and A. P. Sokolov, Unexpected Molecular Weight Effect in Polymer Nanocomposites, Phys. Rev. Lett., 2026, 116, 03830 Search PubMed.
- D. N. Voylov, A. P. Holt, B. Doughty, V. Bocharova, H. M. Meyer, S. Cheng, H. Martin, M. Dadmun, A. Kisliuk and A. P. Sokolov, Unraveling the Molecular Weight Dependence of Interfacial Interactions in Poly(2-vinylpyridine)/Silica Nanocomposites, ACS Macro Lett., 2017, 6, 68–72 CrossRef CAS PubMed.
- E. Bailey, P. J. Griffin, M. Tyagi and K. I. Winey, Segmental Diffusion in Attractive Polymer Nanocomposites: A Quasi-Elastic Neutron Scattering Study, Macromolecules, 2019, 52, 669–678 CrossRef CAS.
- W. L. Merling, J. B. Mileski, J. F. Douglas and D. S. Simmons, The Glass Transition of a Single Macromolecule, Macromolecules, 2016, 49(19), 7597–7604 CrossRef CAS.
- M. D. Ediger and J. A. Forrest, Dynamics near Free Surfaces and the Glass Transition in Thin Polymer Films: A View to the Future, Macromolecules, 2014, 47, 471–478 CrossRef CAS.
- N. A. García and J.-L. Barrat, Entanglement Reduction Induced by Geometrical Confinement in Polymer Thin Films, Macromolecules, 2018, 51(23), 9850–9860 CrossRef.
- K. J. Johnson, E. Glynos, S.-D. Maroulas, S. Narayanan, G. Sakellariou and P. F. Green, Confinement Effects on Host Chain Dynamics in Polymer Nanocomposite Thin Films, Macromolecules, 2017, 50(18), 7241–7248 CrossRef CAS.
- A. Debot, R. P. White, J. E. G. Lipson and S. Napolitano, Experimental Test of the Cooperative Free Volume Rate Model under 1D Confinement: The Interplay of Free Volume, Temperature, and Polymer Film Thickness in Driving Segmental Mobility, ACS Macro Lett., 2019, 8, 41–45 CrossRef CAS PubMed.
- J. K. Bal, T. Beuvier, A. B. Unni, E. A. C. Panduro, G. Vignaud, N. Delorme, M. S. Chebil, Y. Grohens and A. Gibaud, Stability of polymer ultrathin films (<7 nm) made by a top-down approach, ACS Nano, 2015, 9, 8184–8193 CrossRef CAS PubMed.
- S. Madkour, P. Szymoniak, J. Radnik and A. Schönhals, Unraveling the Dynamics of Nanoscopically Confined PVME in Thin Films of a Miscible PVME/PS Blend, ACS Appl. Mater. Interfaces, 2017, 9, 37289–37299 CrossRef CAS PubMed.
- D. N. Simavilla, W. Huang, C. Housmans, M. Sferrazza and S. Napolitano, Taming the strength of interfacial interactions via nanoconfinement, ACS Cent. Sci., 2018, 4, 755 CrossRef PubMed.
- M. Braatz, L. I. Melendez, M. Sferrazza and S. Napolitano, Unexpected Impact of Irreversible Adsorption on Thermal Expansion: Adsorbed Layers Are Not That Dead, J. Chem. Phys., 2017, 146, 203304 CrossRef PubMed.
- X. Monnier, S. Napolitano and D. Cangialosi, Direct observation of desorption of a melt of long polymer chains, Nat. Commun., 2020, 11, 4567 CrossRef PubMed.
- H. Yin, S. Madkour and A. Schönhals, Unambiguous evidence for a highly mobile surface layer in ultrathin polymer films by specific heat spectroscopy on blends, Macromolecules, 2020, 48, 4936–4941 CrossRef.
- M. Gawek, S. Madkour, P. Szymoniak, J. Radnik and A. Schönhals, Energy Dependent XPS Measurements on Thin Films of a Poly(vinyl methyl ether)/Polystyrene Blend in Dependence on Film Thickness – Concentration Profile on a Nanometer Resolution to Understand the Behavior of Nanofilms, Soft Matter, 2021, 17, 69–94 RSC.
- B. Frieberg, J. Kim, S. Narayanan and P. F. Green, Surface Layer Dynamics in Miscible Polymer Blends, ACS Macro Lett., 2013, 2, 388–392 CrossRef CAS PubMed.
- K. Paeng, S. F. Swallen and M. D. Ediger, Direct measurement of the molecular motions in freestanding polymer thin films, J. Am. Chem. Soc., 2011, 133, 8444–8447 CrossRef CAS PubMed.
- F. D. Blum, G. Xu, M. Liang and C. G. Wade, Dynamics of poly(vinyl acetate) in bulk and on silica, Macromolecules, 1996, 29, 8740 CrossRef CAS.
- H. Mortazavian, C. J. Fennell and F. D. Blum, Structure of the interfacial region in adsorbed poly(vinyl acetate) on silica, Macromolecules, 2016, 49, 298 CrossRef CAS.
- S. Granick, Perspective: Kinetic and mechanical properties of adsorbed polymer layers, Eur. Phys. J. E, 2002, 9, 421 CrossRef CAS PubMed.
- B. O’Shaughnessy and D. Vavylonis, Non-equilibrium in adsorbed polymer layers, J. Phys.: Condens. Matter, 2005, 17, R63 CrossRef.
- X. Lu and Y. Mi, Glass Transition Behavior of Spin-coated Thin Films of a Hydrophilic Polymer on Supported Substrates, Chin. J. Polym. Sci., 2015, 33, 607–612 CrossRef CAS.
- S. Napolitano, A. Pilleri, P. Rolla and M. Wübbenhorst, Unusual Deviations from Bulk Behavior in Ultrathin Films of Poly(tert-butylstyrene): Can Dead Layers Induce a Reduction of Tg?, ACS Nano, 2010, 4, 841–848 CrossRef CAS PubMed.
- M. Tress, M. Erber, E. U. Mapesa, H. Huth, J. Müller, A. Serghei, C. Schick, K.-J. Eichhorn, B. Voit and F. Kremer, Glassy dynamics and glass transition in nanometric thin layers of polystyrene, Macromolecules, 2010, 43, 9937–9944 CrossRef CAS.
- C. Ellison and J. M. Torkelson, The distribution of glass transition temperatures in nanoscopically confined glass formers, Nat. Mater., 2003, 2, 695–700 CrossRef CAS PubMed.
- D. S. Fryer, R. D. Peters, E. J. Kim, E. Tomaszewski, J. J. de Pablo and P. F. Nealey, Dependence of the Glass Transition Temperature of Polymer Films on Interfacial Energy and Thickness, Macromolecules, 2001, 34, 5627–5634 CrossRef CAS.
- W. Zhang, J. F. Douglas and F. W. Starr, Why We Need to Look Beyond the Glass Transition Temperature to Characterize the Dynamics of Thin Supported Polymer Films, Proc. Natl. Acad. Sci. U. S. A., 2018, 115, 5641–5646 CrossRef CAS PubMed.
- K. Fukao and Y. Miyamoto, Slow Dynamics near Glass Transitions in Thin Polymer Films, Phys. Rev. E, 2001, 64, 011803 CrossRef CAS PubMed.
- Y. H. Napolitano and S. Schönhals, A. Molecular Mobility and Glass Transition of Thin Films of Poly(bisphenol A carbonate), Macromolecules, 2012, 45, 1652–1662 CrossRef.
- D. Labahn, R. Mix and A. Schönhals, Dielectric Relaxation of Ultrathin Films of Supported Polysulfone, Phys. Rev. E, 2009, 79, 011801 CrossRef PubMed.
- H. Yin and A. Schönhals, Calorimetric Glass Transition of Ultrathin Poly(vinyl methyl ether) Films, Polymer, 2013, 54, 2067–2070 CrossRef CAS.
- H. Yin and A. Schönhals, Calorimetric Glass Transition of Ultrathin Poly(bisphenol A carbonate) Films, Soft Matter, 2012, 8, 9132–9139 RSC.
- V. M. Boucher, D. Cangialosi, H. Yin, A. Schönhals, A. Alegria and J. Colmenero, Tg depression and invariant segmental dynamics in polystyrene thin films, Soft Matter, 2012, 8, 5119–5122 RSC.
- N. Jiang, M. Sen, M. K. Endoh, T. Koga, E. Langhammer, P. Bjöörn and M. Tsige, Thermal Properties and Segmental Dynamics of Polymer Melt Chains Adsorbed on Solid Surfaces, Langmuir, 2018, 34, 4199–4209 CrossRef CAS PubMed.
- C. Housmans, M. Sferrazza and S. Napolitano, Kinetics of Irreversible Chain Adsorption, Macromolecules, 2014, 47, 3390–3393 CrossRef CAS.
- D. N. Simavilla, A. Panagopoilou and S. Napolitano, Characterziation of Adsorbed Polymer Layers: Preparation, Determination of the Adsorbed Amount and Investigation of the Kinetics of Irreversible Adsorption, Macromol. Chem. Phys., 2017, 1700303 Search PubMed.
- S. Madkour, M. Gawek, A. Hertwig and A. Schönhals, Do Interfacial Layers in Thin Films Act as an Independent Layer within Thin Films?, Macromolecules, 2021, 54, 509–519 CrossRef CAS.
- S. Madkour, M. Gawek, P. Penner, F. Paneff, X. Zhang, A. Gölzhäuser and A. Schönhals, Can Polymers be Irreversible Adsorbed on Carbon Nanomembranes? A Combined XPS, AFM, and Broadband Dielectric Spectroscopy Study, ACS Appl. Polym. Mater., 2022, 4, 8377–8385 CrossRef CAS.
- J.-P. de Gennes, Scaling concepts in polymer physics, Cornell University Press, New York, 1979 Search PubMed.
- O. Guiselin, Irreversible Adsorption of a Concentrated Polymer Solution, Europhys. Lett., 1992, 17, 225–230 CrossRef CAS.
- B. O’Shaughnessy and D. Vavylonis, Non-equilibrium in adsorbed polymer layers, J. Phys.: Condens. Matter, 2005, 17, R63 CrossRef.
- C. Housmans, M. Sferrazza and S. Napolitano, Kinetics of Irreversible Chain Adsorption, Macromolecules, 2014, 47, 3390–3393 CrossRef CAS.
- S. Napolitano, Irreversible adsorption of polymer melts and nanoconfinement effects, Soft Matter, 2020, 16, 5348 RSC.
- N. Jiang, J. Shang, X. Di, M. K. Endoh and T. Koga, Formation mechanism of high-density, flattened polymer nanolayers adsorbed on planar solids, Macromolecules, 2014, 47, 2682 CrossRef CAS.
- K. Randazzo, M. Bartkiewicz, B. Graczykowski, D. Cangialosi, G. Fytas, B. Zuo and R. D. Priestley, Direct Visualization and Characterization of Interfacially Adsorbed Polymer atop Nanoparticles within Nanocomposites, Macromolecules, 2021, 54, 10224–10234 CrossRef CAS.
- S. Napolitano, Irreversible adsorption of polymer melts and nanoconfinement effects, Soft Matter, 2020, 16, 5348–5365 RSC.
- M. F. Thees, J. A. McGuire and C. B. Roth, Review and Reproducibility of Forming Adsorbed Layers from Solvent Washing of Melt Annealed Films, Soft Matter, 2020, 16, 5366–5387 RSC.
- H. Omar, G. Hidde, P. Szymoniak, A. Hertwig and A. Schönhals, Growth kinetics of the adsorbed layer of poly(bisphenol-A-carbonate) and its effect on the glass transition in thin film, RSC Adv., 2023, 13, 14473–14483 RSC.
- H. Omar, S. Ahamadi, D. Hülagü, G. Hidde, A. Hertwig, P. Szymoniak and A. Schönhals, Investigations of the adsorbed layer of polysulfone: Influence of the thickness of the adsorbed layer on the glass transition of thin films, J. Chem. Phys., 2024, 161, 054904 CrossRef CAS PubMed.
- E. C. Glor, G. V. Angrand and S. Fakhraai, Exploring the broadening and the existence of two glass transitions due to competing interfacial effects in this, supported polymer films, J. Chem. Phys., 2017, 146, 203330 CrossRef PubMed.
- M. Y. Efremov, E. A. Olson, M. Zhang and L. H. Allen, Glass transition of thin films of poly(2-vinyl pyridine) and poly(methyl methacrylate): nanocalorimetry measurements, Thermochim. Acta, 2003, 44403, 37–41 CrossRef.
- C. J. Ellison, S. D. Kim, D. B. Hall and J. M. Torkelson, Confinement and processing effects on glass transition temperature and physical aging in ultrathin polymer films: Novel fluorescence measurements, Eur. Phys. J. E, 2002, 8, 155–166 CrossRef CAS PubMed.
- J. H. van Zanten, W. E. Wallace and W.-L. Wu, Effect of strongly favorable substrate interactions on the thermal properties of ultrathin polymer films, Phys. Rev. E, 1996, 53, R2053 CrossRef CAS PubMed.
- C. J. Ellison, R. L. Ruszkowski, N. Fredin and J. M. Torleson, Dramatic reduction of the effect of the nanoconfinement on the glass transition of polymer films via addition of small-molecule diluent, Phys. Rev. Lett., 2004, 92, 095702 CrossRef PubMed.
- C. H. Park, J. H. Kim, M. Ree, B.-H. Sohn, J. C. Jung and W.-C. Zin, Thickness and composition dependence of the glass transition temperature in thin random copolymer films, Polymer, 2004, 45, 4507–4513 CrossRef CAS.
- A. Panagopoulou, C. Rodriguez-Tinoco, R. P. White, J. E. G. Lipson and S. Napolitano, Substrates roughness speeds up the segmental dynamics of thin films, Phys. Rev. Lett., 2020, 124, 027802 CrossRef CAS PubMed.
- R. P. White, S. Napolitano and J. E. G. Lipson, Mechanistic picture for the slow Arrhenius process in glass forming systems: The collective small displacement model, Phys. Rev. Lett., 2025, 134, 098203 CrossRef CAS PubMed.
- C. Roth, K. L. McNerny, W. F. Jager and J. M. Torkelson, Eliminating tha enhanced mobility at the free surface of polystyrene: Fluorescense studies of the glass transition temperature in thin bilayer films of immiscible polymers, Macromolecules, 2007, 40, 2568–2574 CrossRef CAS.
- M. Tress, E. U. Mapesa, W. Kossack, W. K. Kipnusu, M. Reiche and F. Kremer, Glassy dynamics in condensed isolated polymer chains, Science, 2013, 341, 1371–1374 CrossRef CAS PubMed.
- S. Madkour, H. Yin, M. Füllbrandt and A. Schönhals, Calorimetric evidence for a mobile surface layer in ultrathin polymeric films poly(2-vinyl pyridine), Soft Matter, 2015, 11, 7942 RSC.
- A. P. Holt, P. J. Griffin, V. Bocharova, A. L. Agapov, A. E. Imel, M. D. Dadmun, J. R. Sangoro and A. P. Sokolov, Dynamics at the Polymer/Nanoparticle Interface in Poly(2-vinylpyridine)/Silica Nanocomposites, Macromolecules, 2014, 47, 1837–1843 CrossRef CAS.
- M. Gawek, H. Omar, P. Szymoniak and A. Schönhals, Growth kinetics of the adsorbed layer of poly(2-vinylpyridine) – an indirect observation of desorption of polymers from the substrate, Soft Matter, 2023, 19, 3975–3982 RSC.
- S. Napolitatno and M. Wübbenhorst, The lifetime of the deviations from bulk behaviour in polymers confined at the nanoscale, Nat. Commun., 2011, 2, 260 CrossRef.
- J. A. Woollam Company, M-2000 Ellipsometer, https://www.jawoollam.com/products/m-2000-ellipsometer, Accessed April 28th, 2025.
- D. Cangialosi, A. Alegría and J. Colmenero, Effect of nanostructure on the thermal glass transition and physical aging in polymermaterials, Prog. Polym. Sci., 2026, 54–55, 128–147 Search PubMed.
- J. A. Forrest and K. Dalnoki-Veress, The glass transition in thin polymer films, Adv. Colloid Interface Sci., 2001, 94, 167–196 CrossRef CAS.
- Generally, the linear thermal expansion coefficient is defined by
 . For α < 1, 1/d can be approximated by 1/d_300 K.
 - S. Madkour, P. Szymoniak, A. Hertwig, M. Heidari, R. von Klitzing, S. Napolitano, M. Sferrazza and A. Schönhals, Decoupling of dynamic and thermal glass transition in thin films of a PVME/PS blend, ACS Macro Lett., 2027, 6, 1156–1161 CrossRef PubMed.
- S. Madkour, P. Szymoniak, C. Schick and A. Schönhals, Unexpected behavior of ultra-thin films of blend of polystyrene/poly(vinyl methyl ether) studied by specific heat spectroscopy, J. Chem. Phys., 2017, 146, 203321 CrossRef PubMed.
- A. Schönhals and F. Kremer, Analyse of dielectric spectra, in Broadband Dielectric Spectroscopy, ed. F. Kremer and A. Schönhals, Springer, Berlin, Heidelberg, 2003, p. 59 Search PubMed.
- H. Vogel, The temperature dependence law of the viscosity of fluids, Phys. Z., 1921, 22, 645–646 CAS.
- G. S. Fulcher, Analysis of recent measurements of the viscosity of glasses, J. Am. Ceram. Soc., 1925, 8, 339 CrossRef CAS.
- G. Tammann and W. Hesse, The dependence of viscosity on temperature in hypothermic liquids, Z. Anorg. Allg. Chem., 1926, 156, 245–257 CrossRef CAS.
- H. Omar, S. Ahmadi, P. Szymoniak and A. Schönhals, Molecular Mobility of Thin Films of Poly (bisphenol-A carbonate) Capped and with one Free Surface: From Bulk-like Samples down to the Adsorbed Layer, Soft Matter, 2025, 21, 241–254 RSC.
- Z. Song, C. Rodriguez-Tinoco, A. Mathew and S. Napolitano, Fast Equilibration Mechanisms in Disordered Materials Mediated by Slow Liquid Dynamics, Sci. Adv., 2022, 8, 1–7 Search PubMed.
- F. Caporaletti and S. Napolitano, The Slow Arrhenius Process in Small Organic Molecules, Phys. Chem. Chem. Phys., 2024, 26, 745–748 RSC.
- Z. Song, C. Rodriguez-Tinoco, A. Mathew and S. Napolitano, Fast Equilibration Mechanisms in Disordered Materials Mediated by Slow Liquid Dynamics, Sci. Adv., 2022, 8, 1–7 Search PubMed.
- D. Cangialosi, Physical aging and vitrification in polymers and other glasses: Complex behavior and size effects, J. Polym. Sci., 2024, 62, 1952–1974 CrossRef CAS.
| This journal is © The Royal Society of Chemistry 2025 |