 Open Access Article
TAGS-related indium compounds and their thermoelectric properties – the solid solution series (GeTe)xAgInySb1−yTe2 (x = 1–12; y = 0.5 and 1)†
Thorsten
Schröder
a,
Tobias
Rosenthal
a,
Nadja
Giesbrecht
a,
Stefan
Maier
a,
Ernst-Wilhelm
Scheidt
b,
Wolfgang
Scherer
b,
G. Jeffrey
Snyder
c,
Wolfgang
Schnick
a and
Oliver
Oeckler
*d
aDepartment of Chemistry, University of Munich (LMU), Butenandtstraße 5-13 (D), 81377 Munich, Germany
bInstitute for Physics, University of Augsburg, Universitätsstraße 1, 86159 Augsburg, Germany
cMaterials Science, California Institute of Technology, 1200 E. California Blvd., Pasadena, CA 91125, USA
dFaculty of Chemistry and Mineralogy (IMKM), Leipzig University, Scharnhorststraße 20, 04275 Leipzig, Germany. E-mail: oliver.oeckler@gmx.de; Fax: +49-341-97-36299; Tel: +49-341-97-36250
First published on 7th February 2014
Abstract
Various members of the solid solution series (GeTe)xAgInySb1−yTe2 can be obtained by quenching high-temperature phases (x = 12 for y = 1 and x > 5 for y = 0.5). In contrast, high-temperature and high-pressure conditions (2.5 GPa, 350 °C) are required for the synthesis of members with In contents >3.6 atom% (such as x < 12 for y = 1 and x < 5 for y = 0.5) in order to avoid the formation of AgInTe2. The latter exhibits tetrahedrally coordinated indium atoms under ambient conditions and therefore does not form mixed crystals with tellurides of germanium and antimony that are characterized by sixfold coordinated atom sites. Solid solutions with x ≤ 5 crystallize in rocksalt-type structures with octahedrally coordinated indium, whereas the ones with x > 5 adopt the α-GeTe structure type (3 + 3 coordination). Thus, in all samples investigated, 3 or 4 cations are disordered at one Wyckoff position. The quenched high-temperature or high-pressure phases, respectively, are almost homogeneous. Their powder X-ray diffraction patterns suggest pure phases; yet, high-resolution electron microscopy occasionally reveals a very small extent of nanoscopic precipitates as well as dislocations and twinning. (GeTe)5.5AgIn0.5Sb0.5Te2 shows a maximal ZT value of 0.75 even when (partial) decomposition into the TAGS material (GeTe)11AgSbTe2 and chalcopyrite-type AgInTe2 has occurred at 300 °C. (GeTe)5.5AgInTe2 prepared under high-pressure conditions exhibits a ZT value of 0.6 at 125 °C, i.e. far below the decomposition temperature and thus is an interesting new low-temperature thermoelectric material.
Introduction
Under ambient conditions, In is tetrahedrally coordinated by Te in chalcopyrite-type AgInTe2.1 A rocksalt-type high-pressure polymorph with octahedral coordination of In has been described; however, upon decompression, this phase cannot be obtained as a metastable material as it transforms back to the chalcopyrite structure type.2 This shows the strong tendency of In to be tetrahedrally coordinated. It is possible to obtain comparable metastable, i.e. kinetically inert, compounds with octahedrally coordinated In by partially substituting In in AgInTe2 by Sb; however, high-pressure conditions are always required to synthesize these compounds.3 This substitution leads to the rocksalt-type solid solution series AgInySb1−yTe2. Its member AgIn0.5Sb0.5Te2 exhibits a dimensionless thermoelectric figure of merit ZT = S2σT/κ (with the Seebeck coefficient S, the electrical conductivity σ, the temperature T and the thermal conductivity κ)4 of 0.15 at room temperature (RT). Due to the solid-solution alloying, the low thermal conductivities of both end members AgInTe2 and AgSbTe2 (κ ∼ 2 W K−1 m−1 and 0.6 W K−1 m−1,5 respectively) are further reduced to 0.4 W K−1 m−1 at RT. These compounds decompose to chalcopyrite-type AgInTe2 and rocksalt-type AgSbTe2 at temperatures >150 °C. In general, tellurides crystallizing in these structure types exhibit very good thermoelectric properties: rocksalt-type compounds mainly due to their low lattice thermal conductivities,6 and materials with structures derived from sphalerite (e.g. Cu2Zn1−xFexGeSe4, CuGaTe2, CuInTe2) predominantly due to their high Seebeck coefficients.7–10Despite the lower κ of AgIn0.5Sb0.5Te2, the ZT value of AgSbTe2 at RT (∼0.3) is higher due to its higher Seebeck coefficient.11 It is well known that the thermoelectric properties of AgSbTe2 can further be improved in solid solutions with GeTe,12,13 resulting in so-called TAGS materials (GeTe)x(AgSbTe2).14–17 These compounds have been the subject of much investigation because of their high ZT values (up to 1.7) at elevated temperatures.18,19 Further optimization of TAGS materials was achieved by substituting Ge with Sn as well as by doping with rare-earth elements.20–22 However, to the best of our knowledge, the substitution of Sb with In has not been investigated, probably because many of these compounds cannot be obtained by classical solid-state synthesis as they would contain octahedrally coordinated In.
Consequently, solid solutions of GeTe, AgInTe2 and additional AgSbTe2 are intriguing as they would probably combine the effects known from TAGS with the low thermal conductivity of AgIn0.5Sb0.5Te2 and thus might exhibit high ZT values. Here we report on solid solutions (GeTe)x(AgInTe2) which we call TIGS in analogy to TAGS and on compounds (GeTe)xAgIn0.5Sb0.5Te2, i.e. TAGS materials in which half of the Sb is substituted by In.
Experimental
Synthesis
Samples of (GeTe)xAgInySb1−yTe2 (x = 1–12; y = 0.5, 1) were prepared by reacting stoichiometric mixtures of the elements (germanium 99.999%, Sigma-Aldrich; silver 99.9999%, Alfa Aesar; antimony 99.9999%, Smart Elements; indium 99.996%, Smart Elements; tellurium 99.999%, Alfa Aesar) at 950 °C for 12 h in sealed silica ampoules under an argon atmosphere. The ampoules containing the resulting melts were quenched in water and subsequently annealed for 3 days at 550 °C. After that, the ampoules containing the annealed ingots were quenched in water. This synthesis route yielded (GeTe)xAgInySb1−yTe2 samples with x = 12 and y = 1 as well as those with x = 5, 5.5, 7 or 12 and y = 0.5 which were homogeneous according to powder X-ray diffraction patterns (cf. section Crystal structure). Samples with higher overall In contents, i.e. x = 1, 5, 5.5, 7 and y = 1 or x = 1 and y = 0.5 were not single-phase (see below); they were used as starting materials for further high-pressure (HP) synthesis.A multi-anvil hydraulic press (Voggenreiter, Mainleus, Germany) was used for the HP experiments.23–26 The finely ground starting materials were densely loaded in crucibles sealed with caps (material: hexagonal boron nitride, Henze, Kempten, Germany). These were centered in two nested graphite tubes, which acted as a resistance furnace. In order to keep the inner graphite tube in place, the remaining volume at both ends of the outer tube was filled with MgO discs. This arrangement was surrounded by a zirconia tube and placed in a pierced Cr2O3-doped MgO octahedron (edge length: 25 mm; Ceramic Substrates & Components, Isle of Wight, Great Britain). In order to electrically contact the graphite tubes, Mo plates were used that were connected to two of the eight truncated tungsten carbide cubes (truncation edge length: 17 mm), which served as anvils for the compression. These cubes were separated by pyrophyllite gaskets. Within two hours, this assembly was compressed to 2.5 GPa. At this pressure, the temperature was raised to 350 °C within 30 min and the samples were subsequently kept at this temperature for 8 h. Afterwards, the samples were quenched to room temperature by switching off the furnace. The arrangement was kept under pressure for another hour to ensure that the sample was cooled down completely before reducing the pressure to ambient conditions within 6 h.
X-ray diffraction
Powder X-ray diffraction (PXRD) patterns of the finely ground samples fixed between Mylar foils on a flat sample holder with vacuum grease were collected using a Huber G670 Guinier camera (Cu-Kα1 radiation, Ge(111) monochromator, λ = 1.54051 Å) with a fixed imaging plate and an integrated read-out system.Temperature-dependent PXRD patterns were measured using a STOE Stadi P diffractometer (Mo-Kα1 radiation, Ge(111) monochromator, λ = 0.71093 Å) with an imaging plate detector system in a modified Debye–Scherrer geometry. The powdered samples were filled into silica glass capillaries (0.3 mm diameter) under an argon atmosphere and sealed with vacuum grease. Data were measured up to 600 °C at a heating rate of 10 °C min−1 in 20 °C steps. For (GeTe)5.5AgIn0.5Sb0.5Te2, further diffraction patterns were recorded from 600 °C to RT at a cooling rate of 5 °C min−1.
Phase homogeneity was evaluated using WINXPOW27 and Rietveld refinements were carried out using the program TOPAS.28
Electron microscopy, diffraction and X-ray spectroscopy
A JSM-6500F (Jeol, USA) scanning electron microscope (SEM) equipped with an energy dispersive X-ray (EDX) detector (model 7418, Oxford Instruments, Great Britain) was used for the collection of X-ray spectra of representative parts of the samples. The results of 5–15 point analyses were averaged. The compositions determined can be found in Tables S1 and S2 in the ESI.†For high-resolution transmission electron microscopy (HRTEM), the samples were ground, dispersed in ethanol and distributed on copper grids coated with a holey carbon film (S166-2, Plano GmbH, Germany) which were subsequently fixed on a double-tilt holder. HRTEM images and selected area electron diffraction (SAED) patterns were recorded using a Titan 80-300 (FEI, USA) with a field-emission gun operated at 300 kV equipped with a TEM TOPS 30 EDX spectrometer (EDAX, Germany). The images were recorded using an UltraScan 1000 camera (Gatan, USA, resolution 2k × 2k). For HRTEM and SAED data evaluation, the Digital Micrograph and EMS software packages were used;29,30 EDX data were evaluated with ES Vision.31
Thermoelectric characterization
The thermoelectric properties of (GeTe)5.5AgIn0.5Sb0.5Te2 prepared by quenching the sample from 550 °C were determined from 25 °C to 500 °C. The electrical conductivity σ was measured in 50 K steps at a heating rate of 150 K h−1 using the van der Pauw method32 and pressure-assisted Nb contacts in an in-house built facility at Caltech.33 The Seebeck coefficient S was determined using Chromel–Nb thermocouples in steps of 61 K at a heating rate of 150 K h−1 and a temperature oscillation rate of ±7.5 K.34 The thermal diffusivity Dth was measured using a LFA457 MicroFlash (Netzsch, Germany) laser flash system. The thermal conductivity was calculated according to κ = DthCpd with a calculated heat capacity Cp using the Dulong–Petit approximation and the density d determined by weighing the sample and measuring its dimensions. The combined uncertainty of the measurements is ca. 20% for the ZT value.The thermoelectric properties of a (GeTe)5.5AgInTe2 sample prepared under high-pressure conditions were characterized between 4 K and 400 K using a physical property measurement system (PPMS, Quantum Design). The temperature dependent electrical resistivity ρ was measured using a standard four-probe dc method by employing a constant current of 5 mA with a cooling/heating rate of 2 K min−1; the estimated uncertainty of ρ amounts to ca. 10%. The thermal transport option of the PPMS with a cooling/heating rate of 0.5 K min−1 was used to measure the κ and S values simultaneously. The measurements relied on a relaxation method employing one heater and two thermometers to determine the induced thermal voltage and the temperature gradient along the sample. The uncertainty of these values is approximately 5%.
Results and discussion
Sample characterization and optimal conditions for syntheses
The present investigation focuses on compounds (GeTe)xAgInySb1−yTe2 with x = 1, 5, 5.5, 7 and 12 for y = 0.5 and 1, which cover a broad range of In-substituted TAGS materials. The stoichiometry includes In contents from 16.7 atom% in (GeTe)AgInTe2 down to 1.8 atom% in (GeTe)12AgIn0.5Sb0.5Te2. Quenched melts with In-rich compositions such as (GeTe)xAgInTe2 (x = 1–7) contain mixtures of chalcopyrite-type AgInTe2 and GeTe. In contrast, related homogeneous TAGS materials, i.e. (GeTe)xAgSbTe2, are easily obtained.15 However, syntheses under high-pressure and high-temperature conditions (2.5 GPa and 350 °C for all high-pressure experiments mentioned in this article) yield samples of, for instance, (GeTe)AgInTe2 and (GeTe)AgIn0.5Sb0.5Te2 with a rocksalt type structure whose PXRD patterns exhibit no reflections of side phases (cf. section Crystal structure).The compositional range investigated allows one to elucidate the influence of In on the reaction products under various synthesis conditions. It turned out that samples of (GeTe)xAgInTe2 with x < 12 and (GeTe)xAgIn0.5Sb0.5Te2 with x < 5, all of which contain more than 3.6 atom% In, consist of mixtures of AgInTe2 and GeTe or (GeTe)2xAgSbTe2, respectively, both after quenching the melt and after quenching solid ingots after annealing them at 550 °C. For such In-rich compounds, high-pressure conditions are required to obtain samples that are of single-phase according to their PXRD patterns. In contrast, single-phase compounds (according to PXRD) with In contents ≤3.6 atom%, i.e. (GeTe)12AgInTe2 and (GeTe)xAgIn0.5Sb0.5Te2 with x ≥ 5, respectively, can be obtained by quenching the samples after annealing them at 550 °C (existence range of high-temperature (HT) phases, cf. Thermal behavior section).
The chemical compositions of all compounds whose PXRD patterns show no side phases were determined by SEM-EDX measurements. They agree very well with the nominal composition (cf. Tables S1 and S2 in the ESI†).
Crystal structure
PXRD patterns of (GeTe)xAgInySb1−yTe2 samples (cf.Fig. 1 and 2) without reflections from side phases (synthesis with or without HP depending on the In content as described above) could be indexed assuming cubic metrics for x ≤ 5.5; however, for x = 5.5 the structure is rhombohedral (see below). Samples with x > 5.5 clearly show reflection splittings in conformity with rhombohedral unit-cell dimensions. All structures were refined using the Rietveld method. Even if the metrics is cubic, rhombohedral structures must be considered as suggested by the reflection splittings for x > 5.5. Symmetry reduction is not unusual in comparable compounds that are pseudocubic from the point of view of lattice parameters. Therefore, refinements in space groups with rhombohedral symmetry were tested, especially in R3m, which corresponds to the α-GeTe type.12,13 In the trigonal setting, the z parameter of the cations is a measure of the formation of layers when the anions of the polar structure are fixed on the origin. If z deviates significantly from 0.5, GeTe-type layers are formed which correspond to a binary variant of the A7 structure type of gray arsenic.The cation positions in all structure models were occupied according to the nominal composition with Ge, Ag, In, and Sb if present, refining a common displacement parameter for all cations on a shared Wyckoff site (i.e. a common z parameter in rhombohedral compounds); the anion position was occupied with Te whose displacement parameter was refined individually. Due to the use of a flat sample holder, preferred orientation had to be taken into account, using 4th order spherical harmonics with a single parameter for x ≤ 5 (cubic) and with 3 parameters for x ≥ 5.5 (trigonal). Anisotropic broadening of the reflection profiles was refined for (GeTe)xAgInTe2 (with x = 5.5, 7 and 12) and (GeTe)xAgIn0.5Sb0.5Te2 (with x = 7 and 12) using the LeBail–Jouanneaux algorithm.35 In addition to the profile fits of the Rietveld refinements in Fig. 1 and 2, crystal data and details of the structure refinement as well as the atomic parameters are given in Tables 1 and 2, respectively, for the TIGS compounds and in Tables 3 and 4, respectively, for the quinary compounds. Further details of the crystal structure investigation may be obtained from Fachinformationszentrum Karlsruhe, 76344 Eggenstein-Leopoldshafen, Germany (fax: (+49)7247-808-666; e-mail: crysdata@fiz-karlsruhe.de, http://www.fiz-karlsruhe.de/request_for_deposited_data.html) on quoting the depository numbers CSD 426809, 426800, 426805, 426808 and 426803 for (GeTe)xAgInTe2 with x = 1, 5, 5.5, 7 and 12, respectively, or CSD 426807, 426801, 426804, 426802 and 426806 for (GeTe)xAgIn0.5Sb0.5Te2 with x = 1, 5, 5.5, 7 and 12, respectively. The corresponding cif files are also available as the ESI.†
| Compound | (GeTe)AgInTe2 | (GeTe)5AgInTe2 | (GeTe)5.5AgInTe2 | (GeTe)7AgInTe2 | (GeTe)12AgInTe2 |
|---|---|---|---|---|---|
| Asymmetric unit | Ge1/3Ag1/3In1/3Te | Ge5/7Ag1/7In1/7Te | Ge11/15Ag2/15In2/15Te | Ge7/9Ag1/9In1/9Te | Ge12/14Ag1/14In1/14Te |
| Molar mass (of asymmetric unit)/g mol−1 | 225.94 | 211.29 | 210.44 | 208.81 | 205.64 |
| F(000) | 378.5 | 354.3 | 264.7 | 262.7 | 258.7 |
| Crystal system/space group (no.) | Cubic/Fm![[3 with combining macron]](https://www.rsc.org/images/entities/char_0033_0304.gif) m (225) m (225) |
Trigonal/R3m (160) | |||
| Z | 4 | 3 | |||
| Lattice parameters/Å | 5.96391(2) | 5.95766(3) | a = 4.21824(2), c = 10.3378(1) | a = 4.20056(2), c = 10.4188(1) | a = 4.18692(3), c = 10.5211(1) |
| Cell volume/Å3 | 212.126(2) | 211.460(3) | 159.302(2) | 159.207(2) | 159.728(3) |
| Density (X-ray)/g cm−3 | 7.075 | 6.637 | 6.581 | 6.534 | 6.413 |
| Absorption coefficient/mm−1 | 163.93 | 140.433 | 138.55 | 135.87 | 130.40 |
| Radiation | Cu-Kα1 (λ = 1.540596 Å) | ||||
| 2θ range/° | 20–100 | ||||
| No. of data points | 16001 | ||||
| No. of reflections | 13 | 30 | |||
| Constraints | 2 | 4 | |||
| Refined parameters/thereof background | 23/12 | 39/12 | |||
| R p/Rwp | 0.0151/0.0216 | 0.0195/0.0277 | 0.0170/0.0255 | 0.0148/0.0204 | 0.0206/0.0306 |
| R Bragg | 0.0156 | 0.0108 | 0.0117 | 0.0120 | 0.0062 |
| Goof | 0.746 | 0.974 | 0.941 | 0.684 | 1.101 |
| Sample | Atom positions | x y z | s.o.f. | B iso |
|---|---|---|---|---|
| (GeTe)AgInTe2 | Ge/Ag/In | 0 0 0 | 1/3 1/3 1/3 | 1.508(15) |
| Te | 0.5 0.5 0.5 | 1 | 0.797(12) | |
| (GeTe)5AgInTe2 | Ge/Ag/In | 0 0 0 | 5/7 1/7 1/7 | 1.980(14) |
| Te | 0.5 0.5 0.5 | 1 | 0.810(11) | |
| (GeTe)5.5AgInTe2 | Ge/Ag/In | 0 0 0.4834(4) | 11/15 2/15 2/15 | 1.28(6) |
| Te | 0 0 0 | 1 | 1.11(2) | |
| (GeTe)7AgInTe2 | Ge/Ag/In | 0 0 0.48596(18) | 7/9 1/9 1/9 | 2.05(3) |
| Te | 0 0 0 | 1 | 1.057(14) | |
| (GeTe)12AgInTe2 | Ge/Ag/In | 0 0 0.47877(16) | 12/14 1/14 1/14 | 1.81(3) |
| Te | 0 0 0 | 1 | 0.847(18) |
| Compound | (GeTe)AgIn0.5Sb0.5Te2 | (GeTe)5AgIn0.5Sb0.5Te2 | (GeTe)5.5AgIn0.5Sb0.5Te2 | (GeTe)7AgIn0.5Sb0.5Te2 | (GeTe)12AgIn0.5Sb0.5Te2 |
|---|---|---|---|---|---|
| Asymmetric unit | Ge1/3Ag1/3In1/6Sb1/6Te | Ge5/7Ag1/7In1/14 Sb1/14Te | Ge11/15Ag2/15In1/15 Sb1/15Te | Ge7/9Ag1/9In1/18 Sb1/18Te | Ge12/14Ag1/14In1/28Sb1/28Te |
| Molar mass (of asymmetric unit)/g mol−1 | 227.21 | 211.67 | 211.02 | 209.31 | 206.00 |
| F(000) | 380 | 354.7 | 265.2 | 263.1 | 259.1 |
| Crystal system/space group (no.) | Cubic/Fm![[3 with combining macron]](https://www.rsc.org/images/entities/char_0033_0304.gif) m (225) m (225) |
Trigonal/R3m (160) | Trigonal/R3m (160) | ||
| Z | 4 | 3 | |||
| Lattice parameters/Å | 5.99892(1) | 5.97300(4) | a = 4.2218(1), c = 10.3821(4) | a = 4.20712(5), c = 10.4602(2) | a = 4.18601(3), c = 10.5582(1) |
| Cell volume/Å3 | 215.883(1) | 213.097(4) | 160.255(11) | 160.340(6) | 160.222(3) |
| Density (X-ray)/g cm−3 | 6.991 | 6.598 | 6.560 | 6.503 | 6.405 |
| Absorption coefficient/mm−1 | 163.48 | 140.28 | 138.75 | 135.78 | 130.58 |
| Radiation | Cu-Kα1 (λ = 1.540596 Å) | ||||
| 2θ range/° | 20–100 | ||||
| No. of data points | 16001 | ||||
| No. of reflections | 13 | 30 | 30 | ||
| Constraints | 3 | 6 | 6 | ||
| Refined parameters/thereof background | 23/12 | 27/12 | 39/12 | ||
| R p/Rwp | 0.0150/0.0210 | 0.0217/0.0313 | 0.0165/0.0241 | 0.0183/0.0252 | 0.0233/0.0355 |
| R Bragg | 0.0032 | 0.0043 | 0.0064 | 0.0082 | 0.0064 |
| Goof | 0.722 | 1.120 | 0.781 | 0.889 | 1.310 |
| Sample | Atom positions | x y z | s.o.f. | B iso |
|---|---|---|---|---|
| (GeTe)AgIn0.5Sb0.5Te2 | Ge/Ag/In/Sb | 0 0 0 | 1/3 1/3 1/6 1/6 | 2.176(12) |
| Te | 0.5 0.5 0.5 | 1 | 1.462(10) | |
| (GeTe)5AgIn0.5Sb0.5Te2 | Ge/Ag/In/Sb | 0 0 0 | 5/7 1/7 1/14 1/14 | 2.37(2) |
| Te | 0.5 0.5 0.5 | 1 | 0.810(18) | |
| (GeTe)5.5AgIn0.5Sb0.5Te2 | Ge/Ag/In/Sb | 0 0 0.4857(8) | 11/15 2/15 1/15 1/15 | 2.00(11) |
| Te | 0 0 0 | 1 | 1.14(5) | |
| (GeTe)7AgIn0.5Sb0.5Te2 | Ge/Ag/In/Sb | 0 0 0.4813(2) | 7/9 1/9 1/18 1/18 | 1.65(4) |
| Te | 0 0 0 | 1 | 1.32(2) | |
| (GeTe)12AgIn0.5Sb0.5Te2 | Ge/Ag/In/Sb | 0 0 0.47722(14) | 12/14 1/14 1/28 1/28 | 1.71(3) |
| Te | 0 0 0 | 1 | 0.991(19) |
It turned out that the average structure of the samples with x ≤ 5 corresponds to the rocksalt structure type. The atom positions refined in trigonal space groups (for testing purposes) do not deviate from those of the rocksalt type, which in combination with the cubic unit cell confirms the assumption of a cubic average structure. In these compounds, the lattice parameter a and thus the average cation–anion distance, which corresponds to a/2, decreases with increasing Ge content both for TIGS compounds as well as for the quinary (GeTe)xAgIn0.5Sb0.5Te2 phases. The lattice parameters of the latter phases are slightly larger than those of the corresponding Sb-free TIGS samples.
The compounds with x > 5 display, however, rhombohedral symmetry. Although for x = 5.5, the refined c/a ratios (2.451 for (GeTe)5.5AgInTe2 and 2.459 for (GeTe)5.5AgIn0.5Sb0.5Te2) deviate only slightly from that of the rhombohedral setting of a cubic unit cell (c/a = 2.449), the z parameter of the cations clearly indicates the formation of α-GeTe-type layers which precludes cubic symmetry. This becomes more pronounced for increasing GeTe contents (x > 5.5) where, in addition, the reflection splittings in the PXRD patterns strongly support rhombohedral structures. With increasing GeTe content, i.e. from x = 5.5 to x = 12, the a lattice parameters become smaller and the c lattice parameters become larger. These opposite trends lead to a non-linear change of the unit-cell volumes. For the rhombohedral TIGS compounds, the unit-cell volumes are smaller than those of the quinary (GeTe)xAgIn0.5Sb0.5Te2 compounds. Yet, the shortest cation–tellurium bond lengths are slightly larger in the TIGS samples e.g. 2.8609(9) Å for (GeTe)12AgInTe2 and 2.8546(8) Å for (GeTe)12AgIn0.5Sb0.5Te2, which can be explained by a less pronounced tendency towards layered structures in TIGS.
Also note that the cations' z parameter value of (GeTe)7AgInTe2 does not lie between those of (GeTe)5.5AgInTe2 and (GeTe)12AgInTe2, which is probably related to the fact that (GeTe)5.5AgInTe2 and (GeTe)7AgInTe2 had to be synthesized under HP conditions, whereas (GeTe)12AgInTe2 was synthesized by quenching the sample after annealing it at 550 °C.
Electron microscopy and diffraction
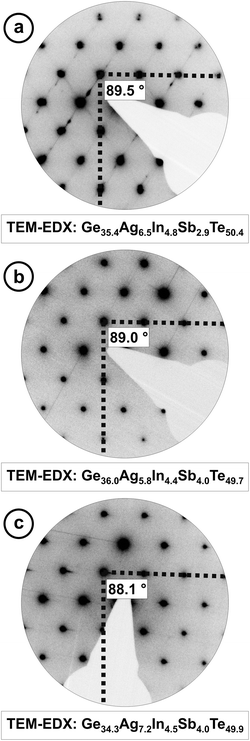
HRTEM and SAED were performed on (GeTe)5.5AgIn0.5Sb0.5Te2 and (GeTe)7AgIn0.5Sb0.5Te2 which were both synthesized by annealing the samples at 550 °C and subsequent quenching through a two phase region (cf. Thermal behavior section). The former's metrics are very close to cubic, and the latter's are clearly rhombohedral. Although the angle between the directions [012]* and [01![[4 with combining macron]](https://www.rsc.org/images/entities/char_0034_0304.gif) ]* (which correspond to cubic [110]* and [001]*, respectively) of (GeTe)5.5AgIn0.5Sb0.5Te2 is calculated as 89.7° from the structure model obtained by Rietveld refinement, the SAED patterns in Fig. 3 show more pronounced deviations from 90°. This may be due to local variations of the composition – possibly as a consequence of the fast quenching – or metric relaxation in the small crystallites investigated. In quenched bulk samples the domains may be strained and thus the metrics remain closer to those of the HT phase.
]* (which correspond to cubic [110]* and [001]*, respectively) of (GeTe)5.5AgIn0.5Sb0.5Te2 is calculated as 89.7° from the structure model obtained by Rietveld refinement, the SAED patterns in Fig. 3 show more pronounced deviations from 90°. This may be due to local variations of the composition – possibly as a consequence of the fast quenching – or metric relaxation in the small crystallites investigated. In quenched bulk samples the domains may be strained and thus the metrics remain closer to those of the HT phase.
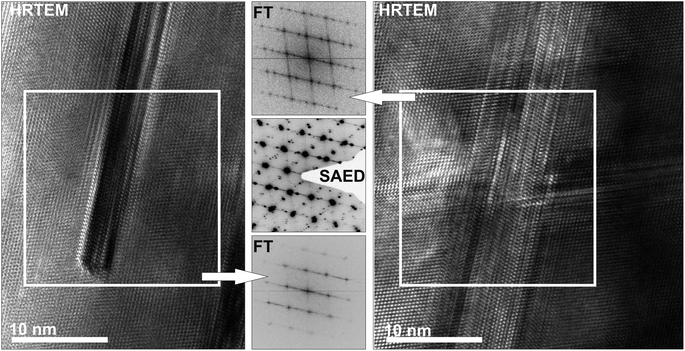
Although the samples appear homogeneous in PXRD patterns, the HRTEM images in Fig. 4 and 5 show two different kinds of precipitates. Both (GeTe)5.5AgIn0.5Sb0.5Te2 and (GeTe)7AgIn0.5Sb0.5Te2 contain Ag-rich precipitates (Fig. 4). These may consist of Ag2Te, which was observed as a side phase in AgSbTe2,36 or Ag7Te4,37 which might be an intermediate phase during the formation of Ag2Te. Both compounds exhibit d values (e.g. 6.8 Å, 3.4 Å) close to those observed in SAED patterns and Fourier transforms of HRTEM images. Fig. 5 shows In-rich precipitates in (GeTe)7AgIn0.5Sb0.5Te2 which most likely correspond to AgInTe2 which is also expected from the temperature-dependent phase equilibria (see below). However, only very few precipitates can be observed and they are too small to contribute significantly to the PXRD patterns. The formation of precipitates also causes slight deviations in the compositions of the matrix crystallites which might contribute to the deviating metrics observed in the SAED patterns in Fig. 3 as the most pronounced metric deviations occur next to the precipitates. In addition, characteristic dislocations and twinning have also been observed in these materials (cf. Fig. S1 in the ESI† and also weak additional maxima in Fig. 3a).
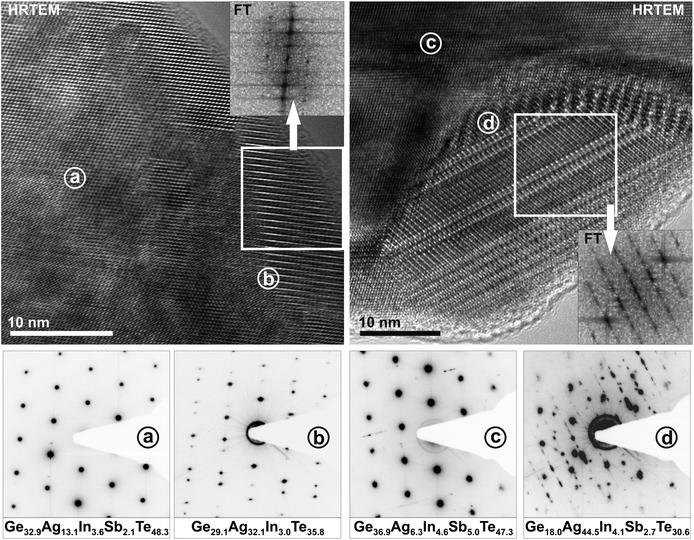 | ||
| Fig. 4 HRTEM images (zone axis 〈100〉 with respect to the rhombohedral matrices, top) of silver-rich precipitates in (GeTe)5.5AgIn0.5Sb0.5Te2 (left) and in (GeTe)7AgIn0.5Sb0.5Te2 (right) with corresponding Fourier transforms of the precipitates (insets) and SAED patterns (irradiated area: ca. 50–100 nm, bottom) with compositions (in atom%, from TEM-EDX, irradiated area: ca. 10–20 nm) of the matrix areas (a and c) and areas that contain the matrix and the precipitates (b and d; b also shows twinning of the matrix, see also Fig. S1 in the ESI†). | ||
Thermal behavior
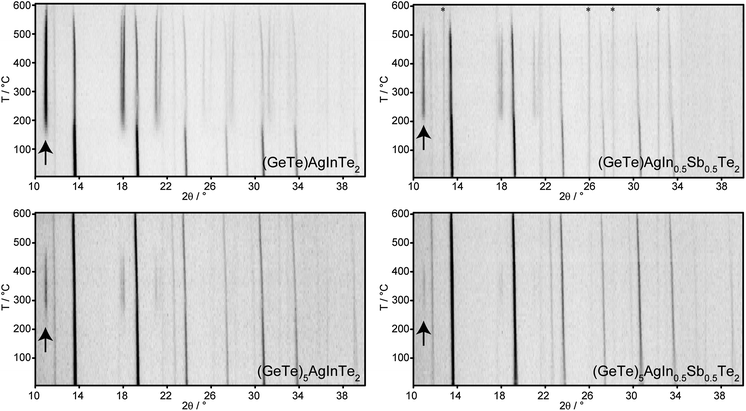
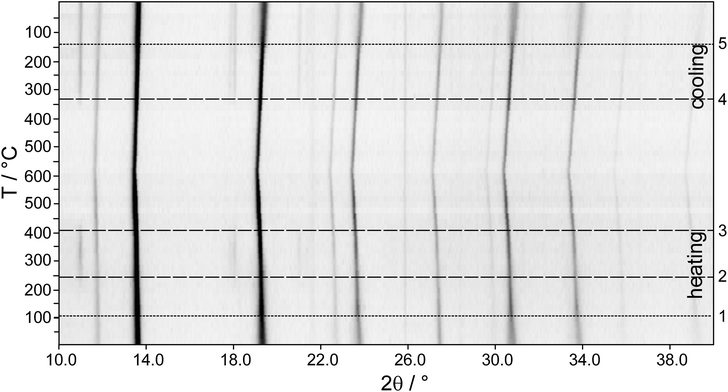
The fact that In-poor (GeTe)xAgInySb1−yTe2 compounds with x = 12 for y = 1 and x ≥ 5 for y = 0.5 can be synthesized without applying HP by annealing at 550 °C and subsequent quenching may be explained by the existence of thermodynamically stable, homogeneous HT phases. The PXRD patterns in Fig. 6 show the temperature-dependent phase transitions of four rocksalt-type samples during the heating process: (GeTe)AgInTe2, (GeTe)AgIn0.5Sb0.5Te2 and (GeTe)5AgInTe2, which were prepared under HP conditions, and (GeTe)5AgIn0.5Sb0.5Te2, which was prepared by quenching from 550 °C. Upon heating, the cubic phases decompose by forming chalcopyrite-type AgInTe2. Assuming complete decomposition as a reasonable approximation, the main phase is GeTe or (GeTe)2xAgSbTe2, respectively. However, these might be doped with small amounts of In. (GeTe)AgInTe2 decomposes into AgInTe2 and GeTe at ∼150 °C. No HT phase is formed, and both compounds melt at individual temperatures. For (GeTe)AgIn0.5Sb0.5Te2, the decomposition reaction into AgInTe2 and (GeTe)2AgSbTe2 starts at ∼200 °C. The intensity of the strongest reflection of AgInTe2 at ∼11° 2θ becomes weaker at around 520 °C, which might be attributed to melting or a reaction with (GeTe)2AgSbTe2, which however does not result in a homogeneous quinary HT phase. (GeTe)5AgInTe2 shows a similar decomposition reaction as (GeTe)AgInTe2 starting at ∼220 °C; however, a quaternary HT phase is formed at ∼480 °C and the reflections of AgInTe2 vanish completely. This re-reaction is also confirmed by the non-linear increase in the lattice parameter a of the rocksalt-type phase (best visible for the reflections at 31° and 34° 2θ). Although a HT phase exists at 550 °C, quenching it does not yield a homogeneous compound; AgInTe2 was always found as a side phase that made HP synthesis necessary as described above (section Sample characterization and optimal conditions for synthesis). Probably, the cooling rate is not sufficient to avoid the partial decomposition. As expected, (GeTe)5AgIn0.5Sb0.5Te2 decomposes into AgInTe2 and (GeTe)10AgSbTe2 at ∼240 °C. A quinary HT phase is formed which can be quenched to obtain a metastable sample which is homogeneous according to its PXRD pattern.Temperature dependent PXRD of (GeTe)5.5AgIn0.5Sb0.5Te2 (see Fig. 7, also concerning the numbering of the transitions) reveals that in addition to the decomposition, structural phase transitions of the trigonal compounds occur during heating and cooling. At ∼100 °C (1) the phase transition from trigonal (α-GeTe type) to cubic (rocksalt type) takes place in the quinary quenched compound. At ∼240 °C (2) the compound decomposes into AgInTe2 and – assuming complete decomposition – (GeTe)11AgSbTe2. The homogeneous HT phase begins to form at 400 °C (3), whereas upon slow cooling, the decomposition into AgInTe2 and (GeTe)11AgSbTe2 starts at ∼340 °C (4). The different temperatures for the formation and decomposition of the HT phase, respectively, probably reflect time and particle-size dependence. During heating (3), relatively large grains of AgInTe2 react with (GeTe)11AgSbTe2 while during cooling (4) AgInTe2 grains need to nucleate and grow, and the very broad reflections of nanoscale precipitates may not be visible in PXRD patterns. As discussed above, there may be very small amounts of other nanoscale precipitates that do not contribute to the PXRD patterns, especially when quenching leads through a two-phase region. While AgInTe2 remains present, the cubic to trigonal phase transition (5) of the main phase (GeTe)11AgSbTe2 takes place at ∼140 °C. The difference between the trigonal to cubic (1) and cubic to trigonal (5) phase transition temperatures is due to the change of the main phase's composition from (GeTe)5.5AgIn0.5Sb0.5Te2 to (GeTe)11AgSbTe2. Therefore, the phase transition temperatures increase and get closer to that of pure GeTe.38
High-temperature thermoelectric properties of (GeTe)5.5AgIn0.5Sb0.5Te2
The thermoelectric properties of (GeTe)5.5AgIn0.5Sb0.5Te2 (cf.Fig. 8), which was prepared by annealing at 550 °C (stability region of the quinary HT phase) and subsequent quenching can be understood by the temperature dependent PXRD pattern in Fig. 7. During heating, σ exhibits metallic characteristics and decreases from 1100 to 750 S cm−1; this is only slightly affected by the decomposition into chalcopyrite-type AgInTe2 and (GeTe)11AgSbTe2. However, for the quinary cubic HT phase σ increases again, probably because the interfaces caused by nanoscopic AgInTe2 precipitates (cf. section Electron microscopy and diffraction) vanish and thus do not scatter electrons anymore. Upon cooling, the characteristics of σ are parallel to the heating curve. The heating and cooling curves of κ are very similar. In the two-phase region the slope of κ is not as steep as that for lower and higher temperatures. However, this part of the κ curve should not be over-interpreted as the assumption of constant heat capacity (according to Dulong–Petit) may not be a good approximation during the decomposition reaction. S increases up to a maximum at ∼300 °C, i.e. in the two-phase area. For the quinary cubic HT phase, S decreases slightly with increasing temperature. Upon cooling, S is slightly larger than that at the same temperature during heating. This is a consequence of the above-mentioned reactions and phase transitions. In general, the characteristics of the thermoelectric properties nicely reflect the phase transitions observed in the temperature dependent PXRD pattern. The discussion of the maximal ZT should be restricted to the cooling curve below 350 °C. During heating and in the two-phase regions, the absolute values of the properties are not reliable (no well-defined heat capacity; see above) and there may be a pronounced time dependence due to reactions and nucleation processes. The highest ZT value of 0.75 at 300 °C can be observed close to the decomposition into AgInTe2 and (GeTe)11AgSbTe2. Low-temperature experiments are not promising, because the ZT value has already dropped to 0.35 at room temperature.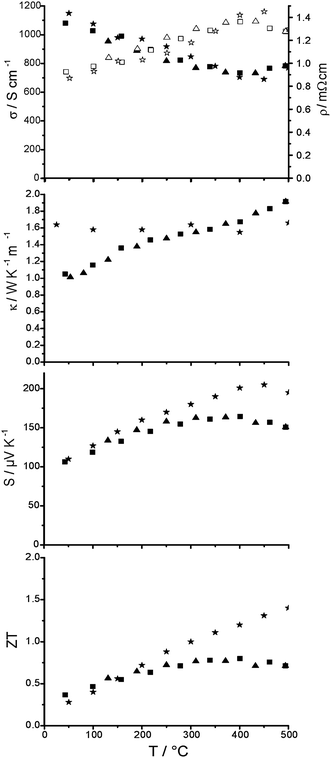 | ||
| Fig. 8 Thermoelectric properties of (GeTe)5.5AgIn0.5Sb0.5Te2 (heating curves: ■; cooling curves: ▲), from top to bottom: electrical conductivity and resistivity (solid and empty symbols, respectively), thermal conductivity, Seebeck coefficient and ZT value in comparison to values for TAGS-85 (asterisks) taken from ref. 19. | ||
Low-temperature thermoelectric properties of (GeTe)5.5AgInTe2
The thermoelectric properties of the TIGS sample (GeTe)5.5AgInTe2 (Fig. 9) were measured from RT down to 4 K and then up to 400 K, i.e. far below the decomposition temperature. The heating and cooling curves for all properties are almost similar within the experimental errors and do not indicate pronounced irreversible processes (the slight deviation between the κ values during cooling and heating sequences between 50 and 150 K is probably due to contact problems). The subtle hysteretic behavior between 40 and 300 K may be comparable to that observed in metastable modifications of GeBi2Te4 where the extent of the hysteresis could be correlated with the average domain size of the crystalline samples.39 The high residual resistivity of 1.015 mΩ cm together with the remarkably small residual resistivity ratio of RRR = ρ(300 K)/ρ(2 K) = 1.08 clearly confirms the presence of significant disorder in (GeTe)5.5AgInTe2. Furthermore, the sequential change of the sign of the slope, dρ/dT, supports the presence of a crossover-scenario between a degenerated semiconducting and a metallic-like behavior of (GeTe)5.5AgInTe2. This observation may be due to different scattering processes caused (i) by the temperature independent residual resistivity originating from electron-impurity scattering (impurity atoms, grain boundaries, etc.) and (ii) the temperature dependent contribution due to electron–phonon scattering. From 150 K to 400 K, σ(T) exhibits metallic-like characteristics and the absolute values between RT and 400 K are approximately in the same range as the corresponding ones of (GeTe)5.5AgIn0.5Sb0.5Te2. The absolute κ values of the TIGS sample are slightly larger compared with those of (GeTe)5.5AgIn0.5Sb0.5Te2 at room temperature. This hints at a less pronounced disorder in (GeTe)5.5AgInTe2vs. (GeTe)5.5AgIn0.5Sb0.5Te2. The increase of S is steeper for TIGS than for (GeTe)5.5AgIn0.5Sb0.5Te2 which compensates the higher κ and leads to a higher ZT value of 0.6 at 400 K.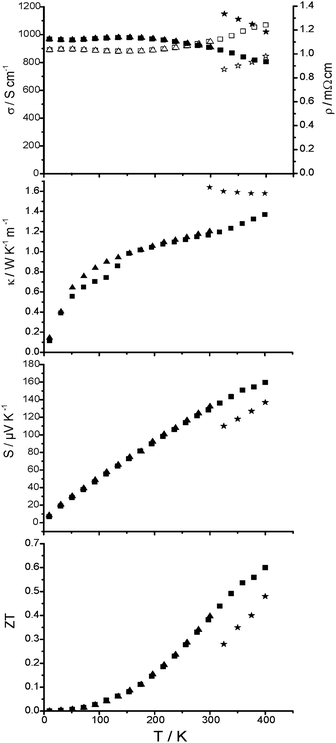 | ||
| Fig. 9 Thermoelectric properties of (GeTe)5.5AgInTe2 (heating curve: ■; cooling curve: ▲), from top to bottom: electrical conductivity and resistivity (solid and empty symbols, respectively), thermal conductivity, Seebeck coefficient and ZT value in comparison to values for TAGS-85 (asterisks) taken from ref. 19. | ||
Conclusion
Members of the solid solution series between GeTe and AgInTe2 or AgIn0.5Sb0.5Te2, respectively, crystallize in disordered rocksalt-type structures for GeTe contents 1 < x ≤ 5 and in disordered α-GeTe-type structures for 5 < x < 12. In such (GeTe)xAgInySb1−yTe2 phases, In is octahedrally coordinated by Te or exhibits a 3 + 3 coordination in a trigonal antiprismatic fashion, respectively, whereas in general, In prefers to be tetrahedrally coordinated by Te. Thus, the synthesis of homogeneous In-rich samples with more than 3.6 atom% In (i.e. x < 12 for y = 1 and x < 5 for y = 0.5) requires high-pressure conditions, because the octahedral coordination of In is energetically favored under HP conditions (pressure-coordination rule). Samples with an In content ≤3.6 atom% (i.e. x = 12 for y = 1 and x ≥ 5 for y = 0.5) do not require HP synthesis and can be obtained by quenching after annealing the samples at 550 °C. All (GeTe)xAgInySb1−yTe2 phases investigated decompose into chalcopyrite-type AgInTe2 and GeTe or (GeTe)2xAgSbTe2 for y = 1 or 0.5, respectively, upon heating at ambient pressure. The decomposition temperature depends on the In content and is higher for samples with lower In contents. However, the cubic HT phases of GeTe or (GeTe)2xAgSbTe2 react with small amounts of AgInTe2. At high temperature, solid solutions are favored by entropy as indicated by the observation of rocksalt-type HT phases for In contents up to 7–8 atom% at temperatures above ∼450 °C (the exact temperature depends on the In content). Although no side phase can be observed in the PXRD patterns, quenching leads to nanoscopic precipitates of AgInTe2 and Ag-rich domains. Thus, the applied quenching rates cannot completely suppress the nucleation of AgInTe2 during the decomposition reaction. (GeTe)5.5AgIn0.5Sb0.5Te2 quenched from the rocksalt-type HT phase exhibits a maximum ZT value of 0.75 at 300 °C close to the decomposition into AgInTe2 and (GeTe)11AgSbTe2 but only 0.5 at 125 °C where (GeTe)5.5AgInTe2 prepared under HP conditions exhibits ZT = 0.6. As expected the latter's κ is slightly higher than that of the quinary compound, but this is outbalanced by the higher Seebeck coefficient. TIGS's ZT value is higher than that of the corresponding TAGS-8519 in the investigated temperature range.Both the (GeTe)xAgIn0.5Sb0.5Te2 as well as the TIGS samples show promising new ways towards high-performance thermoelectric materials. While TIGS compounds prepared under high-pressure conditions exhibit remarkable ZT values close to RT and up to 125 °C, both the more pronounced disorder and the decomposition of (GeTe)5.5AgIn0.5Sb0.5Te2 might provide possible control parameters to decrease the thermal conductivity without significantly affecting the electrical conductivity.
Acknowledgements
We thank Christian Minke and Dr Markus Seibald for SEM operation and EDX analyses and Thomas Miller (LMU Munich) for the temperature-dependent powder diffraction experiments. Furthermore, we thank Fivos Drymiotis (California Institute of Technology) for help with the thermoelectric measurements and PD Dr Gerald Wagner (Leipzig University) for his help with the HRTEM interpretation. This investigation was funded by the Deutsche Forschungsgemeinschaft (grant OE530/1-2) and the Studienstiftung des deutschen Volkes (scholarship for T.S.).References
- H. Hahn, G. Frank, W. Klingler, A. D. Meyer and G. Störger, Z. Anorg. Allg. Chem., 1953, 271, 153 CrossRef CAS.
- K. J. Range, G. Engert and A. Weiss, Solid State Commun., 1969, 7, 1749 CrossRef CAS.
- T. Schröder, T. Rosenthal, D. Souchay, C. Petermayer, S. Grott, E.-W. Scheidt, C. Gold, W. Scherer and O. Oeckler, J. Solid State Chem., 2013, 206, 20 CrossRef PubMed.
- H. J. Goldsmid, Thermoelectric Refrigeration, Plenum Press, New York, 1964 Search PubMed.
- D. T. Morelli, V. Jovovic and J. P. Heremans, Phys. Rev. Lett., 2008, 101, 035901 CrossRef CAS.
- M. D. Nielsen, V. Ozolins and J. P. Heremans, Energy Environ. Sci., 2013, 6, 570 CAS.
- W. G. Zeier, Y. Z. Pei, G. Pomrehn, T. Day, N. Heinz, C. P. Heinrich, G. J. Snyder and W. Tremel, J. Am. Chem. Soc., 2013, 135, 726 CrossRef CAS PubMed.
- A. Yusufu, K. Kurosaki, Y. Ohishi, H. Muta and S. Yamanaka, Jpn. J. Appl. Phys., 2013, 52, 081801 CrossRef.
- T. Plirdpring, K. Kurosaki, A. Kosuaga, T. Day, S. Firdosy, V. Ravi, G. J. Snyder, A. Harnwunggmoung, T. Sugahara, Y. Ohishi, H. Muta and S. Yamanaka, Adv. Mater., 2012, 24, 3622 CrossRef CAS PubMed.
- R. Liu, L. Xi, H. Liu, X. Shi, W. Zhang and L. Chen, Chem. Commun., 2012, 48, 3818 RSC.
- C. Wood, Rep. Prog. Phys., 1988, 51, 459 CrossRef CAS.
- W. Klemm and G. Frischmuth, Z. Anorg. Allg. Chem., 1934, 218, 249 CrossRef CAS.
- J. Goldak, C. S. Barrett, D. Innes and W. Youdelis, J. Chem. Phys., 1966, 44, 3323 CrossRef CAS PubMed.
- B. A. Cook, M. J. Kramer, X. Wei, J. L. Harringa and E. M. Levin, J. Appl. Phys., 2007, 101, 053715 CrossRef PubMed.
- S. K. Plachkova, Phys. Status Solidi A, 1984, 83, 349 CrossRef CAS.
- S. H. Yang, T. J. Zhu, T. Sun, S. N. Zhang, X. B. Zhao and J. He, Nanotechnology, 2008, 19, 245707 CrossRef CAS PubMed.
- F. D. Rosi, J. P. Dismukes and E. F. Hockings, Electr. Eng., 1960, 79, 450 CrossRef.
- G. C. Christakudis, S. K. Plachkova, L. E. Shelimova and E. S. Avilov, Phys. Status Solidi A, 1991, 128, 465 CrossRef CAS.
- J. Davidow and Y. Gelbstein, J. Electron. Mater., 2013, 42, 1542 CrossRef CAS.
- X. Shi, J. R. Salvador, J. Yang and H. Wang, Sci. Adv. Mater., 2011, 3, 667 CrossRef CAS PubMed.
- E. M. Levin, B. A. Cook, J. L. Harringa, S. L. Bud'ko, R. Venkatasubramanian and K. Schmidt-Rohr, Adv. Funct. Mater., 2011, 21, 441 CrossRef CAS.
- E. M. Levin, S. L. Bud'ko and K. Schmidt-Rohr, Adv. Funct. Mater., 2012, 22, 2766 CrossRef CAS.
- D. Walker, M. A. Carpenter and C. M. Hitch, Am. Mineral., 1990, 75, 1020 Search PubMed.
- D. Walker, Am. Mineral., 1991, 76, 1092 Search PubMed.
- D. C. Rubie, Phase Transitions, 1999, 68, 431 CrossRef CAS.
- H. Huppertz, Z. Naturforsch., B: J. Chem. Sci., 2001, 56, 697 CAS.
- WINXPOW, v2.12 ed, Stoe & Cie GmbH, Darmstadt, Germany, 2005 Search PubMed.
- TOPAS-Academic, V. 4.1, Coelho Software, Brisbane, Australia, 2007 Search PubMed.
- DigitalMicrograph 3.6.1, Gatan Software, Pleasanton, USA, 1999 Search PubMed.
- P. A. Stadelmann, Ultramicroscopy, 1987, 21, 131 CrossRef CAS.
- ES Vision, 4.0.164, Emispec Systems Inc., Tempe, USA, 1994–2002 Search PubMed.
- L. J. van der Pauw, Philips Res. Rep., 1958, 13, 1 Search PubMed.
- K. A. Borup, E. S. Toberer, L. D. Zoltan, G. Nakatsukasa, M. Errico, J. P. Fleurial, B. B. Iversen and G. J. Snyder, Rev. Sci. Instrum., 2012, 83, 123902 CrossRef PubMed.
- S. Iwanaga, E. S. Toberer, A. LaLonde and G. J. Snyder, Rev. Sci. Instrum., 2011, 82, 063905 CrossRef PubMed.
- A. LeBail and A. Jouanneaux, J. Appl. Crystallogr., 1997, 30, 265 CrossRef CAS.
- R. Marin-Ayral, B. Lendre, G. Brun, B. Liautard and J. Tedenac, Thermochim. Acta, 1988, 131, 37 CrossRef CAS.
- R. M. Imamov and Z. G. Pinsker, Sov. Phys. Crystallogr., 1966, 11, 182 Search PubMed.
- T. Chattopadhyay, J. Boucherle and H. von Schnering, J. Phys. C: Solid State Phys., 1987, 20, 1431 CrossRef CAS.
- T. Schröder, M. N. Schneider, T. Rosenthal, A. Eisele, C. Gold, E.-W. Scheidt, W. Scherer, R. Berthold and O. Oeckler, Phys. Rev. B: Condens. Matter Mater. Phys., 2011, 84, 184104 CrossRef.
Footnote |
| † Electronic supplementary information (ESI) available: Compositions determined by SEM-EDX in Tables S1 and S2 and HRTEM images with the corresponding SAED patterns of (GeTe)5.5AgIn0.5Sb0.5Te2 and (GeTe)7AgIn0.5Sb0.5Te2 showing dislocations and twinning in Fig. S1. Further details of the crystal structure investigation are provided in the cif files. See DOI: 10.1039/c4ta00072b |
| This journal is © The Royal Society of Chemistry 2014 |


