Electrochemical Hg2+ detection at tannic acid-gold nanoparticle modified electrodes by square wave voltammetry†
Alex L.
Suherman
 a,
Sabine
Kuss
a,
Eden E. L.
Tanner‡
a,
Sabine
Kuss
a,
Eden E. L.
Tanner‡
 a,
Neil P.
Young
b and
Richard G.
Compton
 *a
*a
aDepartment of Chemistry, Physical and Theoretical Chemistry Laboratory, Oxford University, South Parks Road, Oxford OX1 3QZ, UK. E-mail: richard.compton@chem.ox.ac.uk; Fax: +44 (0)1865 275410; Tel: +44 (0)1865 275957
bDepartment of Materials, Oxford University, Parks Road, OX1 3PH, UK
First published on 7th April 2018
Abstract
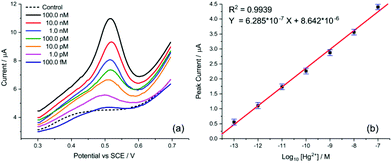
We report the electrochemical sensing of Hg2+ based on tannic acid capped gold nanoparticle (AuNP@TA) complexes. At optimal conditions using square wave voltammetry, the presented analytical method exhibits a “measurable lower limit” of 100.0 fM. This limit is considerably below the permissible level of 30.0 nM for inorganic mercury in drinking water, specified by the World Health Organization (WHO). The effect of potentially interfering ions, such as Zn2+ and Al3+, was studied and results indicate an excellent selectivity for Hg2+. The transfer of the proposed strategy onto AuNP@TA modified screen-printed electrodes demonstrates its applicability to routine monitoring of Hg2+ in tap water.
Introduction
The World Health Organisation (WHO) has declared mercury as one of the most toxic heavy metals to human health.1 Inorganic mercury (Hg2+) accumulates in the vital tissues and organs, interfering with proteins and enzymes,2 which can result in cellular dysfunctions and health issues, such as learning and memory impairments, as well as Alzheimer's disease.3–5 In addition, individuals with congenital mercury toxicity are especially vulnerable to environmental mercury contaminations and may show severe mental retardation6 and neurological abnormalities,7 as well as profound immunological and embryonic toxicological effects.8 Therefore, the exposure to inorganic Hg2+ by the consumption of contaminated drinking water has become a global concern and a maximum permissible level of Hg2+ in drinking water of 6.0 μg L−1 was declared by the WHO, which corresponds to an approximate concentration of 30.0 nM.1The above-mentioned risks associated with inorganic Hg2+ in drinking water require sensitive and selective detection and monitoring strategies to assure public health. To date, various analytical methods have been developed for the detection of trace and/or ultra-trace levels of Hg2+, such as gas chromatography-inductively coupled plasma analysis (GC-ICPMS),9 atomic absorption spectrometry10 and UV-Vis spectrophotometry,11 as well as voltammetric techniques.12,13 Voltammetry has been widely accepted for the detection of metals, such as Hg2+, because of its excellent sensitivity, straightforward procedure, low cost, and its suitability for in situ applications. However, particular aspects, such as a reasonable time scale of analysis, electrode modifications and selectivity need to be thoroughly assessed,13 whereby straightforward and easy to implement electrode pre-treatment procedures have become desirable if not imperative. Electrode modifications using gold nanoparticles (AuNP) are commonly carried out for voltammetry.14,15 AuNP are easy to synthesise, highly conductive, and increase the electrode surface area, making AuNPs an excellent choice in sensing applications. Employing AuNPs in combination with chemically selective capping agents, aggregation/agglomeration effects16,17 can be minimised and selectivity of the modified electrode towards Hg2+ improved.
In this work, tannic acid (C76H52O46, TA) is employed both as a stabilising agent for AuNPs and as a selective capping agent for Hg2+. TA is found in plant tissues, such as leaves, gallnuts, and pods of certain plants,18 where it exhibits various structures, molecular masses, and physicochemical and biological properties.19,20 In addition, TA molecules contains a large number of reactive functional groups, such as hydroxyl and phenolic hydroxyl groups, which can form complexes with heavy metal ions, such as Hg2+.19,21 As an example, Luo et al.22 have used TA modified Fe3O4 core–shell nanoparticles for the adsorption and detection of Hg2+ from contaminated water, and we have recently shown that the combination of AuNP and TA results in the sensitive detection of Al3+ in aqueous solutions with a “measurable lower limit” of 10.0 pM.23 Furthermore, in biological related voltammetry applications, TA has been used as an electrode surface modifier for the detection of dopamine,24 glucose,25 bisphenol A26 and epinephrine.27 The role of TA appears to be either as a dopant,24 as a biocompatible host for an enzyme25 or the target,26 or alternatively “electron mediation”27 with TA is suggested. Despite apparent success in various applications, voltammetric strategies in connection with TA for the detection of inorganic Hg2+ have not been reported in literature.
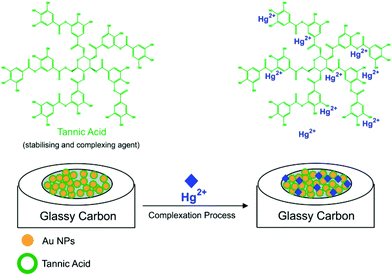
In this work, we report the electrochemical detection of inorganic Hg2+ in aqueous solutions at a tannic acid-capped gold nanoparticle modified glassy carbon macroelectrode (AuNP@TA-GCE) by square wave voltammetry (SWV) (Scheme 1). The influence of coexisting ions on the detection of Hg2+ is investigated and Hg2+-spiked tap water samples analysed. The developed sensing strategy is then transferred onto disposable AuNP@TA modified screen-printed electrodes (AuNP@TA-SPE), demonstrating the ability to detect Hg2+ in drinking water with a “measurable lower limit” of 100.0 fM, showing distinct signals above background, as well as making it accessible for routine monitoring applications.
Experimental
Chemicals
Mercury solutions were prepared from a 0.05 M mercury(II) nitrate (Hg(NO3)2, Sigma-Aldrich, Fluka Analytical, Steinheim, Germany) stock solution. For studies of interfering ions, zinc nitrate hexahydrate (Zn(NO3)2, >98%, Sigma-Aldrich, Steinheim, Germany) and aluminium sulphate (Al2(SO4)3·16H2O, >97%, Alfa Aesar, Karlsruhe, Germany) were used as sources of Zn2+ and Al3+. Tannic acid-capped gold nanoparticles (AuNP@TA, 2.2 × 10¹⁰ particles per mL, NanoComposix, San Diego, USA), with a hydrodynamic diameter of 68.4 nm as indicated by the manufacturer, were used as received. Analyte solutions were prepared in a HCl–KCl solution (pH 1.0) by mixing 97.0 mL of 0.1 M HCl and 3.0 mL of 0.1 M KCl.28 Nanopure water with a resistivity not less than 18.2 MΩ cm at 25 °C (Millipore water purification system, Millipak Express 20, Watford, UK), was used to prepare HCl and KCl solutions and to rinse electrodes during polishing. A high purity nitrogen flow (oxygen free, BOC Gases Plc) was used to degas analyte solutions prior to the electrochemical measurements.Electrochemical apparatus
All electrochemical measurements were performed inside a Faraday cage (25 ± 1 °C) using a μAutolab Type III potentiostat (Metrohm u3AUT71335, Autolab B.V., Utrecht, The Netherlands). The potentiostat was interfaced to Windows PC with GPES software (version 4.9) for data acquisition. The utilised three electrode system consisted of a 1.48 ± 0.02 mm radius glassy carbon working electrode (CH Instruments, Inc., USA, GCE, size determined by optical microscopy), a saturated calomel reference electrode (SCE, Hg/Hg2Cl2, saturated KCl) and a 0.5 mm diameter platinum wire (Goodfellow Cambridge Ltd, UK), functioning as a counter electrode. Working electrodes were polished using a diamond spray of sizes 3, 1 and 0.1 micron (Kemet, Kent, UK) on soft microcloth polishing pads for approximately 3 minutes on each grade, rinsed in between with nanopure water. GCEs were modified by drop casting 25.8 μL of AuNP@TA suspension, which approximately corresponds to a surface concentration of one-monolayer (Calculation ESI 1†). The suspension was let to dry under nitrogen flow.AuNP@TA characterisation
The size and aggregation/agglomeration characterisation of the AuNP@TA was carried out as described previously.23Real sample analysis
The water sample used in this work was collected from the laboratory water tap. The collected tap water was spiked with various concentrations of Hg2+. The influence of interfering metal ions was investigated using mixtures of tap water solutions containing Zn2+ and/or Al3+ at different concentrations.The transfer of the established method to disposable screen-printed electrodes was realized using DropSens screen-printed carbon electrodes (DRP-110, DropSens, Llanera, Spain, SPEs), with a built-in carbon (4.0 mm diameter) working electrode, carbon counter electrode and silver reference electrode – all printed on a L33 × W10 × H0.5 mm ceramic substrate. SPEs were modified by drop casting 25.8 μL of AuNP@TA suspension and dried under N2 flow. A 50.0 μL of sample solution was deposited onto the SPE surface, covering all three electrodes. Each sample was analysed in triplicate under optimised experimental conditions as discussed in the main text.
Results and discussion
In this section, we first discuss the electrochemical detection of inorganic mercury using cyclic voltammetry. The characterisation of AuNP@TA-GCEs in the absence and presence of Hg2+ at different scan rates, surface coverages and at various exposure times leads to the determination of a “measurable lower limit” for Hg2+. The selectivity performance of the AuNP@TA-GCEs system towards possible interfering ions is discussed, before evaluating the detection of mercury using square wave voltammetry. As a proof of concept, we demonstrate the application of the established sensing strategy to screen-printed electrodes and real sample analysis.Mercury detection by cyclic voltammetry
Before assessing the oxidation behaviour of Hg2+ at AuNP@TA-GCEs, an unmodified glassy carbon electrode (GCE) was immersed in a solution of HCl–KCl (pH 1.0), containing 2.0 mM Hg2+ and CV was performed by sweeping the potential from 0.3 V to 0.7 V vs. SCE. No electrochemical current signal related to Hg2+ was observed (Fig. 1, black-solid curve), demonstrating the necessity for the proposed electrode modifications. To obtain fully functionalized AuNP@TA-GCEs sensors, AuNP@TA were drop casted onto a GCE surface at a concentration of about 5.7 × 10⁸ nanoparticles, corresponding to a surface concentration of approximately one-monolayer. The AuNP@TA-GCE was immersed in a solution of HCl–KCl (pH 1.0), containing 2.0 mM Hg2+, whereby cyclic voltammograms (Fig. 1, red-solid curve) reveal two oxidation peaks at potentials of 0.40 V and 0.58 V vs. SCE, respectively. The first oxidation peak (“peak-1”) is attributed to the oxidation of TA23,29 and the second peak (“peak-2”) is attributed to the AuNP@TA-Hg complex. Both peaks are increased as the capping agent layer swells and reflect the oxidation of phenolic or quinone groups in the TA.
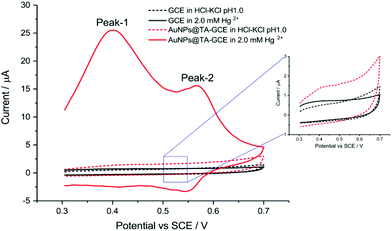 | ||
| Fig. 1 Detection of Hg2+ at an unmodified GCE, as well as at a functionalized AuNP@TA-GCE at a scan rate of 0.1 V s−1. | ||
The effect of scan rate was studied. A AuNP@TA-GCE was immersed into a 2.0 mM Hg2+ solution and CVs were recorded at scan rates of up to 0.12 V s−1. As shown in Fig. S2a,† peak currents of both peak-1 and peak-2 increased monotonically with scan rate. The linear dependence of the peak currents of peak-1 and peak-2 on the scan rate (Fig. S2b†) suggests that both the oxidation process of TA and the AuNP@TA-Hg systems are surface-controlled (adsorption) processes. In addition, peak-1 substantially increases in the presence of Hg2+, suggesting that the partial complexation of TA leads to a greater accessibility of the TA layers. The peak potential positions of peak-2 at 0.58 V vs. SCE were found to be independent of the scan rate, indicating a reversible electrochemical process for the oxidation of the AuNP@TA-Hg system. For further analytical measurements, a scan rate of 0.1 V s−1 was selected.
Next, the effect of the electrode surface coverage (surface concentration) of AuNP@TA on the Hg2+ uptake was studied. Coverages between 0.1 and 1.5-monolayers of AuNP@TA were evaluated, crudely estimating a close packing of 91% (Fig. S3a†).30 All modified AuNP@TA-GCE with specific surface coverages were exposed to 2.0 mM Hg2+ in HCl–KCl (pH 1.0). As shown in Fig. S3b,† electrochemical peak currents of peak-1 and peak-2 enhanced monotonically with increasing AuNP@TA concentrations at the GCE surface. This is attributed to the greater number of accessible complexation sites of the AuNP@TA-GCE system. However, considering the cost of AuNP@TA, a surface coverage of one-monolayer was found to be sufficient for good analytical performance and thus was selected for further experiments.
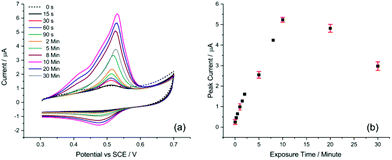
One of the key aspects for achieving sufficient sensitivity and thus lowering the detection limit is the exposure time of the AuNP@TA-GCE system to Hg2+ ions in solution before voltammetric measurements. To evaluate this effect, a AuNP@TA-GCE was exposed to 1.0 μM Hg2+ in HCl–KCl (pH 1.0) at varying exposure times between zero to 30 minutes. As shown in Fig. 2, the peak current of peak-2 increased up to an exposure time of 10 min and significantly decreased at lengthier incubation. This effect can be attributed to the swelling of TA, which reaches its maximum at 10 min when the effective electrode surface becomes saturated with Hg2+. This suggests that with a practical exposure time of 10 min good sensitivity of the AuNP@TA-GCE system towards the detection of Hg2+ by CV can be achieved.
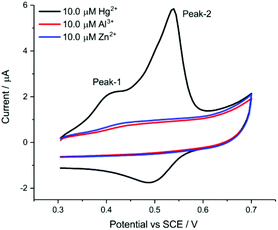 | ||
| Fig. 4 Selectivity performance of the AuNP@TA-GCE for Al3+ and Zn2+ at a scan rate of 0.1 V s−1 and exposure time of 10 min. | ||
We note that the start potential during the CV (and also for the SWV) sweeps being recorded plays a very important role to enable selectivity of sensing performance to Hg2+. A suitable start potential of 0.3 V vs. SCE allows the elimination of possible interference from Al3+.
The proposed Hg2+ detection strategy, based on AuNP@TA-GCE as described above, has shown the capability to selectively detect low concentrations of inorganic Hg2+ in aqueous solutions by CV. In the following, we discuss the possibility of avoiding exposure time as high as 10 min by conducting square wave voltammetry (SWV), which offers a reliable and more sensitive detection of Hg2+ for the routine monitoring and assessment of real samples.
Mercury detection by square wave voltammetry
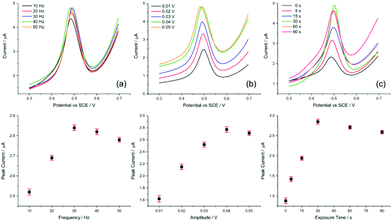 | ||
| Fig. 5 Parameter optimisation for SWV. Evaluating (a) frequency, (b) amplitude, and (c) exposure time for the AuNP@TA-GCE system in HCl–KCl (pH 1.0), containing 1.0 nM Hg2+. | ||
Having defined the optimum conditions of SWV, the selectivity and sensitivity of the sensor is evaluated in the following section.
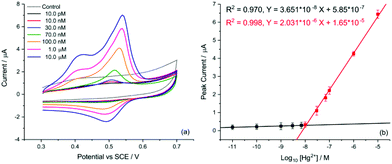
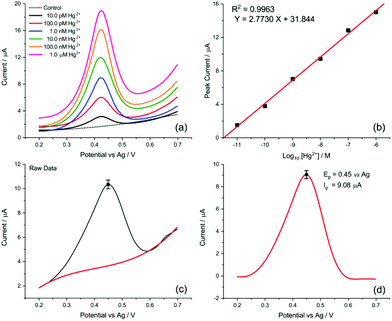
Finally, the transfer of this strategy onto disposable screen-printed electrodes (SPEs) may facilitate the utilization of the demonstrated analytical method in portable devices for routine monitoring. Bare carbon SPEs were modified by drop casting AuNP@TA at an approximate surface concentration of one-monolayer (assuming the particles are uniformly dispersed on the SPE surface). Cyclic voltammetry was conducted to assess whether the oxidation of the AuNP@TA system in the absence of Hg2+ is a surface-controlled or diffusion-controlled process. The modified AuNP@TA-SPE was immersed into HCl–KCl (pH 1.0) and CV measurements were carried out at scan rates from 10 to 125 mV s−1. As shown in Fig. S7b,† a linear dependence of the peak current on the scan rate was observed, suggesting a surface-controlled process. Furthermore, the peak potential positions at roughly 0.04 V vs. Ag were found to be independent of the scan rate, indicating an electrochemically reversible process. To detect Hg2+ at AuNP@TA-SPEs and to establish a calibration curve, functionalized sensors were immersed in HCl–KCl (pH 1.0), containing various Hg2+ concentrations ranging from 10.0 pM to 1.0 μM (Fig. 7a). As shown in Fig. 7b, a linear dependence of the peak current as a function of log10 of Hg2+ concentrations was observed, whereby a relative standard error of 26% for the determination of Hg2+ concentration from the calibration curve was calculated (see ESI† for details). This error value highlights the excellent sensitivity of the proposed sensing principle, as concentrations of roughly one order of magnitude below the critical limit of 30.0 nM, defined by the WHO, can be distinguished with statistical significance. Therefore, the relationship of the peak current as a function of log10 of Hg2+ concentrations can further be used to determine possible Hg2+ contamination in tap water.
The detection of inorganic Hg2+ in tap water using AuNP@TA-SPEs was conducted by exposing the sensor to tap water, spiked with 10.0 nM Hg2+. SWV was performed in triplicates and experimental parameters were selected in accordance with optimisation procedures outlined above. As shown in Fig. 7c, a clear electrochemical oxidation peak current can be seen at a potential of 0.45 V vs. Ag, with an average peak current value of 9.08 ± 0.17 μA. According to the linear calibration function (Fig. 7b), this current value corresponds to an Hg2+ concentration in solution with an average of 9.27 nM, close to the theoretical value of 10.0 nM, showing a recovery above 90%.
Conclusions
The presented work demonstrates an effective analytical method for the sensitive and selective electrochemical detection of inorganic Hg2+ in aqueous solutions, based on tannic acid capped gold nanoparticles at carbon electrodes. This strategy allows the quantitative analysis of Hg2+ in real samples, such as tap water. We have characterized the electrochemical sensing parameters for cyclic voltammetry and square wave voltammetry and excluded signal contributions from possibly interfering Al3+ and Zn2+ ions. This strategy for the detection of trace and/or ultra-trace levels of inorganic Hg2+ in aqueous solutions exhibits a “measurable lower limit” of 100.0 fM. The transfer of the analytical method onto screen-printed electrodes makes it suitable for the routine monitoring of inorganic Hg2+ in drinking water, as it meets the critical threshold value of 30.0 nM, set by the WHO.Conflicts of interest
There are no conflicts to declare.Acknowledgements
A. L. S. thanks the Indonesia government through Indonesia Endowment Fund Scholarships (S-3453/LPDP.3/2016) for funding. S. K. thanks the support from the European Commission under the Marie Curie Programme (grant number 702009). The contents reflect only the authors’ views and not the views of the European Commission. Technical contributions to Scanning Electron Microscopy (SEM) imaging by Ms Jennifer Holter and Dr Stanislav V. Sokolov are also acknowledged.References
- WHO, Guidelines for drinking-water quality: Fourth edition incorporating the first addendum, 2017 Search PubMed.
- Y. Li, B. He, L. Hu, X. Huang, Z. Yun, R. Liu, Q. Zhou and G. Jiang, Talanta, 2018, 178, 811–817 CrossRef CAS PubMed.
- P. Chakraborty, Sci. Total Environ., 2017, 589, 232–235 CrossRef CAS PubMed.
- A. T. Khan, A. Atkinson, T. C. Graham, S. J. Thompson, S. Ali and K. F. Shireen, Toxicology, 2004, 42, 571–577 CAS.
- G. Bjørklund, M. Dadar, J. Mutter and J. Aaseth, Environ. Res., 2017, 159, 545–554 CrossRef PubMed.
- Y. Liu, S. McDermott, A. Lawson and C. Marjorie Aelion, Int. J. Hyg. Environ. Health, 2010, 213, 116–123 CrossRef CAS PubMed.
- D. Peplow and S. Augustine, Environ. Sci.: Processes Impacts, 2014, 16, 2415–2422 CAS.
- K. M. Rice, E. M. Walker, M. Wu, C. Gillette and E. R. Blough, J. Prev. Med. Public Health, 2014, 47, 74–83 CrossRef PubMed.
- J. Hu, E. Pagliano, X. Hou, C. Zheng, L. Yang and Z. Mester, J. Anal. At. Spectrom., 2017, 32, 447–2454 Search PubMed.
- M. Senila, E. Covaci, O. Cadar, M. Ponta, M. Frentiu and T. Frentiu, Chem. Pap., 2018, 72, 441–448 CrossRef CAS.
- E. Ghasemi and M. Kaykhaii, Eurasian J. Anal. Chem., 2017, 12(4), 313–324 CrossRef.
- D. Martín-Yerga and A. Costa-García, Curr. Opin. Electrochem., 2017, 3, 91–96 CrossRef.
- A. L. Suherman, E. E. L. Tanner and R. G. Compton, TrAC, Trends Anal. Chem., 2017, 94, 161–172 CrossRef CAS.
- K. Saha, S. S. Agasti, C. Kim, X. Li and V. M. Rotello, Chem. Rev., 2012, 112, 2739–2779 CrossRef CAS PubMed.
- S. Zeng, K.-T. Yong, I. Roy, X.-Q. Dinh, X. Yu and F. Luan, Plasmonics, 2011, 6, 491–506 CrossRef CAS.
- K. Ngamchuea, K. Tschulik, S. Eloul and R. G. Compton, ChemPhysChem, 2015, 16, 2338–2347 CrossRef CAS PubMed.
- S. V. Sokolov, K. Tschulik, C. Batchelor-McAuley, K. Jurkschat and R. G. Compton, Anal. Chem., 2015, 87, 10033–10039 CrossRef CAS PubMed.
- J. Wang, C. Zheng, S. Ding, H. Ma and Y. Ji, Desalination, 2011, 273, 285–291 CrossRef CAS.
- M. A. Rahim, H. Ejima, K. L. Cho, K. Kempe, M. Müllner, J. P. Best and F. Caruso, Chem. Mater., 2014, 26, 1645–1653 CrossRef CAS.
- B. H. Cruz, J. M. Díaz-Cruz, C. Ariño and M. Esteban, Electroanalysis, 2000, 12, 1130–1137 CrossRef CAS.
- L. Fan, Y. Ma, Y. Su, R. Zhang, Y. Liu, Q. Zhang and Z. Jiang, RSC Adv., 2015, 5, 107777–107784 RSC.
- H. Luo, S. Zhang, X. Li, X. Liu, Q. Xu, J. Liu and Z. Wang, J. Taiwan Inst. Chem. Eng., 2017, 72, 163–170 CAS.
- A. L. Suherman, E. E. L. Tanner, S. Kuss, S. V. Sokolov, J. Holter, N. P. Young and R. G. Compton, Sens. Actuators, B, 2018, 265, 682–690 CrossRef CAS.
- L. Jiang, Q. Xie, Z. Li, Y. Li and S. Yao, Sensors, 2005, 5, 199–208 CrossRef CAS.
- B. Çakiroğlu and M. Özacar, Electroanalysis, 2017, 29, 1–9 CrossRef.
- K. Rajar, R. A. Soomro, Z. H. Ibupoto, Sirajuddin and A. Balouch, Int. J. Food Prop., 2017, 20, 1359–1367 CrossRef CAS.
- J. G. Manjunatha, B. E. Kumara Swamy, G. P. Mamatha, O. Gilbert, B. N. Chandrashekar and B. S. Sherigara, Int. J. Electrochem. Sci., 2010, 5, 1236–1245 CAS.
- C. Mohan, A guide for the preparation and use of buffers in biological systems, Calbiochem, 2003, 18–21 Search PubMed.
- D. L. Vu, B. Ertek, Y. Dılgın and L. Červenka, Czech J. Food Sci., 2015, 33, 72–76 CrossRef CAS.
- E. Kätelhön, W. Cheng, C. Batchelor-McAuley, K. Tschulik and R. G. Compton, ChemElectroChem, 2014, 1, 1057–1062 CrossRef.
- A. Shah, S. Sultan, A. Zahid, S. Aftab, J. Nisar, S. Nayab, R. Qureshi, G. S. Khan, H. Hussain and S. A. Ozkan, Electrochim. Acta, 2017, 258, 1397–1403 CrossRef CAS.
- E. Granado, E. Gervais, G. Gotti, S. Desclaux, M. Meireles, P. Gros and D. Evrard, Int. J. Electrochem. Sci., 2017, 12, 6092–6107 CrossRef CAS.
- H. L. Nguyen, H. H. Cao, D. T. Nguyen and V.-A. Nguyen, Electroanalysis, 2017, 29, 595–601 CrossRef CAS.
- K. Asadpour-Zeynali and R. Amini, Sens. Actuators, B, 2017, 246, 961–968 CrossRef CAS.
- M. P. N. Bui, J. Brockgreitens, S. Ahmed and A. Abbas, Biosens. Bioelectron., 2016, 85, 280–286 CrossRef CAS PubMed.
Footnotes |
| † Electronic supplementary information (ESI) available. See DOI: 10.1039/c8an00508g |
| ‡ Now at the school of Engineering and Applied Sciences, Harvard University, Cambridge, MA, USA. |
| This journal is © The Royal Society of Chemistry 2018 |

