 Open Access Article
Creative Commons Attribution 3.0 Unported Licence
Order in disorder: solution and solid-state studies of [MIII2MII5] wheels (MIII = Cr, Al; MII = Ni, Zn)†‡
Hector W. L.
Fraser
 a,
Gary S.
Nichol
 a,
Dušan
Uhrín
 a,
Ulla Gro
Nielsen
 b,
Marco
Evangelisti
 c,
Jürgen
Schnack
 *d and
Euan K.
Brechin
 *a
*a
aEaStCHEM School of Chemistry, The University of Edinburgh, David Brewster Road, Edinburgh, EH9 3FJ, Scotland, UK. E-mail: E.Brechin@ed.ac.uk; Tel: +44 (0)131-650-7545
bDepartment of Physics, Chemistry and Pharmacy, University of Southern Denmark, Campusvej 55, 5230 Odense M, Denmark
cInstituto de Ciencia de Materiales de Aragón, CSIC-Universidad de Zaragoza, 50009 Zaragoza, Spain
dFakultät für Physik, Universitat Bielefeld, Postfach 100131, D-33501 Bielefeld, Germany. E-mail: jschnack@uni-bielefeld.de
First published on 15th March 2018
Abstract
A family of heterometallic Anderson-type ‘wheels’ of general formula [MIII2MII5(hmp)12](ClO4)4 (where MIII = Cr or Al and MII = Ni or Zn giving [Cr2Ni5] (1), [Cr2Zn5] (2), [Al2Ni5] (3) and [Al2Zn5] (4); hmpH = 2-pyridinemethanol) have been synthesised solvothermally. The metallic skeleton common to all structures describes a centred hexagon with the MIII sites disordered around the outer wheel. The structural disorder has been characterised via single crystal X-ray crystallography, 1–3D 1H and 13C solution-state NMR spectroscopy of the diamagnetic analogue (4), and solid-state 27Al MAS NMR spectroscopy of compounds (3) and (4). Alongside ESI mass spectrometry, these techniques show that structure is retained in solution, and that the disorder is present in both the solution and solid-state. Solid-state dc susceptibility and magnetisation measurements on (2) and (3) reveal the Cr–Cr and Ni–Ni exchange interactions to be JCr–Cr = −1 cm−1 and JNi–Ni,r = −5 cm−1, JNi–Ni,c = 10 cm−1. Fixing these values allows us to extract JCr–Ni,r = −1.2 cm−1, JCr–Ni,c = 2.6 cm−1 for (1), the exchange between adjacent Ni and Cr ions on the ring is antiferromagnetic and between Cr ions on the ring and the central Ni ion is ferromagnetic.
Introduction
Heterometallic complexes containing transition metal ions have long been investigated across a breadth of chemical disciplines ranging from the synthesis of model complexes representing the active sites of proteins,1 molecular catalysts for water oxidation,2 the construction of supramolecular cages, capsules3 and porous materials,4 and the elucidation of magneto-structural relationships in molecule-based magnets.5 In the latter, heterometallic species have been employed to deliberately control exchange interactions in cyanide-bridged Prussian blue analogues,6 obtain enhanced magnetocaloric effects in cryogenic coolers,7 enforce spin frustration effects in high symmetry cages,8 understand the origins of the slow relaxation dynamics in single-molecule magnets (SMMs)9 and single-chain magnets (SCMs),10 and for the development of molecules that may act as quantum bits (qubits).11 A prominent, thoroughly investigated example of the latter is the large family of compounds based on [CrIII7NiII] rings.12 With this in mind, noting that recent reports of heterometallic 3d–3d cages are scarce in comparison to the plethora of 3d–4f species,13,14 we have initiated a project to examine the synthesis, structures and magnetic properties of heterometallic, mixed-valent species, beginning with the solution- and solid-state characterisation of [MIII2MII5] ‘wheels’ where MIII = Cr, Al and MII = Ni, Zn.A search of the Cambridge Structural Database (CSD) reveals that for polymetallic molecules containing both CrIII and NiII ions with a nuclearity of four or more, there are only ten unique structure types, and all but three belong to the [CrIII7NiII] family.15 Examples include [Cr14Ni2] and [Cr28Ni4] ‘linked rings’,16 wheels of varying size and metal ratios, such as [Cr9Ni], [Cr8Ni2], [Cr8Ni], [Cr7Ni2] and [Cr6Ni2],17,18 an ‘S-shaped’ [Cr12Ni3] chain,19 an unusual linear [Cr3Ni2] complex,20 and perhaps most pertinent to this work, a [CrNi6] wheel where the central MIII ion is surrounded by a ring of MII ions.21
The seven-membered centred wheel (or Anderson-type structure) is a well-known topology for homometallic 3d transition metal cluster compounds. These include numerous examples of Ni7,22 Co7,23 and mixed-valence Mn7 and Fe7 species,24,25 with Cu7 and Zn7 examples known, but less common.26,27 Heterometallic versions of the structure with 3d transition metal ions are much less common, the only examples being [Mn3Cr4],28 [Fe3Mn4],29 [V6MII] (where MII = Mn, Fe, Co or Ni),30,31 the aforementioned [CrMII6] (where MII = Ni or Co),21 and with one example combining 3d–4d metal ions, [Mo6Cr].32 Herein we present the synthesis and characterisation of a novel family of heterometallic Anderson-type wheels of general formula [MIII2MII5(hmp)12](ClO4)4 where MIII = Cr or Al and MII = Ni or Zn.
Experimental
Materials and physical measurements
All chemicals were procured from commercial suppliers and used as received (reagent grade). Elemental analyses for C, H, N and metal ions on all compounds were performed by Medac Ltd. Caution: Perchlorate salts of metal complexes with organic ligands are potentially explosive.Synthesis of [Cr2Ni5(hmp)12](ClO4)4·7MeOH (1)
Ni(ClO4)2·6H2O (0.366 g, 1 mmol), CrCl3·6H2O (0.133 g, 0.5 mmol) and NaOMe (0.162 g, 3 mmol) were dissolved in MeOH (24 mL) to give a cloudy blue solution. Upon full dissolution, hmpH (0.285 mL, 3 mmol) was added dropwise affording a dark blue solution. The reaction was left overnight with continuous stirring. 12 mL samples of the resulting solution were then heated in Teflon-lined autoclaves at 100 °C for 12 hours. After slowly cooling to room temperature the reaction vessels were allowed to sit undisturbed for 24 hours, yielding blue, block-shaped crystals suitable for X-ray diffraction. Yield 0.020 g (4.4% by Ni weight). Anal. calcd (%) for C72H72Cl4Cr2N12Ni5O28: C 41.32, H 3.47, Cr 4.97, Ni 14.02, N 8.03; found: C 40.68, H 3.45, Cr 5.12, Ni 14.15, N 7.52.Synthesis of [Cr2Zn5(hmp)12](ClO4)4·9MeOH (2)
Zn(ClO4)2·6H2O (0.372 g, 1 mmol), Cr(NO3)3·9H2O (0.200 g, 0.5 mmol) and NaOMe (0.162 g, 3 mmol) were dissolved in MeOH (24 mL) to give a cloudy pink solution. Upon full dissolution, hmpH (0.285 mL, 3 mmol) was added dropwise and the reaction was left overnight with continuous stirring. 12 mL samples of the resulting cloudy purple solution were heated in Teflon-lined autoclaves at 100 °C for 12 hours. After slowly cooling to room temperature the reaction vessels were allowed to sit undisturbed for 24 hours yielding light purple, plate-shaped crystals suitable for X-ray diffraction. Yield 0.143 g (29.7% by Zn weight). Anal. calcd (%) for C72H72Cl4Cr2N12Zn5O28: C 40.67, H 3.41, Cr 4.89, Zn 15.38, N 7.90; found: C 40.96, H 3.30, Cr 5.01, Zn 15.03, N 7.96.Synthesis of [Al2Ni5(hmp)12](ClO4)4·9MeOH (3)
Ni(ClO4)2·6H2O (0.366 g, 1 mmol), Al(NO3)3·9H2O (0.188 g, 0.5 mmol) and NaOMe (0.162 g, 3 mmol) were dissolved in MeOH (24 mL) to give a light green solution. Upon full dissolution, hmpH (0.285 mL, 3 mmol) was added dropwise giving a colour change to blue. The reaction was left overnight with continuous stirring. 12 mL samples of the resulting blue solution were heated in Teflon-lined autoclaves at 100 °C for 12 hours. After slowly cooling to room temperature the reaction vessels were allowed to sit undisturbed for 24 hours yielding turquoise, plate-shaped crystals suitable for X-ray diffraction. Yield 0.052 g (11.2% by Ni weight). Anal. calcd (%) for C72H72Cl4Al2N12Ni5O28: C 42.34, H 3.55, Al 2.64, Ni 14.37, N 8.23; found: C 41.93, H 3.41, Al 2.55, Ni 15.06, N 8.37.Synthesis of [Al2Zn5(hmp)12](ClO4)4·8MeOH (4)
Zn(ClO4)2·6H2O (0.372 g, 1 mmol), Al(NO3)3·9H2O (0.188 g, 0.5 mmol) and NaOMe (0.162 g, 3 mmol) were dissolved in MeOH (24 mL) to give a cloudy white solution. Upon full dissolution, hmpH (0.285 mL, 3 mmol) was added dropwise and the reaction was left overnight with continuous stirring. 12 mL samples of the resulting cloudy white solution were heated in Teflon-lined autoclaves at 100 °C for 12 hours. After slowly cooling to room temperature the reaction vessels were allowed to sit undisturbed for 24 hours yielding colourless, plate-shaped crystals suitable for X-ray diffraction. Yield 0.075 g (16.1% by Zn weight). Anal. calcd (%) for C72H72Cl4Al2N12Zn5O28: C 41.65, H 3.50, Al 2.60, Zn 15.75, N 8.10; found: C 40.99, H 3.45, Al 2.58, Zn 15.60, N 8.22.X-ray crystallography
Diffraction data for samples 1–4 were collected using Bruker SMART APEXII (1) or Rigaku Oxford Diffraction SuperNova (2–4) diffractometers with MoKα (1, 2 & 4) and CuKα (3) radiation, and are given in Table S1 in the ESI.‡ An Oxford Cryosystems Cryostream 700+ low temperature device was used to maintain a crystal temperature of 120.0 K for all experiments. The structures were solved using ShelXT and refined with ShelXL interfaced through Olex2.33,34 All non-hydrogen atoms were refined using anisotropic displacement parameters. H atoms were placed in calculated positions geometrically and refined using the riding model. Unit cell parameters for 2 were also obtained at T = 3.4 K – see the ESI‡ for details. CCDC: 1819131–1819134.‡Magnetic data
Dc susceptibility and magnetisation data were measured on powdered, polycrystalline samples of 1–3 in the T = 2–300 K and B = 0–7 T temperature and field ranges on a Quantum Design MPMS XL SQUID magnetometer equipped with a 7 T dc magnet. Diamagnetic corrections were applied to the data using Pascal's constants.Solution NMR spectroscopy
NMR spectra were recorded in DMSO-d6 solutions on an 800 MHz Bruker AVANCE III spectrometer equipped with a 5 mm triple-resonance TCI cryoprobe. The 300 K 2D 1H, 13C HSQC spectrum of 4 was acquired using Bruker pulse program hsqcedetgpsisp2.3 allowing multiplicity-editing. The following parameters were used: t1 and t2 acquisition times of 19.5 and 116 ms, spectral widths of 130 and 11 in F1 and F2 ppm, respectively, 50% non-uniform sampling and relaxation times of 2 s, yielding the overall acquisition of 1 hour and 15 min. The 2D DOSY spectrum of 4 was acquired using the Bruker pulse program ledbpgp2s. 32.35 Linear incrementation of pulsed field gradients (PFGs) from 2 to 100% of the maximum strength (53 Gauss cm−1) was used together with a diffusion time of 100 ms and eddy current recovery time of 5 ms. The length of the diffusion coding PFGs was 1.5 ms; all other gradients were 600 μs long. The PFGs were Chirp pulse shaped. The data were fitted using a single exponential function.Solid-state NMR spectroscopy
Single pulse 27Al MAS NMR spectra were recorded on an Agilent 600 MHz NMR spectrometer (14.1 T) using 1.6 mm (30–28 kHz spinning speed) and 3.2 mm (15 kHz spinning speed) MAS NMR probes for compounds 3 and 4, respectively. The spectra are referenced to a 1 M AlCl3 aqueous solution and were analysed using VnmrJ software.Mass spectrometry
Mass spectrometry was performed on compound 4 on a Synapt G2 (Waters, Manchester, UK) mass spectrometer, using a direct infusion electrospray ionization source (ESI), controlled using MassLynx v4.1 software. Due to the relatively low solubility of 4, it was dissolved in acetonitrile with 10% DMF at 50 μM. Prior to analysis, instruments were calibrated using a solution of sodium iodide (2 mg mL−1) in 50![[thin space (1/6-em)]](https://www.rsc.org/images/entities/char_2009.gif) :
:![[thin space (1/6-em)]](https://www.rsc.org/images/entities/char_2009.gif) 50 water
50 water![[thin space (1/6-em)]](https://www.rsc.org/images/entities/char_2009.gif) :
:![[thin space (1/6-em)]](https://www.rsc.org/images/entities/char_2009.gif) isopropanol. Capillary voltages were adjusted between 1.5 and 2.5 kV to optimize spray quality, while the sampling cone and the extraction cone voltage were minimised to reduce breakdown of the assemblies. Source temperature was set at 80 °C. The data was analysed using MassLynx v4.1 software.
isopropanol. Capillary voltages were adjusted between 1.5 and 2.5 kV to optimize spray quality, while the sampling cone and the extraction cone voltage were minimised to reduce breakdown of the assemblies. Source temperature was set at 80 °C. The data was analysed using MassLynx v4.1 software.
Results and discussion
Structural description
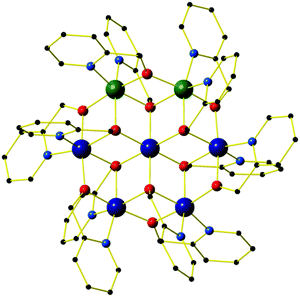
All four compounds are isostructural, and so for the sake of brevity we provide a generic description. The molecular structure of the cation of 1 is shown in Fig. 1, with pertinent structural data listed in Tables 1 and 2. All four compounds crystallise in the trigonal space group R![[3 with combining macron]](https://www.rsc.org/images/entities/char_0033_0304.gif) , with just the central metal ion, one outer metal ion, two hmp− ligands and two ClO4− anions in the asymmetric unit. This presents two distinct metal sites in the cationic cluster: the central metal is always an MII ion (Ni (1, 3) or Zn (2, 4)) bridged to each outer metal ion via two μ3-OR groups belonging to two hmp− ligands. Symmetry expansion therefore reveals the central metal ion to have a [MIIO6] octahedral coordination sphere. The six outer metal ions in the wheel are crystallographically equivalent: disorder is manifested with the MIII ions being equally distributed around all ring positions such that each site has an occupancy of 1/3 MIII and 2/3 MII, and an average charge of +2.33. This was modelled with a 5
, with just the central metal ion, one outer metal ion, two hmp− ligands and two ClO4− anions in the asymmetric unit. This presents two distinct metal sites in the cationic cluster: the central metal is always an MII ion (Ni (1, 3) or Zn (2, 4)) bridged to each outer metal ion via two μ3-OR groups belonging to two hmp− ligands. Symmetry expansion therefore reveals the central metal ion to have a [MIIO6] octahedral coordination sphere. The six outer metal ions in the wheel are crystallographically equivalent: disorder is manifested with the MIII ions being equally distributed around all ring positions such that each site has an occupancy of 1/3 MIII and 2/3 MII, and an average charge of +2.33. This was modelled with a 5![[thin space (1/6-em)]](https://www.rsc.org/images/entities/char_2009.gif) :
:![[thin space (1/6-em)]](https://www.rsc.org/images/entities/char_2009.gif) 2 substitutional disorder ratio of metal centres by splitting the unique site into two separate parts with identical, constrained co-ordinates and anisotropic displacement parameters – see CIF files for full details. Thus the metallic skeleton can be described as a centred [MIII2MII5] hexagon or wheel existing as three isomers whereby the two MIII sites are located at positions 1,2 1,3 or 1,4 (in a 2
2 substitutional disorder ratio of metal centres by splitting the unique site into two separate parts with identical, constrained co-ordinates and anisotropic displacement parameters – see CIF files for full details. Thus the metallic skeleton can be described as a centred [MIII2MII5] hexagon or wheel existing as three isomers whereby the two MIII sites are located at positions 1,2 1,3 or 1,4 (in a 2![[thin space (1/6-em)]](https://www.rsc.org/images/entities/char_2009.gif) :
:![[thin space (1/6-em)]](https://www.rsc.org/images/entities/char_2009.gif) 2
2![[thin space (1/6-em)]](https://www.rsc.org/images/entities/char_2009.gif) :
:![[thin space (1/6-em)]](https://www.rsc.org/images/entities/char_2009.gif) 1 ratio) around the ring (vide infra) (Fig. 5).
1 ratio) around the ring (vide infra) (Fig. 5).
| M–M [Å] | r [Å] | Φ [°] | |
|---|---|---|---|
| 1 | 3.120 | 2.040–2.111 | 96.41, 98.67 |
| 2 | 3.200 | 2.092–2.183 | 96.58, 99.41 |
| 3 | 3.091 | 2.013–2.094 | 96.23, 98.79 |
| 4 | 3.186 | 2.071–2.178 | 96.54, 99.95 |
| M–M [Å] | r [Å] | Φ [°] | |
|---|---|---|---|
| 1 | 3.124 | 1.968–2.111 | 97.63, 103.92 |
| 2 | 3.210 | 1.963–2.183 | 97.32, 109.33 |
| 3 | 3.097 | 1.938–2.094 | 97.86, 105.70 |
| 4 | 3.197 | 1.944–2.178 | 97.57, 109.32 |
The outer metal ions are bridged to each other by one μ-OR (hmp−) group on the ‘outside’ of the wheel and one μ3-OR (hmp−) group on the ‘inside’ of the wheel, their octahedral coordination geometries completed by two terminally bonded N-atoms from the same ligands. In total there are twelve hmp− ligands adorning the outside of the cage, six above and six below the plane of seven metal ions. Charge balance is maintained through the presence of four ClO4− anions, two of which sit directly above and below the plane of the metal ions, the three O-atoms closely associated with the three methylene groups of the hmp− ligands (Cl–O⋯H(CH2) ≈ 2.7 Å). In the extended structure, the wheels of compounds 1–4 are arranged in layers in the ab plane, the perchlorate anions sitting in between. This produces an aesthetically pleasing hexagonal close packed array when viewed down the c-axis (Fig. 2). There are numerous short inter-molecular contacts between the aromatic rings of the hmp− ligands on neighbouring wheels, with the closest C–C distances being ∼3.8 Å, and between the aromatic rings and ClO4− anions, with closest C–O distances of ∼3 Å.
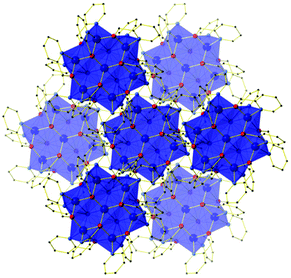 | ||
| Fig. 2 Crystal packing common to compounds 1–4 as viewed down the c-axis, highlighting the hexagonal close packed arrangement of layers of molecules. H atoms, solvent and anions omitted for clarity. | ||
Solution NMR spectroscopy of 4
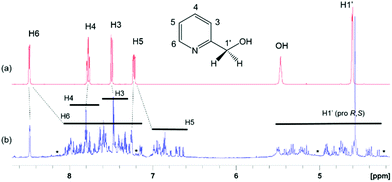
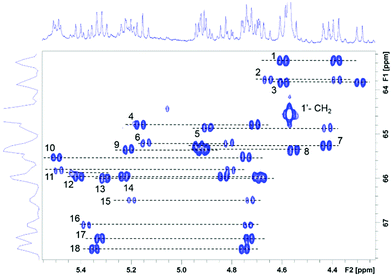
The 1D 1H (Fig. 3) and 2D 1H, 13C HSQC spectra of 4 (Fig. 4 and ESI Fig. S1‡) show a large chemical shift dispersion of resonances corresponding to the individual signals of the hmp− ligand. The 1D 1H spectrum is dominated by a number of overlapping signals corresponding to different environments of H1′ to H6 protons of hmp− ligands associated with different metal substitutions. This is due to a combination of unique through-bond and through-space effects in the individual complexes. In addition, the spectrum also contains signals of free hmpH originating from partially degraded 4 and some minor signals likely belonging to degradation products.The H6 and H5 ligand resonances are generally shielded, while the CH2 protons are mostly deshielded relative to the corresponding protons of free hmpH; the H3, H4 signals are less affected and protons of individual forms experience either shielding or deshielding. The largest spread of resonances is seen for diastereotopic H1′ protons, followed by H6 protons, likely due to their closer proximity to the metal ions.
The CH2 resonances, as seen in the 2D 1H, 13C HSQC spectrum (Fig. 4), are particularly informative. The lack of rotation of this side chain causes the pro-S and pro-R protons to acquire a distinct chemical shift and a doublet character due to appearance of 2JHH couplings. Altogether 18 pairs of CH2 resonances were identified, in perfect agreement with the model of the metal disorder (Fig. 5). The intensity of these cross peaks is non-uniform, indicating that not all metal occupancies are equally probable.
 | ||
| Fig. 5 Schematic representation showing the 18 non-equivalent hmp− ligand environments in compound 4. Colour code as Fig. 1. | ||
The heterogeneity deduced from the inspection of the CH2 resonances is also seen for C3/H3 to C6/H6 sites (ESI Fig. S1‡). Here between 14 and 18 different correlations were identified for individual atom pairs. This reduction (maximum of 18) is caused by a degeneracy of chemical shifts in some structural isomers, resulting in signal overlap.
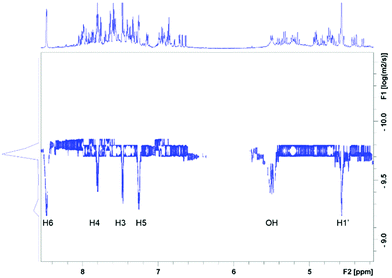
Complex 4 was further characterised by acquiring a diffusion ordered spectrum (DOSY) (Fig. 6).35 In this spectrum all 1H resonances of 4 are placed on one line indicating identical diffusion properties, i.e. hydrodynamic radius of all complexes. The DOSY spectrum also contains signals of hmpH appearing, as expected, at much smaller diffusion coefficients. The variations in diffusion coefficient of hmpH observed for individual protons is caused by the varying degree of overlap with the signals of 4, resulting in inaccurate positioning of its DOSY signals in the spectrum. Minor signal intensities seen slightly above or below the line of the main resonances of 4 correspond to areas with a poor signal-to-noise ratio and cannot be reliably interpreted as larger or smaller molecules.
Summarising the information provided by the solution-state NMR: even though it was not possible to associate the individual cross peaks to specific isomers of 4, the results show that solution-state NMR spectroscopy of diamagnetic metal complexes can identify, and to some extent, qualify their structural heterogeneity, also providing information on their relative sizes. The solution-state NMR confirms the metal disorder observed in their solid-state structures.
Solid-state NMR spectroscopy
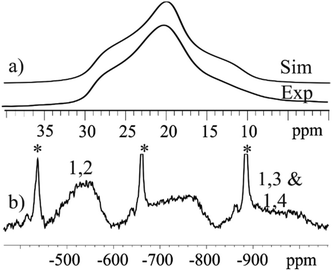
Solid state 27Al MAS NMR was used to probe the local metal environments in 3 and 4. The diamagnetic analogue 4 contains a single 27Al resonance with second order quadrupole line-shape. The line-shape can be simulated by a single 27Al NMR site with δiso(27Al) = 18.9(10) ppm, CQ = 5.25(5) MHz, and η = 0.87(5), as illustrated in Fig. 7(a). The isotropic chemical shift value is characteristic of octahedral Al and the fairly large quadrupole coupling constant, CQ, implies a distorted bonding environment. The three possible combinations of the Al positions on the outer parts of the wheel (Fig. 5) cannot be distinguished by solid state NMR, as the difference in isotropic shifts is negligible compared to the line-width, as also observed in ZnAl-layered double hydroxides,36 which contain a similar structural building block.In contrast, the 27Al MAS NMR spectrum of paramagnetic compound 3 shows the presence of two different 27Al resonances with δiso(27Al) = −550(40) ppm and −940(60) ppm (Fig. 7(b)). The presence of paramagnetic Ni2+ results in a contact shift in addition to the diamagnetic isotropic shift,37 which move the resonances outside the conventional chemical shift range for diamagnetic materials. To a first approximation, the hyperfine shift in inorganic materials is proportional to the number of neighbouring Ni ions. Thus, the 1,2 confomer has two Ni ions, whereas both the 1,3 and 1,4 conformers have three Ni ions as neighbours. We therefore assign the site at −560(40) ppm to the 1,2 conformer, whereas the other two coincide to the second resonance at −960(60) ppm. The resonances are very broad (20 kHz) due to fast relaxation caused by the paramagnetic Ni ions, and this does not allow us to resolve the 1,3 and 1,4 conformers.
Mass spectrometry
Electrospray ionisation mass spectrometry (ESI-MS) was carried out on a solution of 4 dissolved in acetonitrile and DMF, with the results showing that compound 4 is stable in solution as [M + 2H]2+ (Fig. 8). The most intense peak in the spectrum corresponds to the ion [M + 2H]2+ where M = [Al2Zn5(hmp)12](ClO4)2 and appears at m/z = 938. The unfragmented 4+ cationic part of the complex remains associated with two of the perchlorate counter ions. We speculate that these are most likely the two that sit above and below the wheel as these have closer contacts to the cationic cluster. No other peaks could be identified from the spectrum. The observed solution stability is in agreement with the findings from the solution-state NMR spectroscopy.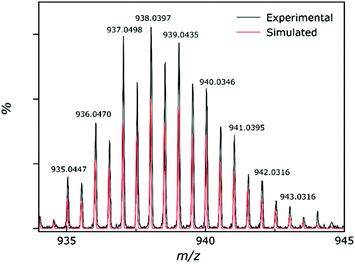 | ||
| Fig. 8 Experimental (black) and simulated (red) peaks for the partial mass spectrum of 4, showing the [M + 2H]2+ ion. | ||
Magnetometry
The magnetic properties of [Cr2Ni5] (1), [Cr2Zn5] (2) and [Al2Ni5] (3) were modelled using Heisenberg models for the various possible configurations (a), (b), and (c) displayed in Fig. 9 and equivalently in Fig. 5. Due to symmetry, configurations (a) and (b) contribute with a weight of 2/5 to the average magnetic observables, whereas (c) contributes 1/5.Our philosophy in attempting to fit the magnetic data for these rather complex and disordered molecules is to extract reasonably accurate values for the dominant exchange interactions using the simplest model possible, whilst avoiding ‘over-analysis’ and any exaggeration of the absolute precision of the parameters so-obtained. It is important to note that the employed model does not include additional (albeit small) contributions, such as anisotropies or next-nearest neighbour exchange interactions. Firstly, from compound 2 it was possible to fit JCr–Cr as this exchange appears only in configuration (a). The respective Hamiltonian reads:
The measured data is consistent with JCr–Cr = −1.0 cm−1 and g = 2.0 when fitted with this Hamiltonian (Fig. 10).
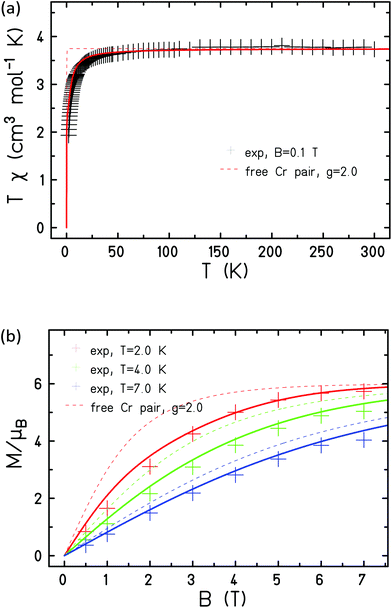 | ||
| Fig. 10 Experimental (+) and simulated (lines) magnetic susceptibility (a) and magnetisation (b) of 2. | ||
In order to model compound 3 two exchange interactions are necessary; JNi–Ni,r for nearest neighbour exchange around the ring and JNi–Ni,c for the exchange to the central Ni ion, fixing gNi = 2.15. Good agreement with the experimental data, as observed in Fig. 11, can be achieved upon with an antiferromagnetic interaction between nearest neighbours on the ring, JNi–Ni,r = −5.0 cm−1, and a ferromagnetic interaction to the central Ni ion, JNi–Ni,c = 10.0 cm−1.
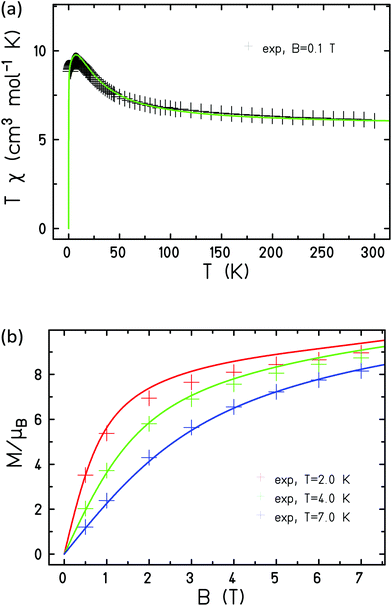 | ||
| Fig. 11 Experimental (+) and simulated (lines) magnetic susceptibility (a) and magnetisation (b) of 3. | ||
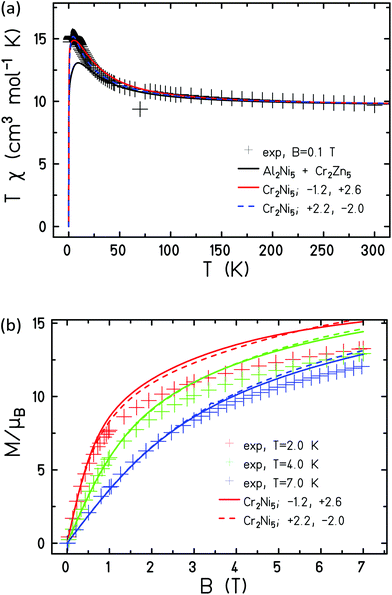
Assuming that the obtained exchange parameters JCr–Cr, JNi–Ni,r and JNi–Ni,c do not change their values in 1, we can proceed to determine the remaining exchange parameters between Ni and Cr ions on the ring, JCr–Ni,r, as well as between a peripheral Cr ion and the central Ni ion, JCr–Ni,c. Looking at the magnetic susceptibility in Fig. 12(a) one notices that the experimental data show a stronger polarization at small temperatures than expected from a simple combination of the data of 2 and 3. Although one could speculate that such behaviour points at additional ferromagnetic interactions in 1, the fitting appeared more complicated and not fully conclusive. Indeed, we found two rather similar fits with opposite characteristics. In the first solution (solid coloured curves in Fig. 12), JCr–Ni,r = −1.2 cm−1, JCr–Ni,c = 2.6 cm−1, the exchange between adjacent Ni and Cr ions on the ring is antiferromagnetic, with that between Cr ions on the ring and the central Ni ion, ferromagnetic. For the second solution (coloured curves in Fig. 12), JCr–Ni,r = 2.2 cm−1, JCr–Ni,c = −2.0 cm−1; i.e. the inverse is true. For the spectroscopic splitting factors we assumed gCr = 2.0 and gNi = 2.15 as in 2 and 3.
Although the second data set appears to fit the susceptibility somewhat better, we believe that our measurements cannot discriminate between scenarios since the neglected single-ion anisotropy, especially of the NiII ions, may play a more prominent role in 1. However, despite the limitations of the model and the simplistic methodology employed, agreement between experiment and simulation is remarkably good in all three cases, highlighting the advantage of being able to prepare and characterise all of the paramagnetic–diamagnetic ‘building blocks’ of the fully paramagnetic cage.
Conclusions
The solvothermal reaction between the perchlorate salt of MII ions and either the chloride or nitrate salts of MIII ions in a basic solution of the hmpH ligand has yielded a new family of heterometallic Anderson-type wheels of general formula [MIII2MII5(hmp)12](ClO4)4. The wheels display substitutional disorder in the positions of the MIII and MII ions around the outside ring, which has been quantified and characterised through the combination of single-crystal X-ray diffraction, and solution- and solid-state NMR spectroscopy. This reveals the presence of three isomers, with the CrIII ions positioned at the 1,2 1,3 and 1,4 sites around the wheel. NMR and mass spectrometry data also confirm that the solid-state structure persists in solution. Magnetic susceptibility and magnetisation data for 1–3 was fitted in a sequential manner: the Cr–Cr exchange interaction was obtained from the data of complex 2, and the Ni–Ni exchange interactions were obtained from the data of 3. These values were then fixed, allowing the Cr–Ni interactions in 1 to be extracted. The combination of solution- and solid-state techniques has therefore proved invaluable in the quantitative understanding of the physical properties of a large, complex, and structurally disordered molecule.Conflicts of interest
There are no conflicts of interest to declare.Acknowledgements
EKB thanks the EPSRC for funding (EP/N01331X/1, EP/P025986/1). We acknowledge Drs Charlie McMonagle and Michael Probert (Newcastle University) for collecting single-crystal unit cell data at T = 3.4 K. UGN acknowledges funding from the Villum Young Investigator (VKR022364) and the Danish Council for Independent Research – Natural Sciences (DFF – 7014-00198). Mr Nicholai D. Jensen is thanked for help with acquisition of the 27Al NMR spectra. ME thanks MINECO for funding (MAT2015-68204-R).Notes and references
- S. C. Lee and R. H. Holm, Chem. Rev., 2004, 104, 1135–1157 CrossRef CAS PubMed.
- J. D. Blakemore, R. H. Crabtree and G. W. Brudvig, Chem. Rev., 2015, 115, 12974–13005 CrossRef CAS PubMed.
- J. L. Atwood and J. M. Lehn, Comprehensive Supramolecular Chemistry, Pergamon, Oxford, 1996 Search PubMed.
- M. O'Keeffe and O. M. Yaghi, Chem. Rev., 2012, 112, 675–702 CrossRef PubMed.
- R. D. Willett, D. Gatteschi and O. Kahn, Magneto-Structural Correlations in Exchange Coupled Systems, D. Reidel, Dordrecht, 1985 Search PubMed.
- J. N. Rebilly and T. Mallah, Single-Molecule Magnets and Related Phenomena, 2006, vol. 122, pp. 103–131 Search PubMed.
- M. Evangelisti and E. K. Brechin, Dalton Trans., 2010, 39, 4672–4676 RSC.
- J. Schnack, Dalton Trans., 2010, 39, 4677–4686 RSC.
- C. J. Milios and R. E. P. Winpenny, Molecular Nanomagnets and Related Phenomena, 2015, vol. 164, pp. 1–109 Search PubMed.
- C. Coulon, V. Pianet, M. Urdampilleta and R. Clérac, Molecular Nanomagnets and Related Phenomena, 2015, vol. 164, pp. 143–184 Search PubMed.
- D. Aguilà, L. A. Barrios, V. Velasco, O. Roubeau, A. Repollés, P. J. Alonso, J. Sesé, S. J. Teat, F. Luis and G. Aromí, J. Am. Chem. Soc., 2014, 136, 14215–14222 CrossRef PubMed.
- J. Ferrando-Soria, E. M. Pineda, A. Chiesa, A. Fernandez, S. A. Magee, S. Carretta, P. Santini, I. J. Vitorica-Yrezabal, F. Tuna, G. A. Timco, E. J. L. McInnes and R. E. P. Winpenny, Nat. Commun., 2016, 7, 11377 CrossRef CAS PubMed.
- L. R. Piquer and E. C. Sañudo, Dalton Trans., 2015, 44, 8771–8780 RSC.
- R. E. P. Winpenny, Chem. Soc. Rev., 1998, 27, 447–452 RSC.
- F. K. Larsen, E. J. L. McInnes, H. El Mkami, J. Overgaard, S. Piligkos, G. Rajaraman, E. Rentschler, A. A. Smith, G. M. Smith, V. Boote, M. Jennings, G. A. Timco and R. E. P. Winpenny, Angew. Chem., Int. Ed., 2003, 42, 101–105 CrossRef CAS PubMed.
- G. A. Timco, E. J. L. McInnes, R. G. Pritchard, F. Tuna and R. E. P. Winpenny, Angew. Chem., Int. Ed., 2008, 47, 9681–9684 CrossRef CAS PubMed.
- G. A. Timco, A. S. Batsanov, F. K. Larsen, C. A. Muryn, J. Overgaard, S. J. Teat and R. E. P. Winpenny, Chem. Commun., 2005, 3649–3651 RSC.
- E. J. L. McInnes, G. A. Timco, G. F. S. Whitehead and R. E. P. Winpenny, Angew. Chem., Int. Ed., 2015, 54, 14244–14269 CrossRef CAS PubMed.
- S. L. Heath, R. H. Laye, C. A. Muryn, N. Lima, R. Sessoli, R. Shaw, S. J. Teat, G. A. Timco and R. E. R. Winpenny, Angew. Chem., Int. Ed., 2004, 43, 6132–6135 CrossRef CAS PubMed.
- O. S. Manole, A. S. Batsanov, Y. T. Struchkov, G. A. Timko, L. D. Synzheryan and N. V. Gerbeleu, Koord. Khim., 1994, 20, 231–237 CAS.
- F. E. Kakaroni, A. Collet, E. Sakellari, D. I. Tzimopoulos, M. Siczek, T. Lis, M. Murrie and C. J. Milios, Dalton Trans., 2018, 47, 58–61 RSC.
- J. Zhang, P. Teo, R. Pattacini, A. Kermagoret, R. Welter, G. Rogez, T. S. Hor and P. Braunstein, Angew. Chem., Int. Ed., 2010, 49, 4443–4446 CrossRef CAS PubMed.
- R. Pattacini, P. Teo, J. Zhang, Y. H. Lan, A. K. Powell, J. Nehrkorn, O. Waldmann, T. S. A. Hor and P. Braunstein, Dalton Trans., 2011, 40, 10526–10534 RSC.
- R. W. Saalfrank, T. Nakajima, N. Mooren, A. Scheurer, H. Maid, F. Hampel, C. Trieflinger and N. Daub, Eur. J. Inorg. Chem., 2005, 1149–1153 CrossRef CAS.
- H. Oshio, N. Hoshino, T. Ito, M. Nakano, F. Renz and P. Gütlich, Angew. Chem., Int. Ed., 2003, 42, 223 CrossRef CAS PubMed.
- M. Tesmer, B. Müller and H. Vahrenkamp, Chem. Commun., 1997, 721–722 RSC.
- J. A. Przyojski, N. N. Myers, H. D. Arman, A. Prosvirin, K. R. Dunbar, M. Natarajan, M. Krishnan, S. Mohan and J. A. Walmsley, J. Inorg. Biochem., 2013, 127, 175–181 CrossRef CAS PubMed.
- V. V. Semenaka, O. V. Nesterova, V. N. Kokozay, R. I. Zybatyuk, O. V. Shishkin, R. Boca, D. V. Shevchenko, P. Huang and S. Styring, Dalton Trans., 2010, 39, 2344–2349 RSC.
- R. W. Saalfrank, R. Prakash, H. Maid, F. Hampel, F. W. Heinemann, A. X. Trautwein and L. H. Böttger, Chem. – Eur. J., 2006, 12, 2428–2433 CrossRef CAS PubMed.
- M. I. Khan, S. Tabussum and R. J. Doedens, Chem. Commun., 2003, 532–533 RSC.
- M. I. Khan, S. Tabussum, R. J. Doedens, V. O. Golub and C. J. O'Connor, Inorg. Chem., 2004, 43, 5850–5859 CrossRef CAS PubMed.
- S. Golhen, L. Ouahab, D. Grandjean and P. Molinie, Inorg. Chem., 1998, 37, 1499–1506 CrossRef CAS.
- G. M. Sheldrick, Acta Crystallogr., Sect. C: Struct. Chem., 2015, 71, 3–8 CrossRef PubMed.
- O. V. Dolomanov, L. J. Bourhis, R. J. Gildea, J. A. K. Howard and H. Puschmann, J. Appl. Crystallogr., 2009, 42, 339–341 CrossRef CAS.
- D. H. Wu, A. D. Chen and C. S. Johnson, J. Magn. Reson., Ser. A, 1995, 115, 260–264 CrossRef CAS.
- S. S. C. Pushparaj, C. Forano, V. Prevot, A. S. Lipton, G. J. Rees, J. V. Hanna and U. G. Nielsen, J. Phys. Chem. C, 2015, 119, 27695–27707 CAS.
- S. A. Rouf, V. B. Jakobsen, J. Mares, N. D. Jensen, C. J. McKenzie, J. Vaara and U. G. Nielsen, Solid State Nucl. Magn. Reson., 2017, 87, 29–37 CrossRef CAS PubMed.
Footnotes |
| † In celebration of the 60th birthday of Professor Kim R. Dunbar. |
| ‡ Electronic supplementary information (ESI) available: Additional details for X-ray crystallography and structure, NMR studies and magnetic measurements. CCDC 1819131–1819134. For ESI and crystallographic data in CIF or other electronic format see DOI: 10.1039/c8dt00685g |
| This journal is © The Royal Society of Chemistry 2018 |

